ICAEW chart of the week: IMF economic projections

Our chart this week is on the global economy and how the UK is at the bottom of the IMF’s league table for economic growth in 2023 and 2024.

Chart showing the annualised rate of real GDP growth projected for 30 countries by the IMF for 2023 and 2024, together with global averages. Different colours are used to classify countries between (i) emerging markets and developing economies (ii) global averages (iii) advanced economies excluding UK and (iv) UK.

Starts with India at the top at +6.4% and ends with the UK at at the bottom with growth of 0.1%.

Details are in the text below.

The IMF reported in its World Economic Outlook Update published on 30 January 2023 that it expects global economic output to increase by an average of 3.0% or 2.4% over the course of 2023 and 2024, depending on whether you weight the relative sizes of each economy using purchasing power parity (PPP) or market exchange rates.

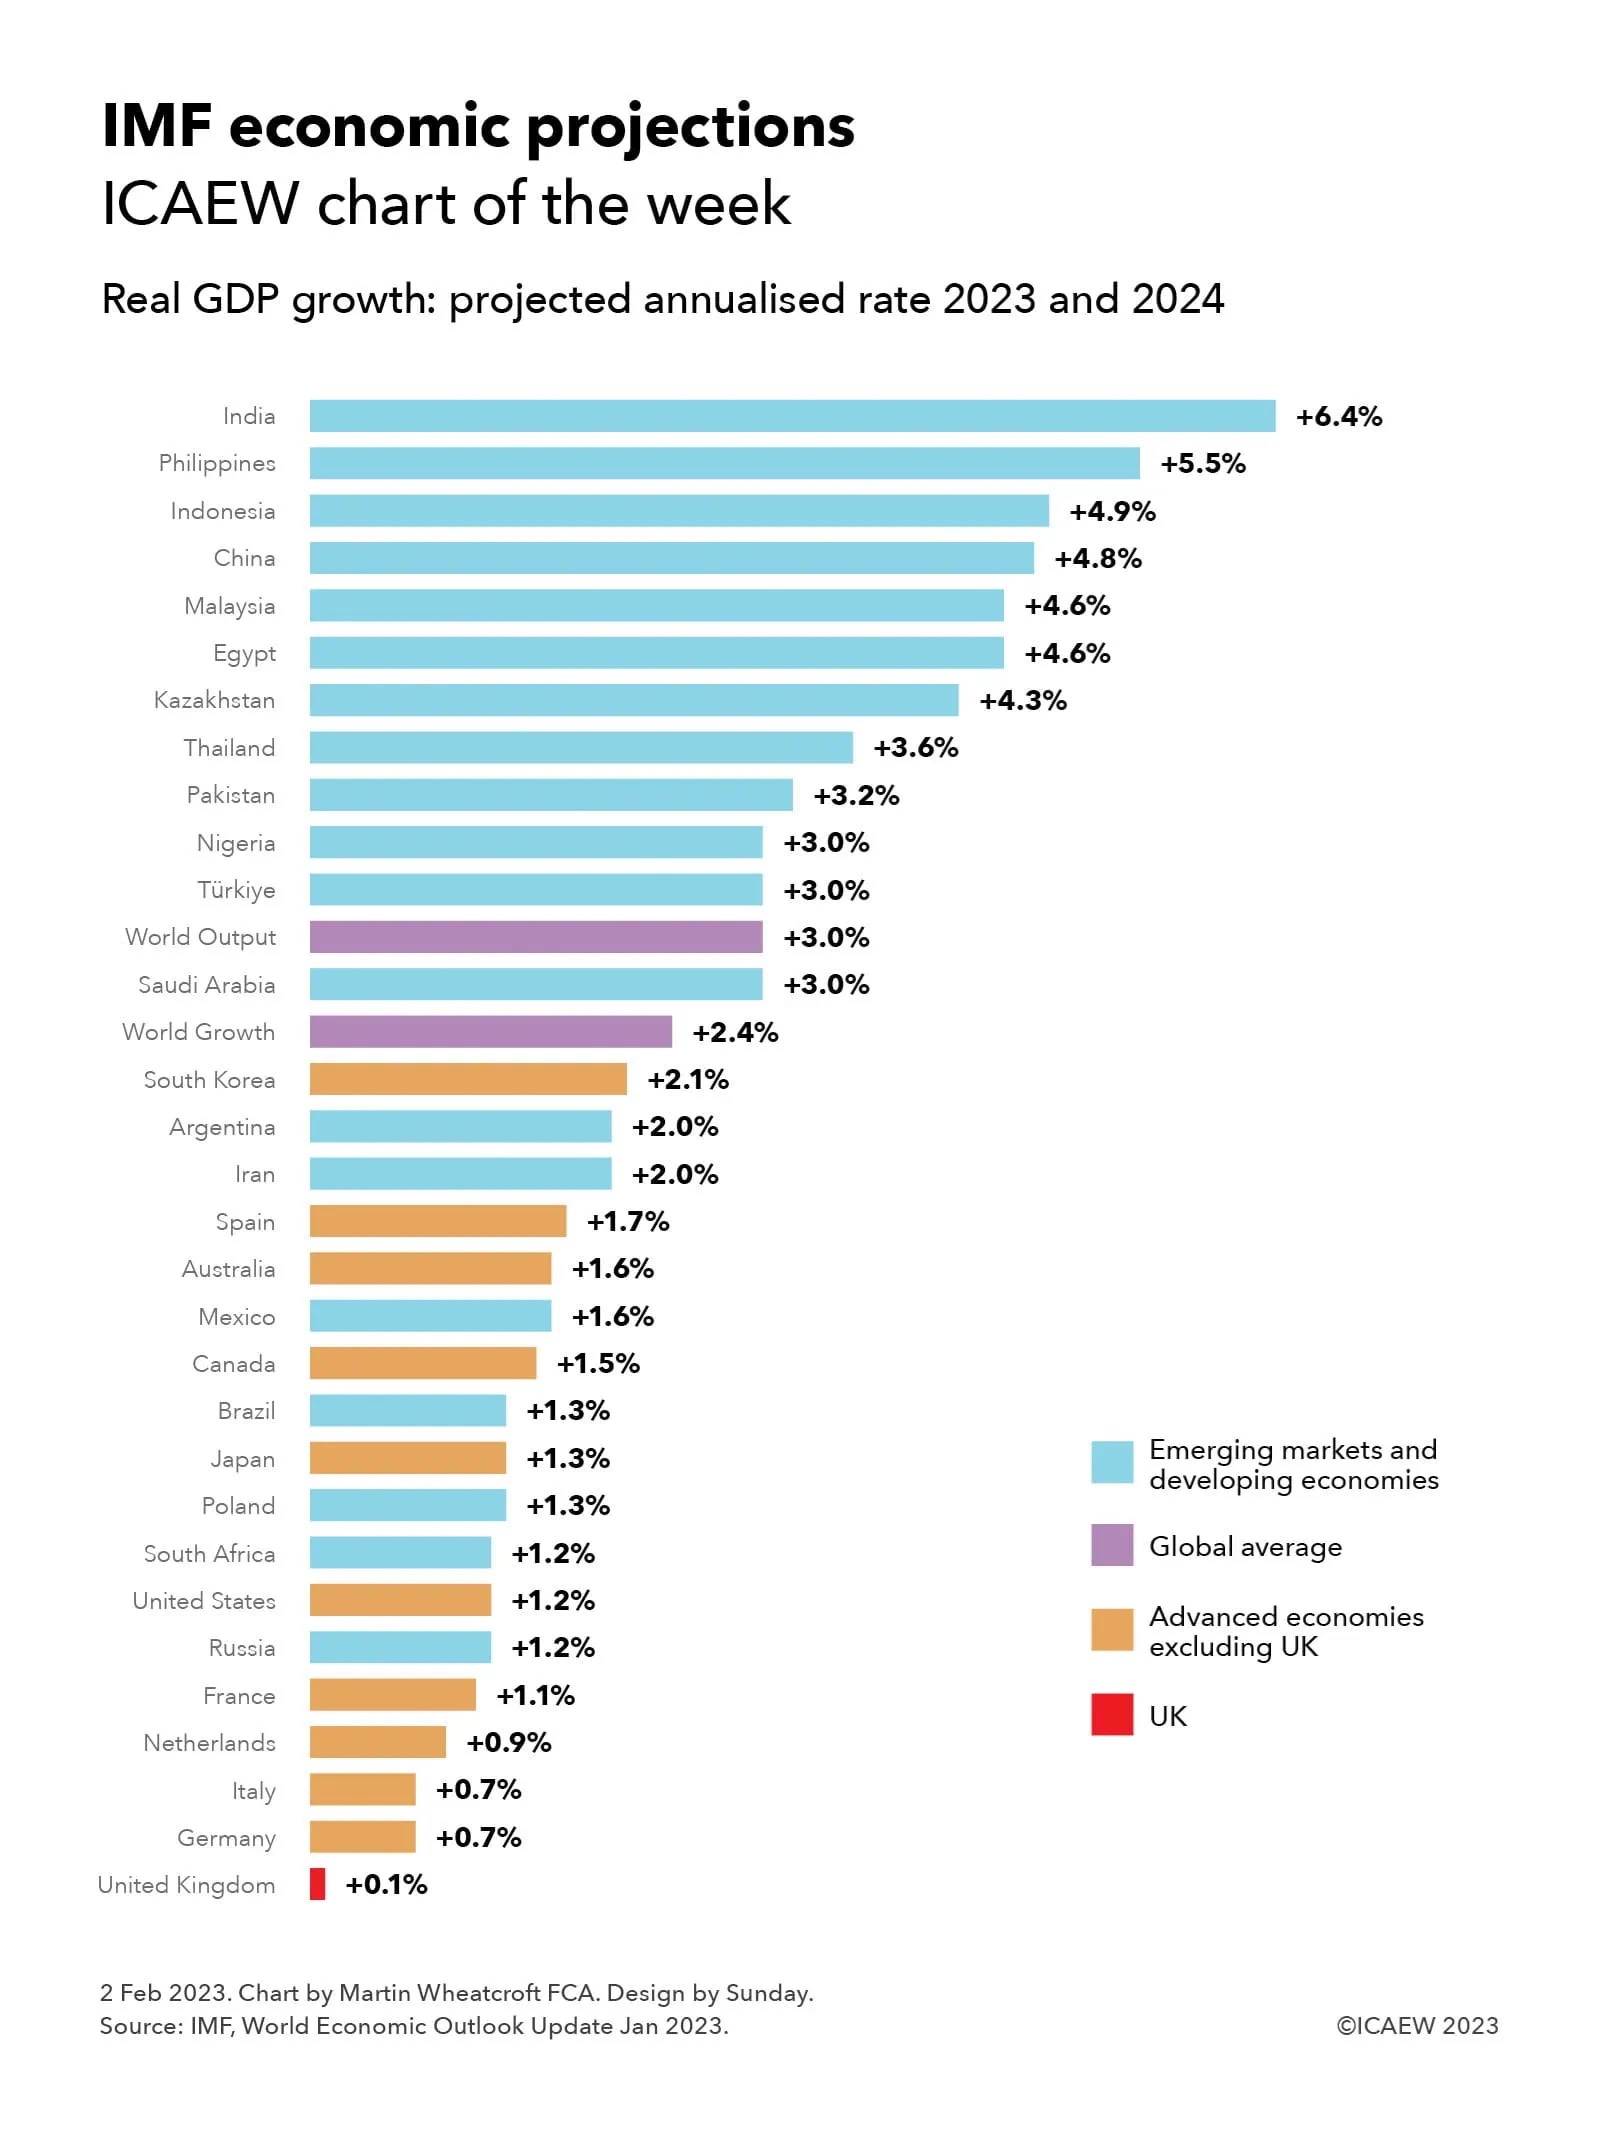
While headlines have focused on the more immediate prospects for economies around the world in 2023 and an expected recession in the UK, our chart takes a look at projected economic growth for both 2023 and 2024 for the 30 countries tracked by the IMF.

The UK is at the bottom of this table, with a projected economic contraction of 0.6% in 2023 combined with projected growth of 0.9% in 2024 being equivalent to annualised economic growth after taking account of inflation of 0.1% over two years.

This does not compare well with projected real economic growth in the other G7 nations: Germany 0.7% (0.1% in 2023 and 1.4% in 2024), Italy 0.7% (0.6% and 0.9%), France 1.1% (0.7% and 1.6%), the USA 1.2% (1.4% and 1.0%), Japan of 1.3% (1.8% and 0.9%) and Canada 1.5% (1.5% and 1.5%). It is also below other advanced economies such as the Netherlands 0.9% (0.6% and 1.2%), Australia 1.6% (1.6% and 1.7%), Spain 1.7% (1.1% and 2.4%), and South Korea 2.1% (1.7% and 2.6%).

Average growth in emerging market and developing countries of 4.1% over the two years is much higher than the annualised average of 1.3% in advanced economies. India is expected to grow by 6.4% (6.1% in 2023 and 6.8% in 2024), Philippines 5.5% (5.0% and 6.0%), Indonesia 4.9% (4.8% and 5.1%), China 4.8% (5.2% and 4.5%), Malaysia 4.6% (4.4% and 4.9%), Egypt 4.6% (4.0% and 5.3%), Kazakhstan 4.3% (4.3% and 4.4%), Thailand 3.6% (3.7% and 3.6%), Pakistan 3.2% (2.0% and 4.4%), Nigeria 3.0% (3.2% and 2.9%), Türkiye 3.0% (3.0% and 3.0%), Saudi Arabia 3.0% (2.6% and 3.4%), Argentina 2.0% (2.0% and 2.0%), Iran 2.0% (2.0% and 2.0%), Mexico 1.6% (1.7% and 1.6%), Brazil 1.3% (1.2% and 1.5%), Poland 1.3% (0.3% and 2.4%), South Africa 1.2% (1.2% and 1.3%) and Russia 1.2% (0.3% and 2.1%).

Economic performance is not solely about these percentages, which while adjusting for inflation do not reflect the starting point nor changes in population. Advanced economies are much wealthier and smaller levels of growth represents much bigger increments than higher rates of growth in much poorer countries. Japan’s growth is despite a shrinking population, unlike the UK where the population is still expanding.

A devaluing currency can also mean that some countries can end up poorer at the end of the year despite positive headline growth rates. An example is Türkiye, where annualised average growth of 4.5% over the five years to 2022 was accompanied by a 98.9% fall in the value of the Turkish Lire against the Euro.

One crumb of comfort for the UK is that the IMF’s projections (not forecasts) are of course not what is going to happen. They are based on the IMF’s assessment of both official and unofficial forecasts and projections together with a range of assumptions from global energy prices to business investment, from fiscal policy to the behaviour of consumers, from the effects of climate change to the impact of wars. All of these could easily end up being very different, even if economic forecasting was an exact science, which it isn’t.

Policymakers in the UK will definitely be hoping that the British economy performs much better than these dismal projections suggest. After all, if you are at the bottom of a league, the only direction to aim for is up.

This chart was originally published by ICAEW.

ICAEW chart of the week: Australia federal deficit

Our chart heads down under this week to take a look at how the reported financial position of Australia’s federal government has changed over the last decade.

Australia Day on 26 January provides an opportunity to take a look at the federal balance sheet for Australia. This is included in the audited consolidated financial statements of the Commonwealth of Australia that are prepared in accordance with Australian Accounting Standards, which generally align with International Financial Reporting Standards (IFRS), although AASB 1049 Whole of Government and General Government Sector Financial Reporting diverges from IFRS in some aspects. They encompass the federal level of government in Australia, excluding states, territories and local authorities.

Our chart shows how the balance sheet has grown over the last 10 years, from net liabilities of A$256bn at 30 June 2012 (£147bn at the current exchange rate of A$1.77:£1.00) to A$607bn at 30 June 2022 (£348bn).

At 30 June 2012, the balance sheet comprised non-financial assets of A$123bn and financial assets of A$268bn, less interest-bearing liabilities of A$288bn, and provisions and payables of A$359bn to give a negative net worth of $256bn. These balances had grown to non-financial assets of A$266bn and financial assets of A$788bn at 30 June 2022, less interest bearing liabilities of A$1,109bn, and provisions and payables of A$552bn. 

Non-financial asset balances grew over the 10 years from 2012 to 2022 with land and buildings increasing from A$35bn to A$66bn, military equipment A$40bn to A$81bn, other plant, equipment and infrastructure $19bn to A$72bn, intangibles A$7bn to A$15bn, heritage and cultural assets A$10bn to A$13bn, and other from A$12bn to A$19bn.

Financial assets also grew, with investments and loan balances increasing from A$197bn to A$640bn, advances from A$27bn to A$70bn, receivables and accrued revenue from A$39bn to A$69bn, and cash from A$5bn to A$9bn. A substantial proportion of this growth relates to the Australia Future Fund, a sovereign wealth fund that was established in 2006 primarily to cover the costs of paying for unfunded pension obligations, together with a series of smaller funds intended to support infrastructure investment, disability insurance, medical research, indigenous communities and natural disasters.

Interest-bearing liabilities increased significantly as a consequence of the pandemic, with government securities increasing from A$268bn to A$577bn over the 10 years to June 2022, central bank and other deposits from A$3bn to A$426bn, and loans, leases and other interest bearing liabilities from A$17bn to A$106bn.

Provisions and payables grew by a lesser extent, with superannuation and other employee liabilities increasing from A$252bn to A$359bn, Australian currency on issue from A$54bn to A$102bn, payables from A$23bn to A$27bn, and provisions from A$30bn to A$64bn.

While negative net worth has increased from 17% of GDP to 24% of GDP over the 10 years, principally as a consequence of the pandemic in the last couple of years, the establishment of the Australia Future Fund, the move of federal employees from defined benefit to defined contribution pension arrangements, and active management of the balance sheet means that Australia is in a much healthier fiscal position than many other developed countries. 

For the Australian Department of the Treasury at least, this should make for a happy Australia Day.

This chart was originally published by ICAEW.

Public sector net debt tops £2.5trn for the first time

The highest December deficit on record has been driven by higher debt interest costs and the cost of energy support schemes.

The monthly public sector finances for December 2022, released on Tuesday 24 January 2023, reported a provisional deficit for the month of £27bn, the highest December deficit since records began in 1993. This was despite a mild December helping to mitigate some of the cost of energy support schemes.

The deficit for the month of £27bn was £12bn higher than the equivalent month in the previous financial year (December 2021) and £8bn more than the previous month (November 2022).

This brought the cumulative deficit for the first three quarters of the financial year to £128bn, which is £3bn below the Office for Budget Responsibility (OBR)’s revised forecast made at the time of the Autumn Statement last November. This substantially exceeds the budget of £99bn for the entire financial year to March 2023 forecast by the OBR at the time of the Spring Statement as higher interest costs, the effect of higher inflation on index-linked debt, and the cost of the energy price guarantee for households and businesses over the winter all add to public spending.

Public sector net debt was £2,504bn or 99.5% of GDP at the end of December 2022, up £131bn from £2,373bn at the end of March 2022. This is £684bn higher than net debt of £1,820bn on 31 March 2020, reflecting the huge sums borrowed since the start of the pandemic. 

The OBR’s latest forecast is for net debt to reach £2,571bn by March 2023 and to approach £3trn by March 2028, although energy prices falling faster than expected may help improve the outlook somewhat.

The cumulative deficit for the first three quarters of the financial year of £128bn was £5bn lower than this time last year and £143bn lower than in 2020/21 during the first stages of the pandemic. However, it was £67bn more than the deficit of £61bn reported for the first nine months of 2019/20, the most recent pre-pandemic pre-cost-of-living-crisis comparative period. 

Tax and other receipts in the three quarters to 31 December 2022 amounted to £721bn, £73bn or 11% higher than a year previously. Higher income tax and national insurance receipts were driven by rising wages and the higher rate of national insurance, while VAT receipts benefited from inflation in retail prices. Year-to-date receipts included £3.7bn accrued for the energy profits levy ‘windfall tax’.

Expenditure excluding interest and investment for the nine months of £716bn was £30bn or 4% higher than the same period in 2021/22, with Spending Review planned increases in spending, high inflation and the cost of energy support schemes more than offsetting the furlough programmes and other pandemic spending in the comparative period not repeated this year.

Interest charges of £100bn for the three quarters were £46bn or 85% higher than the £54bn reported for the equivalent period in 2021/22, through a combination of higher interest rates and higher inflation driving up the cost of RPI-linked debt. 

Cumulative net public sector investment to December was £33bn. This is £2bn more than a year previously, much less than might be expected given the Spending Review 2021 pencilled in significant increases in capital expenditure budgets in the current year.

The increase in net debt of £131bn since the start of the financial year comprised borrowing to fund the deficit for the nine months of £128bn together with a further £3bn to fund student loans, lending to businesses and others, and working capital requirements, net of cash inflows from repayments of deferred taxes and loans made to businesses during the pandemic.

Alison Ring OBE FCA, Public Sector and Taxation Director for ICAEW, said: “A mild December was not enough to prevent public debt from reaching £2.5tn for the first time, in a disappointing set of numbers for December 2022. However, the Chancellor will take comfort that cumulative borrowing for the first three quarters of the financial year was less than feared when the budget for 2022/23 was updated back in November. Energy prices coming down much faster than expected should also improve the outlook for the final quarter as well as the new financial year.

“The deficit is still on track to be one of the highest ever recorded in peacetime and stabilising the fiscal position is the best that Jeremy Hunt can hope for in the short term. Amid a sea of red ink, sustainable public finances remain a distant prospect for now.”

Table showing trends in receipts, expenditure, interest, net investment, deficit, other borrowing, debt movement, net debt and net debt / GDP for the nine months Apr-Dec 2019, 2020, 2021 and 2022.

Click on the link to ICAEW article at the end for a readable version of this table.

Caution is needed with respect to the numbers published by the ONS, which are expected to be repeatedly revised as estimates are refined and gaps in the underlying data are filled.

The ONS made several revisions to prior period fiscal numbers to reflect revisions to estimates. These had the effect of reducing the reported fiscal deficit for the eight months ended 30 November 2022 by £5bn to £101bn and reducing the reported fiscal deficit for the year to 31 March 2022 by £2bn to £123bn.

The revisions in the current year principally relate to an increase of £4bn in the estimate for accrued corporation tax receipts at 30 November 2022, while the prior year numbers were updated to reflect a £0.7bn correction to reported VAT cash receipts during 2021/22 and a £1bn increase in the estimate for accrued corporation tax receipts at 31 March 2022.

This article was originally published by ICAEW.

ICAEW chart of the week: China population

Our chart this week follows the news that China’s population has peaked at just over 1.4bn, illustrating the dramatic change that has taken place over the last 40 years.

Step chart showing the change between China's population in 1981 and 2021.

997m in 1981, comprising 765m age 0-39, 228m age 40-79 and 4m age 80+.

+776m births
- 332m deaths
- 15m net migration

= 1,426m in 2021 comprising 735m age 0-39, 658m age 40-79 and 33m age 80+.

The news that China’s population has peaked and is starting to fall prompted us to take a look at how the country with the largest population in the world has changed over the last 40 years.

In 1981, two years after the introduction of the one-child policy, China was a young country, with a population of 997m and a median age of 21. Today it is a mature country, with a population of 1,426m and a median age of 38, approaching that of many western countries.

Our chart shows how that population has changed according to the United Nations Population Division. In July 1981, China was estimated to amount to 997m, comprising 765m under the age 40, 228m between the ages of 40 and 79, and 4m aged 80 or over. Since then, there have been 776m births, 332m deaths and net outward migration of 15m to reach a total of 1,426m in July 2021. This comprised 735m people aged between 0 and 39, 658m between 40 and 79 and 33m aged 80 or over.

The dramatic change in the age profile reflects the huge success that China has had in tackling poverty and disease, enabling many more children to survive into adulthood compared with previous generations, and to then live longer lives. Infant mortality fell from 45 per thousand births in 1981 to less than six per thousand in 2021 and life expectancy at birth increased from 65 to 78.

The rapid growth in the population over the last 40 years has slowed in recent years as the number of births has fallen and (as the population has aged) deaths have increased. There were 10.9m births in 2021 (down from 12.2m in 2020, much less than the 22.8m births in 1981) and 10.6m deaths (up from 10.3m in 2020 and much higher than the 7.4m deaths recorded in 1981). With net outward migration of 0.2m, the net increase in the population in 2021 was less than 0.1m, down from the net increase of 1.9m in 2021 and much lower than the 17.1m increase experienced in 1982 and the peak increase of 19.9m in 1990.

According to the UN’s numbers, China’s population was expected to peak this year (in 2023), with a central projection that would see the population falling by 233m the next 40 years to 1,193m in 2061, and then to 767m in 2100.

However, China’s population is now believed to have peaked already, with the National Bureau of Statistics of China announcing on 17 January 2023 that China’s population excluding foreign citizens and excluding Hong Kong, Macau and Taiwan fell by 0.85m from 1,412.6m in December 2021 to 1,411.75m at the end of 2022.

India, with an estimated population of 1,407m in July 2021 according to the UN, was expected to overtake China as the world’s largest population during 2023, but there is some speculation following China’s announcement that this has already occurred. India’s population is currently projected to continue to grow over the next 40 years and peak at 1,697m in 2064.

With the population peaking and many more people living longer lives, the fiscal challenge facing China becomes similar to those facing western nations: how to support a rapidly increasing number of pensioners at the same time as the working age population is declining.

This chart was originally published by ICAEW.

ICAEW chart of the week: UK public finances 2022/23

Our chart this week compares the UK public finances for the current fiscal year with the overall size of the economy, illustrating how taxes are expected to amount to 36% of GDP and expenditure 47% of GDP.

Graphic using circles to illustrate the latest official forecast for UK public finances for 2022/23:

1. A circle for taxes of £910bn (36% of GDP), inside a circle of taxes and other income of £1,005bn (40% of GDP) which in turn is inside a circle of GDP of £2,497bn.

2. A circle for expenditure of £1,182bn (47% of GDP), inside a circle of GDP of £2,497bn.

3. An adjacent circle for the deficit of £177bn (7% of GDP).

The latest official forecast from the Office for Budget Responsibility (OBR) for the current fiscal year ending 31 March 2023 is for a shortfall (or ‘deficit’) of £177bn between receipts of £1,005bn and expenditure of £1,182bn. The largest component of receipts is taxation, which is forecast to amount to £910bn.

Our chart puts these numbers into context by comparing them with the forecast for Gross Domestic Product (GDP) of £2,497bn in 2022/23, highlighting how taxes are expected to amount to 36% of GDP, receipts including other income to 40% of GDP, and expenditure to 47% of GDP, resulting in a deficit amounting to 7% of GDP.

As many commentators have noted, taxes are at a historically high level, with taxation at its highest level as a share of economic activity since 1949. This is unsurprising given the combination of many more people living longer lives and the financial commitments made by successive governments to pay for pensions, health and (to an extent) social care.

Expenditure is also at historically high levels, with energy support packages adding to recurring expenditure of around 43% or 44% of GDP. This is below the peak of 53% of GDP a couple of years ago at the height of the pandemic.

As a consequence, the shortfall between receipts and expenditure of 7% of GDP is elevated compared with the 2% to 3% of GDP ‘normal’ range, although still below the 15% of GDP seen in 2020/21 during the pandemic and 10% of GDP in 2009/10 during the financial crisis.

The increase in the corporation tax rate to 25% from April means that receipts are expected to increase to 37% of GDP over the next few years, leading to the total of taxes and other receipts rising to 41%. At the same time total expenditure is expected to stay at 47% of GDP in 2023/24 before falling back to 45% in 2024/25, 44% in 2025/26 and 2026/27, and 43% in 2027/28. 

Unlike in previous generations, the government is restricted in its ability to cut other areas of spending to cover expected further rises in spending on pensions, health and social care as the number of pensioners continues to grow. Savings in the defence and security budgets are no longer possible now that spending has fallen to not much more than the NATO minimum of 2% of GDP, down from in excess of 10% back in the day, while pressures across many other areas of the public sector will make achieving the cost savings already assumed in the forecasts a significant challenge.

This chart was originally published by ICAEW.

Ideas on fiscal devolution clash as economic progress stalls

Gordon Brown’s constitutional commission calls for greater fiscal devolution, going much further than the government’s gradual rollout of levelling-up devolution deals.

There appears to be a growing belief among policymakers across the political spectrum that regional and local authorities need greater financial powers if economic outcomes are to be improved across the UK. However, while there appears to be some consensus around extending the fiscal powers of the devolved administrations in Wales, Scotland and Northern Ireland, there is much less agreement on how far to go in devolving financial powers for the 84% of the UK’s population that live in England.

Levelling-up ‘devolution deals’ cover almost half of England

The government has adopted a gradualist approach to fiscal devolution that has principally revolved around ‘devolution deals’, part of its wider Levelling Up agenda to spread prosperity across England outside London and the South East. These deals generally provide an agreed stream of investment funding over several decades, greater control over the adult education and transport budgets, and some additional powers (eg, over second homes in Cornwall), in exchange for agreeing to direct elections for combined authority mayors or county leaders.

Regional devolution deals were announced in 2022 for the North EastYork and North Yorkshire, and the East Midlands, together with county devolution deals for SuffolkNorfolk and Cornwall. The government is also working on ‘trailblazer’ devolution deals along similar lines with existing city-regions, starting with Greater Manchester and the West Midlands combined authorities.

The devolution deals do not provide any additional tax-raising powers for regional combined authorities or local authorities, and the majority of local government funding in England continues to be determined by central government. It is also unclear whether the government will attempt to extend the coverage of devolution deals across the rest of England beyond the existing areas covered and the Devon and East Yorkshire deals that are still being negotiated.

Gordon Brown constitutional commission

The Labour Party has also been thinking about devolution as part of a wider debate on the UK constitution, with a review led by former Prime Minister Gordon Brown into the UK’s constitution. While many of the headlines about the review focused on reform of the House of Lords, most of the report focused on devolution and intergovernmental cooperation, including the role played by English regions. This included recommending greater long-term financial certainty and new fiscal powers for local government in England, in addition to deepening the devolution settlements in Scotland, Wales and Northern Ireland.

Several of the Gordon Brown commission’s proposals align with recommendations made by ICAEW to HM Treasury at the time of the last Spending Review. ICAEW called for stable funding for local authorities, rationalisation of funding streams, investment in fiscal resilience and strengthening financial management.

At the same time as advocating for greater fiscal flexibility for local government, the review stresses the need for scrutiny and accountability to ensure money is spent wisely. One option might be for the proposed Office for Value for Money to expand to cover local government, further developing the ideas put forward in a Fabian Society report, Prizing the Public Pound, produced in collaboration with ICAEW. Other ideas include the piloting of local public accounts committees.

Although clear in the reforms to the UK’s constitutional arrangements that the review would like to see, the report lacks detail on how it intends to achieve its proposals – for example in identifying individual taxes that could be devolved to regional and local authorities. 

The report is ambitious in aiming to implement reforms within just one parliamentary term, meaning there will be a lot of work and consultation required to design the new arrangements, establish public support and then develop and pass the necessary legislation.

Fabian Society-ICAEW round table 

A joint Fabian Society-ICAEW round table last year explored some of the practical challenges involved in devolving fiscal powers to regional and local government in England. The group, which included members and contributors to the Gordon Brown commission, looked at the proposed trailblazer deals being negotiated by Greater Manchester and the West Midlands combined authorities, as well as existing ideas that have been put forward for devolved taxes, such as on tourism.

The participants discussed how existing disparities in tax bases between different parts of the country meant some form of redistribution or central government funding was still likely to be needed, as illustrated by the cities of Westminster and Hull that each serve populations of around 250,000 or so, but which have very different levels of prosperity and hence local tax capacity. 

The approach adopted in Germany of shared national taxes was also discussed, a key element in how regional governments (Länder) are funded. This is further explored in a separate Fabian Society report: Levelling Up? Lessons from Germany.

While there were a variety of views around the funding mechanisms that could be used to pay for local public services, there was general agreement on the need to rationalise funding streams, for long-term funding certainty to enable local authorities to plan ahead, and an end to the process of submitting multiple bids to central government for incremental funding.

Martin Wheatcroft FCA, external adviser on public finances to ICAEW, commented: “While there appears to be an emerging political consensus on the need to devolve much greater fiscal powers to regional and local tiers of government in England, the proposals so far have been relatively limited in their ambition.

“This may be because national politicians find it difficult to let go of the purse strings, but it is also the case that delivering fiscal devolution is not that easy in practice. Economic disparities between different places mean that needs are often greater in areas with less in the way of tax-generating ability, while redistributive mechanisms are challenging to design in a way that all parties deem to be fair. This is not helped by a patchwork quilt of differing regional and local government structures that would make it difficult to implement a single standardised model for funding local public services across England.”

This article was originally published by ICAEW.

ICAEW chart of the week: Peak inflation?

Inflation is believed to have peaked last quarter before being forecast to fall significantly over the course of 2023. We hope.

Line chart showing annual inflation rates on a quarterly basis:

2021
Q1 0.6%
Q2 2.1%
Q3 2.8%
Q4 4.9%

2022
Q1 6.2%
Q2 9.2%
Q3 10.0%

Line switches from actual to forecast

Q4 11.1%

2023
Q1 10.2%
Q2 8.9%
Q3 6.9%
Q4 3.8%

Our first chart of 2023 is on the prospects for consumer price inflation (CPI) over the course of the coming year, based on the latest forecasts for inflation from the Office for Budget Responsibility (OBR) that were released on 21 December 2022.

The OBR’s calculations suggest that CPI should come down significantly over the next four quarters to reach 3.8% by the end of the year, ‘only’ 0.8% above the Bank of England target range of 1% to 3%. The return of inflation to more moderate levels should help stabilise an economy that is currently in a pretty bad place, although it is important to understand that prices will still be rising, just at a slower pace than they have been over the course of the past year.

The chart illustrates how inflation started to rise in 2021, from a below-target 0.6% in Q1, to 2.1% in Q2, then 2.8% in Q3, before jumping to 4.9% at the end of 2021. The Russian invasion of Ukraine in the first quarter of 2022 and its consequences for global energy prices drove the inflation rate even higher, to 6.2% in Q1, 9.2% in Q2 and 10% in Q3, before rising to a forecast peak of 11.1% in Q4 of 2022. The OBR then goes on to forecast that the rate of price increases experienced by consumers will moderate in the coming year, down to 10.2% in Q1, 8.9% in Q2, 6.9% and then 3.8% in the fourth quarter of 2023.

Of course, economic forecasts of this nature are inherently uncertain, especially given the role that volatile energy prices play, both in their own right but also as a cost input to many other products and services. For consumers, the withdrawal of the Energy Price Guarantee will mean energy bills are likely to rise significantly in the second quarter despite falling wholesale prices.

The chart does not extend into 2024, when the forecasts are even more uncertain than for the current year. The OBR suggests that inflation could turn negative during 2024 (Q1: 2.5%; Q2: 0.4%; Q3: -0.2%; Q4: -0.1%) and 2025 (Q1: -0.1%; Q2: -0.6%; Q3: -1.1%; Q4: -1.3%), before heading back to target in 2026 (Q1: -1.0%; Q2: -0.4%; Q3: 0.9%; Q4: 1.2%). Deflation brings with it a whole different set of economic challenges to be faced but, fortunately, forecasts are less accurate the further into the future they go. The hope is that the Bank of England will be able to time its switch in monetary policy actions from countering inflation to countering deflation just right in order to avoid this potential outcome.

Either way, the prospect of inflation coming down over the coming year is a positive amid an otherwise very bleak economic picture for the UK as we begin 2023.

This chart was originally published by ICAEW.

ICAEW chart of the week: Christmas 2022

Our final chart of 2022 shows how spending on Christmas is expected to fall significantly this year as the cost-of-living crisis takes its toll on family finances.

Step chart showing change in average spending per person on Christmas over the last three years (skipping Christmas 2020).

Christmas 2019: £412

Inflation: +£23
Change: -£9

Christmas 2021: £426

Inflation: +£46
Change: -£79

Christmas 2022: £393

PwC’s annual pre-Christmas survey indicates that spending on Christmas was expected to be below pre-pandemic levels, with average spending of £412 in December 2019 (before the pandemic) increasing to £426 in December 2021, before falling to £393 this Christmas. 

The chart takes inflation into account to provide an illustration of what has happened to average spending in real terms. Excluding December 2020, when Christmas was cancelled for many of us, average spending would have been £23 higher if it had kept pace with inflation of 5.5% over the two years between 2019 and 2021, implying spending was expected to be £9 lower last Christmas than it had been before the pandemic.

The effect is even more marked this year, when keeping pace with consumer price inflation of 10.7% would lead to an extra £23 being spent compared with last Christmas. In this year’s survey, respondents expected to spend much less than in previous years, with an implied reduction of £79 or 17% after taking account of inflation.

We have used the overall CPI index as of November of each year presented in the chart, but in practice inflation runs at different rates for each element of spending. Food and non-alcoholic beverage inflation is currently running at over 16% meaning Christmas dinner is likely to cost even more this year, which for many is likely to offset any real terms ‘savings’ on alcohol where inflation is running at just over 4%.

According to PwC, 50% of spending on Christmas presents was expected to be completed around or before Black Friday in November, while 44% was planned for early to mid-December and 6% to be bought in the last week before Christmas or later. PwC also reports that the majority of Christmas present buying is now done online, with 55% ordered for delivery, 10% through click and collect, and just over a third to be purchased in-store.

Irrespective of how inflation is calculated, what is clear is that there is a substantial reduction in spending on Christmas festivities in 2022. This highlights how household finances are under significant pressure as we come to the end of the third year of the pandemic.

The ICAEW chart of the week is taking a break over the Christmas period and will return in 2023 with new charts on diverse subjects.

This chart was originally published by ICAEW.

ICAEW chart of the week: IMF Special Drawing Rights

My chart this week looks at the reserve currency assets that comprise the 660.7bn SDRs issued by the International Monetary Fund.

IMF Special Drawing Rights

Treemap chart showing the breakdown by currency of the 660.7bn SDRs in issue x $1.33 per SDR = $880bn.

USD: $383bn
EUR: €246bn = £261bn
CNY: ¥726bn = £105bn
JPY: ¥8,888bn = $66bn
GBP: £53bn = $66bn

Special Drawing Rights (SDRs) are reserve assets issued by the International Monetary Fund (IMF), the ‘international central bank’ for central banks. 

Just as national central banks create money by issuing currency in exchange for debt, the IMF creates its own form of ‘international money’ in the form of SDRs, balanced by long-term debt owed to the IMF by its member countries. 

To date, the IMF has issued 660.7bn SDRs, most recently in August 2021 when 456.5bn SDRs were issued to provide additional liquidity to member countries during the pandemic.

Countries are able to exchange the SDRs they are issued with for the underlying currencies that make up each SDR, providing them with international liquidity when they need dollars, euros, yuan renminbi, yen or pounds sterling or – in many cases – just dollars. According to the latest five-year currency weightings determined in July 2022, 1 SDR should be exchangeable for 0.57813 US dollars, 0.37379 euros, 1.0993 Chinese yuan, 13.452 Japanese yen and 0.08087 UK pounds. 

The chart illustrates what this means for the total of 660.7bn of SDRs in issue, which as of 5 Dec 2022 was calculated to be worth approximately $880bn in total based on a value of $1.33 per SDR. The total comprised $382bn in US dollars, €247bn in euros (worth $261bn at 5 Dec 2022), ¥726bn Chinese yuan ($105bn), ¥8,888bn Japanese yen ($66bn) and £53bn in UK pounds ($66bn).

In effect, 43.4% of the currency basket making up each SDR was US dollars, 29.7% was euros, 11.9% was Chinese yuan, 7.5% was Japanese yen and 7.5% was UK pounds.

Despite SDRs being an ‘international reserve asset’ that central banks and member countries can use to manage their own currencies, the IMF insists that SDRs are not a currency in their own right. Instead, it stresses that SDRs are merely an ‘accounting unit’ to be used for IMF transactions. However, despite these protestations, the IMF has concluded that SDRs are the functional currency for the purposes of its financial statements prepared in accordance with International Financial Reporting Standards.

The strength of the dollar means that SDRs at $1.33 each are worth $56bn less than the blended average rate of $1.42 each when they originally issued. This is because the non-dollar components of the currency basket, especially the euro and sterling, have fallen in value in relation to the US dollar in recent years.

At less than a trillion dollars, SDRs may seem quite small in comparison with the vast flows of money around the world. However, their importance to the international monetary system cannot be understated, keeping the financial wheels turning and providing central banks (especially those in smaller nations) with essential liquidity when they need it most.

This chart was originally published by ICAEW.

ICAEW chart of the week: Language proficiency in England and Wales

This week I take a look at the data on languages contained within the latest release of information from Census 2021 for England and Wales.

Chart with dotted grid (100 x 100) with 10 dots to 0.1%.

English or Welsh as main language 91.1%
Speaks English very well 3.9%
Speaks English well 3.2%
Speaks English not well 1.5%
Does not speak English 0.3%

The Office for National Statistics (ONS) on 29 November released its latest batch of analysis from the 2021 Census, this time on ethnicity, national identity, language and religion.

Our chart this week delves into this by looking at language proficiency, illustrating how 91.1% (52.6m) of the population in England and Wales speaks English (or Welsh in Wales) as their main language.

A further 7.1% (4.1m) are classified as proficient in English, broken down into 3.9% (2.3m) who speak English very well and 3.2% (1.8m) who speak English well. The remaining 1.8% (1.1m) of the population can be broken down between 1.5% (0.9m) who speak some English and 0.3% (0.2m) who speak no English at all.

The top 10 languages spoken by those for whom English or Welsh was not their main language comprised Polish (612,000 or 1.1%), Romanian (472,000 or 0.8%), Panjabi (291,000 or 0.5%), Urdu (270,000 or 0.5%), Portuguese (225,000 or 0.4%), Spanish (215,000 or 0.4%), Arabic (204,000 or 0.3%), Bengali (199,000 or 0.3%), Gujarati (189,000 or 0.3%) and Italian (160,000 or 0.3%).

Surprisingly, the release does not include data on the proportion of Welsh language speakers in Wales, with a more detailed analysis scheduled to be published by the Welsh Government on 6 December.

The proportion of people who speak English (or Welsh in Wales) as their main language has dropped from 92.3% in the last census in 2011 to 91.1% in 2021, while the proportion of those with another main language who are proficient in English increased from 6.1% in 2011 to 7.1% in 2021. The proportion who do not speak English or who do not speak English at all increased from 1.6% in 2011 to 1.8% in 2021.

While the numbers not able to speak English proficiently remain relatively small as a proportion of the overall population, this still represents more than a million people who are unable to function effectively. Many will be newer arrivals in the process of learning English, but some will be longer-term residents who would benefit from better English language skills.

One question for both local authorities and central government is how much to invest in English language teaching. Finding the money is likely to be difficult at a time of constrained public expenditure budgets, but there may be savings elsewhere such as the cost of interpreters.

This chart was originally published by ICAEW.