ICAEW chart of the week: Global GDP

My chart for ICAEW this week looks at the relationship between population and GDP around the world.
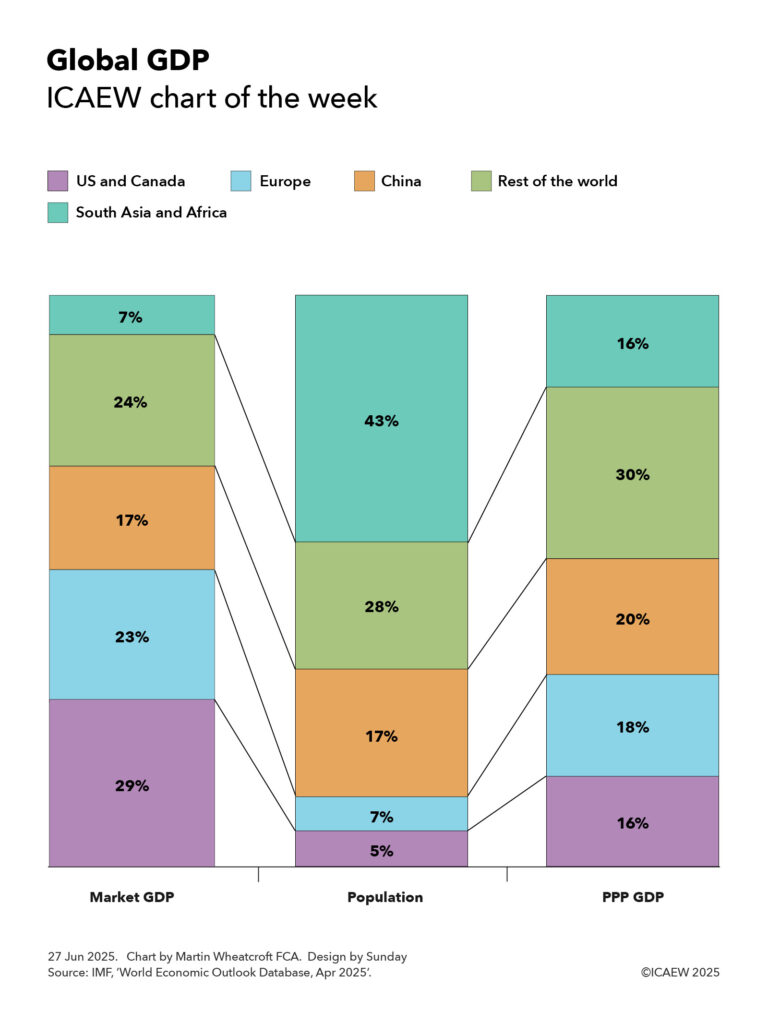
A three column chart each adding up to 100% with the central bar showing percentages of the global population, the left-hand bar showing percentages of market GDP. and the right-hand bar showing percentage of power-purchasing-parity (PPP) GDP. The bars are linked with lines to emphasise the relative proportions. 

US & Canada: Market GDP 29% - Population 5% - PPP GDP 16%. 
Europe: Market GDP 23% - Population 7% - PPP GDP 18%. 
China: Market GDP 17% - Population 17% - PPP GDP 20%.  
Rest of the world: Market GDP 24% - Population 28% - PPP GDP 30%. 
South Asia & China: Market GDP 7% - Population 43% - PPP GDP 16%. 

27 Jun 2025. Chart by Martin Wheatcroft. Design by Sunday. Source: IMF, 'World Economic Outlook Database, Apr 2025'.

According to the latest World Economic Outlook Database published by the International Monetary Fund in April 2025, the 387m people that live in the US and Canada, some 5% of the global population of 8.1bn, are together expected to generate about 29% of global economic activity as measured by GDP converted at market exchange rates in 2025. 

The US – the largest economy in the world – is expected to generate 27% with 4.3% of the global population, while Canada with 0.5% of the world’s people represents 2% of the global economy.

My chart this week also shows how the US and Canada together constitute 16% of the global economy using GDP converted on a Purchasing-Power-Parity (PPP) basis that adjusts for the relative cost of living between countries. The US is the world’s second largest economy on this basis with 15% of total economic output, while Canada represents 1.3% of the total.

Europe’s 602m people are 7% of the global population (excluding Russia, but including Georgia) and are expected to generate around 23% of global economic output at market exchange rates in 2025 or around 18% on a PPP basis. 

This includes the 452m people or 5.6% of the total living in the EU that generate 18% of global output or 14% on a PPP basis, the second largest economy on a market exchange rate basis and the third largest after adjusting for purchasing power. Germany with 1% population generates 4.3% and 3% of market GDP and PPP GDP respectively, followed by France (0.8% generating 2.9% and 2.2%), Italy (0.7% generating 2.2% and 1.8%), Spain (0.6% generating 1.6% and 1.4%), the Netherlands (0.2% generating 1.2% and 0.7%) and Poland (0.5% generating 0.9% and 1%). 

Outside the EU, the 70m people in the UK, 0.9% of the world’s total, generate 3.4% of global economic activity on a market exchange rate basis and 2.2% on a purchasing power basis.

China’s 1.4bn people constitute 17% of the world’s population and generate 17% of market GDP, in effect the average level of global economic activity on a per capita basis at current exchange rates. However, on a cost-of-living adjusted basis, they are the world’s biggest economy at 20% of PPP GDP and above average on a per capita basis.

The chart groups the rest of East Asia, South East Asia, Oceania, the Middle East, Russia, Central Asia, Latin America and the Caribbean into a ‘rest of the world’ category with 2.3bn people or 28% of the world’s population. They generate 24% of the global economy on a market exchange rate basis and 30% on a purchasing power basis.

This category includes the 10 ASEAN countries in South East Asia that together make up 8.5% of the world’s population, 3.6% of market GDP and 6.4% of PPP GDP led by Indonesia (3.5%, 1.2% and 1.4%). Others include Japan (1.5% population, 3.6% market GDP and 3.3% PPP GDP), Russia (1.5%, 2.3% and 3.5%), Türkiye (1.3%, 1.1% and 1.8%), Mexico (1.6%, 1.6% and 1.6%), South Korea (0.6%, 1.6% and 1.6%), Australia (0.3%, 1.5% and 1%), Brazil (2.6%, 1.0% and 2.4%), Taiwan POC (0.3%, 1% and 0.8%) and Saudi Arabia (0.4%, 0.8% and 1%).

The final category is South Asia and Africa, which together include many of the poorest countries on Earth, with 43% of the global population but just 7% of the global economy based on market exchange rates and 16% on a cost-of-living adjusted basis.

South Asia’s 2bn people are 24.3% of the world’s population, generating 4.4% of market GDP and 10.3% of PPP GDP. This includes India’s 1.5bn people (17.9% of the global population generating 3.6% and 8.5% respectively), the world’s fifth largest national economy at market exchange rates behind the US, China, Germany and Japan, and the third largest on a PPP basis behind China and the US. It also includes Pakistan (3% of the world’s people generating 0.3% and 0.8% of economic activity) and Bangladesh (2.1% generating 0.4% and 0.9%).

Africa’s 1.5bn people constitute 18.3% of the world’s total, generating just 2.7% of market GDP and only 5.3% of PPP GDP. This includes South Africa (0.8%, 0.4% and 0.5%), Egypt (1.3%, 0.3% and 1.1%), Nigeria (2.9%, 0.2% and 0.8%), Ethiopia (1.4%, 0.1% and 0.2%) and the Democratic Republic of the Congo (1.3%, 0.1% and 0.1%).

The chart illustrates how economic activity, both before and after adjusting for purchasing power, is weighted towards the US and Europe, while South Asia and Africa have a long way to go to become as prosperous.

While this may seem a stiff mountain to climb economically, China’s transformation over the last 30 years provides an example of what is possible, especially as ageing populations in many developed countries reduce their ability to grow as quickly as those countries with much younger demographics such as in South Asia and Africa.

As they say, watch this space.

This chart was originally published by ICAEW.

ICAEW chart of the week: Gold

With President Trump planning to visit Fort Knox to check up on the US government’s gold reserves, my chart for ICAEW this week looks at just how much gold is owned by governments around the world.

According to the latest statistics from the World Gold Council, sourced principally from the International Monetary Fund (IMF), governments and international financial institutions around the world own 35,864 tonnes of gold. Much of this gold sits in the Bank of England, Fort Knox and in central bank vaults around the world.

At a price of around £74 per gram, the total value of ‘government gold’ adds up to somewhere in the region of £2.7trn. This is estimated to be around one-sixth of the total above-ground stock of gold in the world.

While the US is the largest individual holder of official gold reserves with 8,133 tonnes of gold worth around £600bn, the 27 countries of the EU and the European Central Bank collectively own a total of 11,719 tonnes of gold worth approximately £870bn. This includes Germany with 3,352 tonnes, Italy 2,452 tonnes, France 2,437 tonnes, Netherlands 615 tonnes, the European Central Bank 507 tonnes, Poland 448 tonnes, Portugal 383 tonnes, Spain 282 tonnes, Austria 280 tonnes, Belgium 227 tonnes, Sweden 126 tonnes, Greece 115 tonnes, Hungary 110 tonnes, Romania 104 tonnes and other EU member states with 281 tonnes.

The next biggest holder of gold is the IMF with 2,814 tonnes (worth around £210bn), followed by Russia with 2,336 tonnes (£175bn), China 2,280 tonnes (£170bn), Switzerland 1,040 tonnes (£77bn), India 876 tonnes (£65bn), Japan 846 tonnes (£63bn), Türkiye 615 tonnes (£46bn), Taiwan 424 tonnes (£31bn), Uzbekistan 383 tonnes (£28bn), Saudi Arabia 323 tonnes (£24bn), the UK 310 tonnes (£23bn), Lebanon 287 tonnes (£21bn) and Kazakhstan 284 tonnes (£21bn).

The total for other countries adds up to 3,194 tonnes worth, or around £235bn or so, including Thailand 235 tonnes, Singapore 220 tonnes, Algeria 174 tonnes, Iraq 163 tonnes, Venezuela 161 tonnes, Libya 147 tonnes, Brazil 130 tonnes, Philippines 130 tonnes, Egypt 127 tonnes, South Africa 125 tonnes, Mexico 120 tonnes, Qatar 111 tonnes, South Korea 104 tonnes and the Bank for International Settlements 102 tonnes. 

While the level of official gold holdings is partly driven by the economic size of the countries concerned, it also depends on their reserve strategies, with US, German, French and Italian gold holdings making up around 75%, 74%, 72% and 71% of their official reserves respectively, in contrast with 6%, 9%, 11% and 15% for China, Switzerland, India and the UK, for example. 

President Trump’s plan to visit Fort Knox to personally inspect his nation’s gold holdings reflects one of the benefits of investing in a physical commodity such as gold – you can count gold bars, weigh them and check their purity, as well as admire its shiny quality. He may have a less satisfying experience in verifying any future strategic crypto-currency reserve, where entries in a ledger are somewhat more ephemeral.

This chart was originally published by ICAEW.


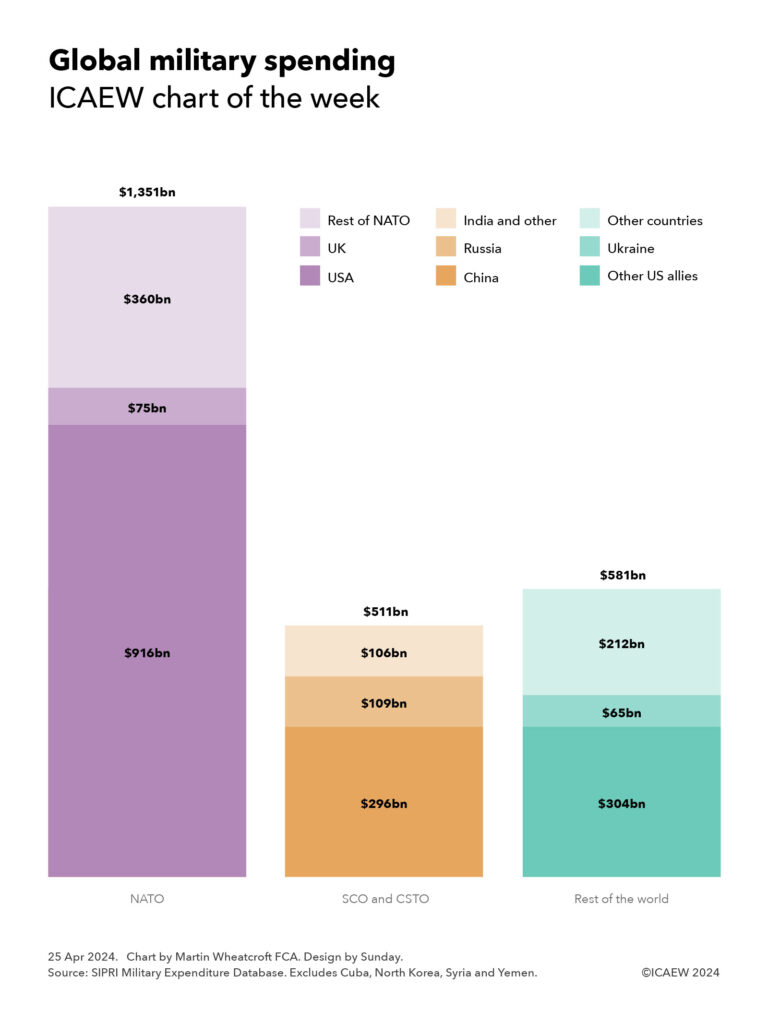
ICAEW chart of the week: Global military spending

While the UK commits to increasing its defence and security expenditure, our chart this week looks at military spending around the world, which has reached $2.4trn.

Column chart

Global military spending
ICAEW chart of the week

Column 1: NATO

USA $916bn
UK $75bn
Rest of NATO $360bn
Total $1,351bn

Column 2: SCO and CSTO

China $296bn
Russia $109bn
India and other $106bn
Total $511bn

Column 3: Rest of the world

Other US allies $304bn
Ukraine $65bn
Other countries $212bn
Total $581bn


25 April 2024.
Chart by Martin Wheatcroft FCA. Design by Sunday.

Source: SIPRI Military Expenditure Database. Excludes Cuba, North Korea, Syria and Yemen.

© ICAEW 2024

Our chart this week is based on the latter, with SIPRI reporting that global military expenditure has increased to $2,443bn in 2023, a 6.8% increase after adjusting for currency movements. SIPRI’s numbers are based on publicly available information, which means that some countries may be spending even more on their militaries that are included in the database. SIPRI was unable to obtain numbers for military spending by Cuba, North Korea, Syria, Yemen, Turkmenistan, Uzbekistan, Somalia, Eritrea, Djibouti, and Laos.

Military spending is the news this week following the announcement by the UK government that it will commit to spending 2.5% of GDP on defence and security, the recent vote by the US Congress to provide $95bn in military aid to Ukraine ($61bn), Israel ($26bn) and Taiwan and others in the Indo-Pacific ($8bn), and the release of the Stockholm International Peace Research Institute (SIPRI) Military Expenditure Database for 2023.

More than half of that spending is incurred by NATO, with total military spending of $1,351bn, comprising $916bn by the US, $75bn by the UK and $360bn by other NATO members. Of the latter, $307bn was spent by the 23 members of the EU that are also members of NATO (including $67bn by Germany, $61bn by France, $36bn by Italy, $32bn by Poland and $24bn by Spain), while $53bn was spent by the other seven members (including $27bn by Canada and $16bn by Türkiye).

The Shanghai Cooperation Organisation (SCO) and the Collective Security Treaty Organisation (CSTO) are partially overlapping economic and military alliances convened by China and Russia respectively. China has the biggest military with $296bn spent in 2023, while Russia spent $109bn and other members spent $106bn (of which India spent $84bn).

We have categorised the rest of the world between other US allies which spent $304bn in 2023 (including $76bn by Saudi Arabia, $50bn by non-US members of the Rio Pact, $50bn by Japan, $48bn by South Korea, $32bn by Australia, $27bn by Israel and $17bn by Taiwan), Ukraine which spent $65bn, and $212bn spent by other countries for which SIPRI has data.

The numbers do not take account of the differences in purchasing power, particularly on salaries. That means China and India, for example, can employ many more soldiers, sailors and aircrew than NATO countries can for the same amount of money.

The Ukraine number also excludes $35bn in military spending funded by the US ($25bn) and other partners ($10bn) during 2023 that was not part of its national budget.

Global military spending is expected to increase further in 2024 as the international security situation deteriorates. This includes NATO members that plan to increase their defence and security spending to meet or exceed the 2% of GDP NATO minimum guideline set in 2014 to be achieved by 2024.

This includes the UK, which now plans to increase its spending on defence and security from 2.35% of GDP in 2023/24 to 2.5% of GDP by 2028/29, with suggestions from defence sources that setting a target of 3% of GDP may be necessary at some point in the next decade.

This chart was originally published by ICAEW.