My chart for ICAEW this week looks at how climate change is now expected to make the OBR’s dire predictions for the public finances even worse.
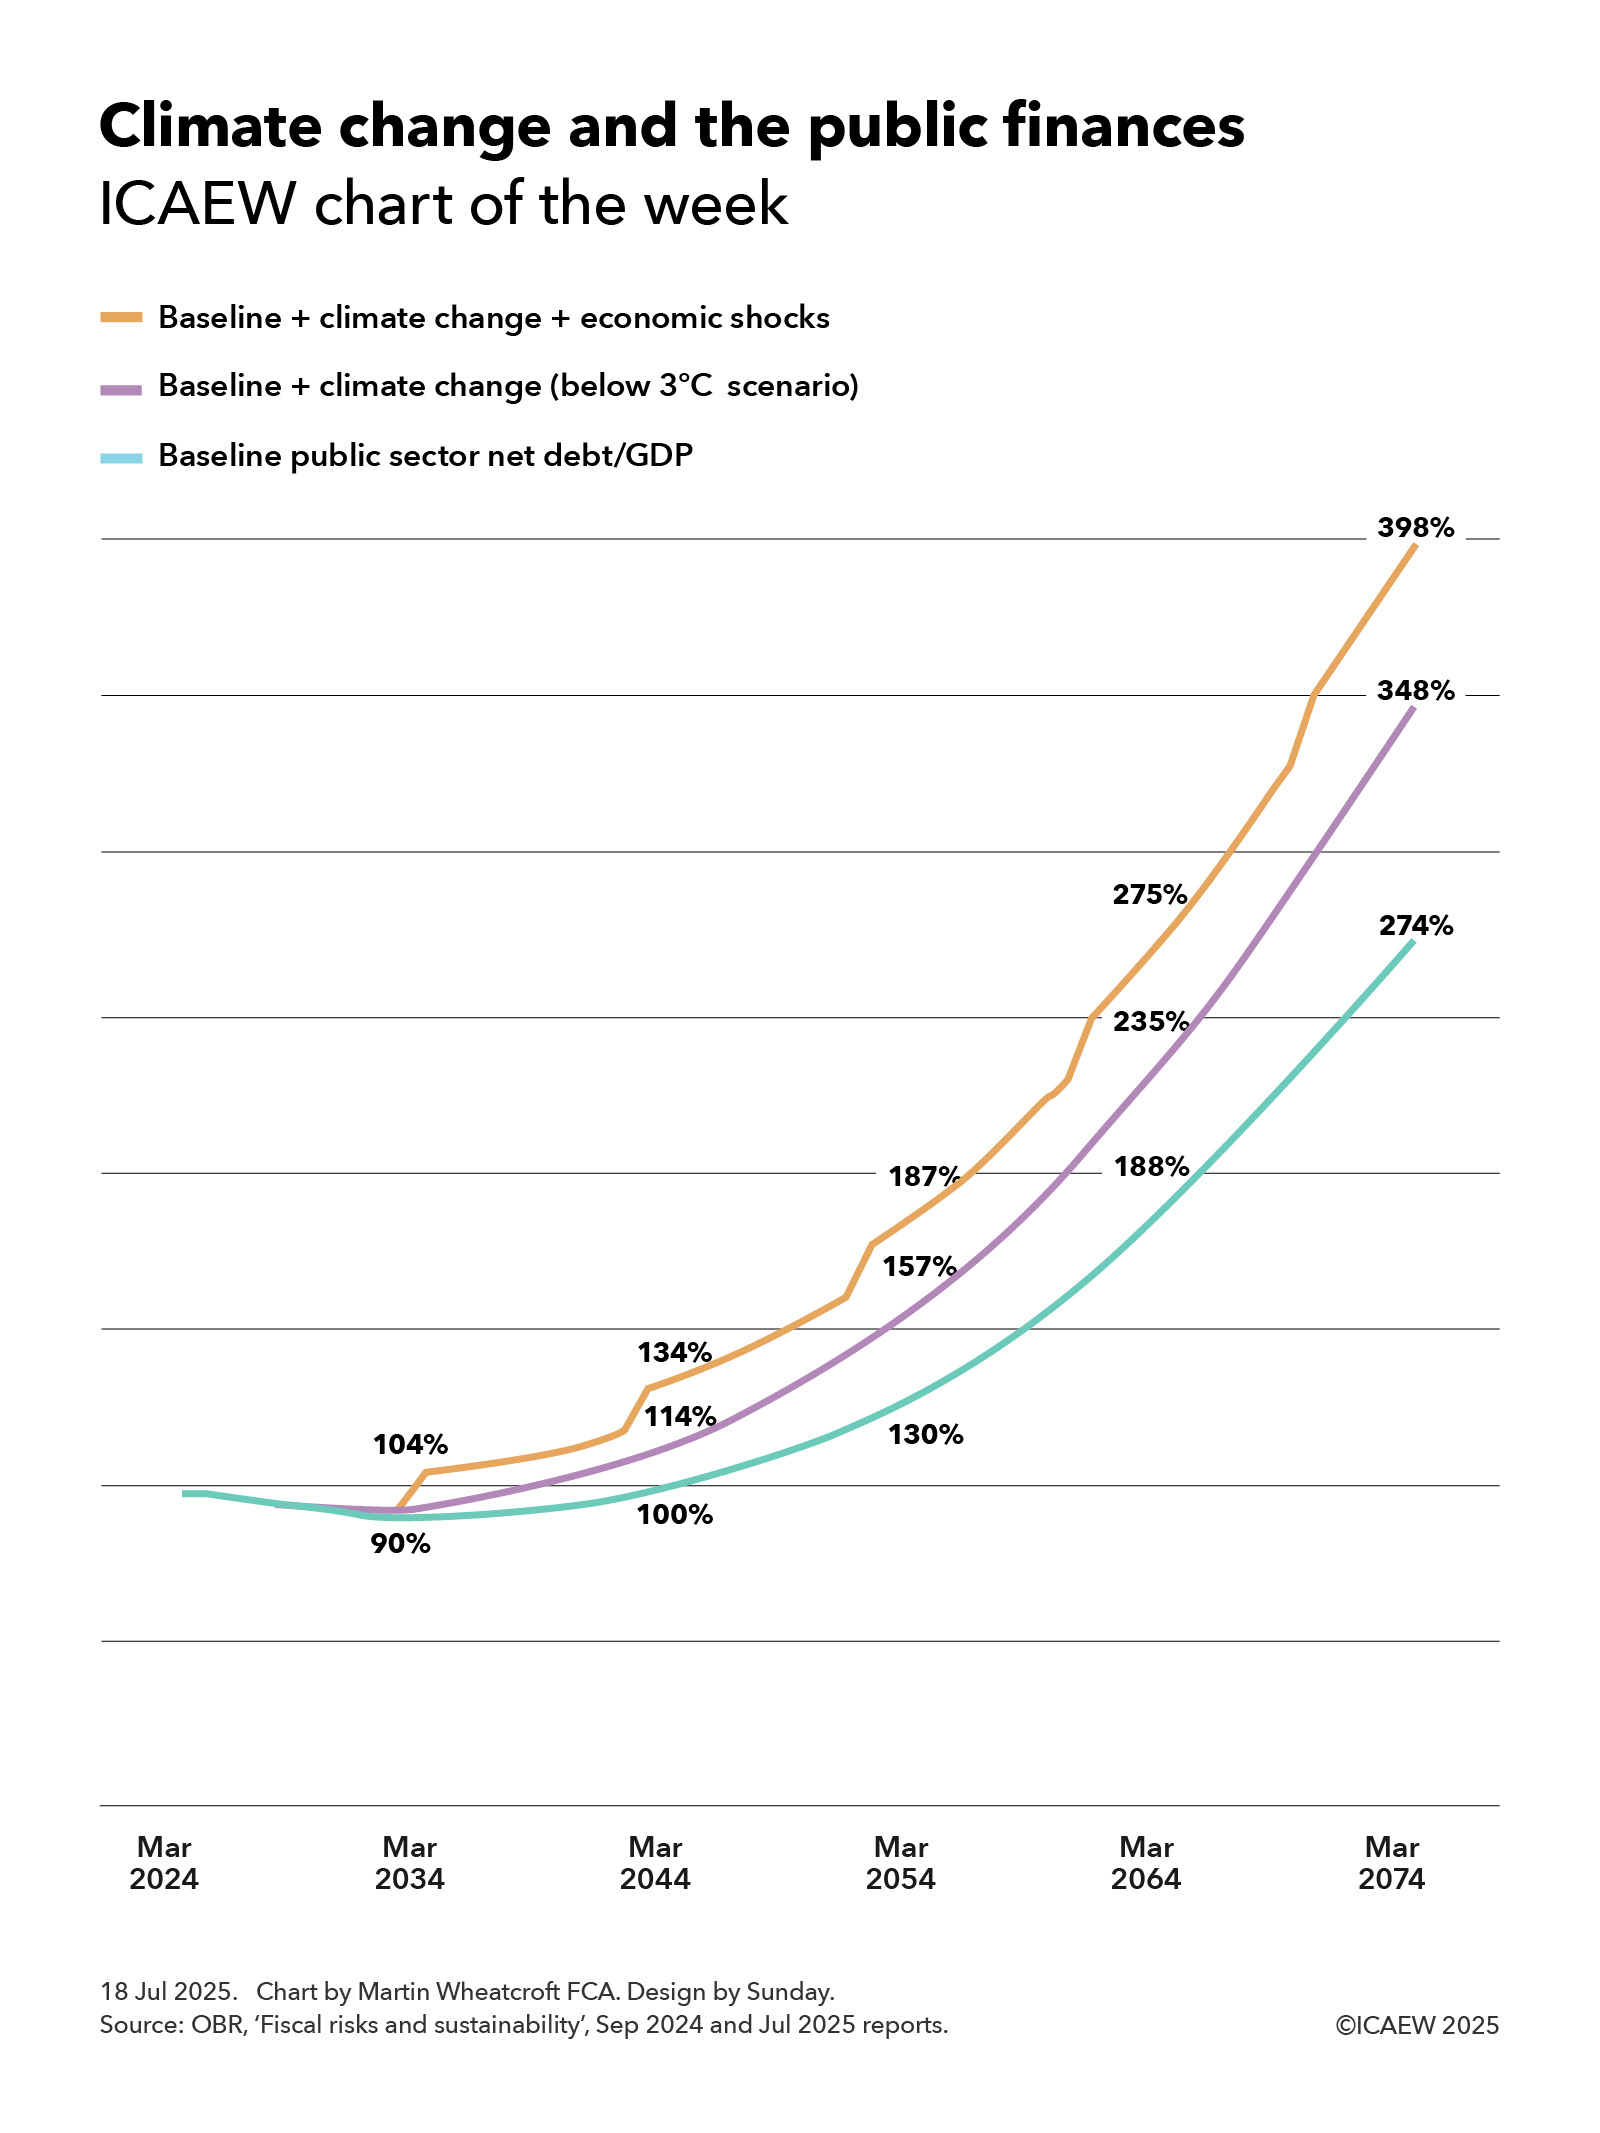
ICAEW’s chart of the week is on climate change this week, illustrating how it could add a further 74 percentage points to the Office for Budget Responsibility (OBR)’s already disheartening baseline projection for public sector net debt of 274% of GDP to reach 348% of GDP, or potentially 398% if economic shocks are included.
The baseline projection, published by the OBR in September 2024, showed public sector net debt as a proportion of the size of the economy falling from just under 100% of GDP to 90% of GDP in March 2034 and then rising to 100%, 130%, 188% and 274% of GDP in March 2044, 2054, 2064 and 2074 respectively.
One of the main drivers of the baseline projection is the expected rise in spending on pensions, health and social care as more people live longer, sometimes less healthy lives, combined with a falling fertility rate that means there will be proportionately fewer working age adults to pay the taxes needed to fund that rise.
Incorporating the OBR’s new central projection for climate change, public sector net debt would be 94% of GDP in March 2034 (not shown in the chart because of a lack of space between lines) and then 114%, 157%, 235% and 348% of GDP in March 2044, 2054, 2064 and 2074 respectively. Adding potential economic shocks on top would increase the projection for public sector net debt/GDP to 104% in March 2034 rising to 134%, 187%, 275% and then 398% in March 2074.
The September 2024 baseline projection included the loss of fuel duty receipts from the phasing out of petrol and diesel vehicles between now and 2050, but the OBR in its recent July 2025 fiscal and sustainability report has looked in more detail at both the incremental costs of transitioning to net zero and the damage that is likely to result from a much warmer and wetter climate in several different scenarios.
OBR’s central ‘below 3°C’ scenario is based on global average temperatures rising by 2.9°C above pre-industrial levels by 2100, of which weather and other damage associated with a much warmer and wetter climate is projected to add 17 percentage points to accumulated debt over the next half century from direct and indirect costs and revenue losses. Climate damage is also expected to result in slower economic growth that would add 27 percentage points over 50 years by reducing the denominator in the debt to GDP ratio. The government’s share of transition costs (including lower tax receipts from higher private sector spending) is projected to add 7 percentage points, while there is a 22 percentage point impact from the incremental debt interest that would be incurred on a higher level of debt.
This is before taking account of recessions and other potential economic shocks, which based on historical patterns are expected to add 10% of GDP to public sector net debt every decade or so.
The chart does not reflect other risks identified by the OBR in its latest report, where it reports that the exposures to the public finances have increased since its assessment last year. One risk they did look at in some detail is the prospect of higher interest rates on government borrowing on the basis that demand for gilts reduces as the Bank of England winds down its holdings of gilts (quantitative tightening) and defined benefit pension schemes gradually sell their holdings of gilts to fund pension payments. This risk might be mitigated by selling shorter-dated gilts, although shorter maturities would make the public finances less resilient by increasing the amount of debt needing to be refinanced each year.
The OBR’s dismal assessment of the prospects for the public finances highlights just how difficult a financial position the UK finds itself in, with a lot to do (and some luck needed) if it is to be restored to a sustainable path. At the same time, the costs of climate change are now becoming that much more apparent as extreme weather events and other climate-related costs start to show up in public finance and insurance data.
For more information about the role of the accountancy profession in climate change, visit ICAEW’s climate hub.