Chancellor spends forecast upside to leave public finances largely unchanged

Jeremy Hunt limits his tax and spending ambitions in the Spring Budget to stay within a very tight fiscal rule.

The Spring Budget 2023 for the government’s financial year of 1 April 2023 to 31 March 2024 was presented by the Chancellor of the Exchequer to Parliament on Wednesday 15 March 2023, accompanied by medium-term economic and fiscal forecasts from the Office for Budget Responsibility (OBR) covering the period up to 2027/28.

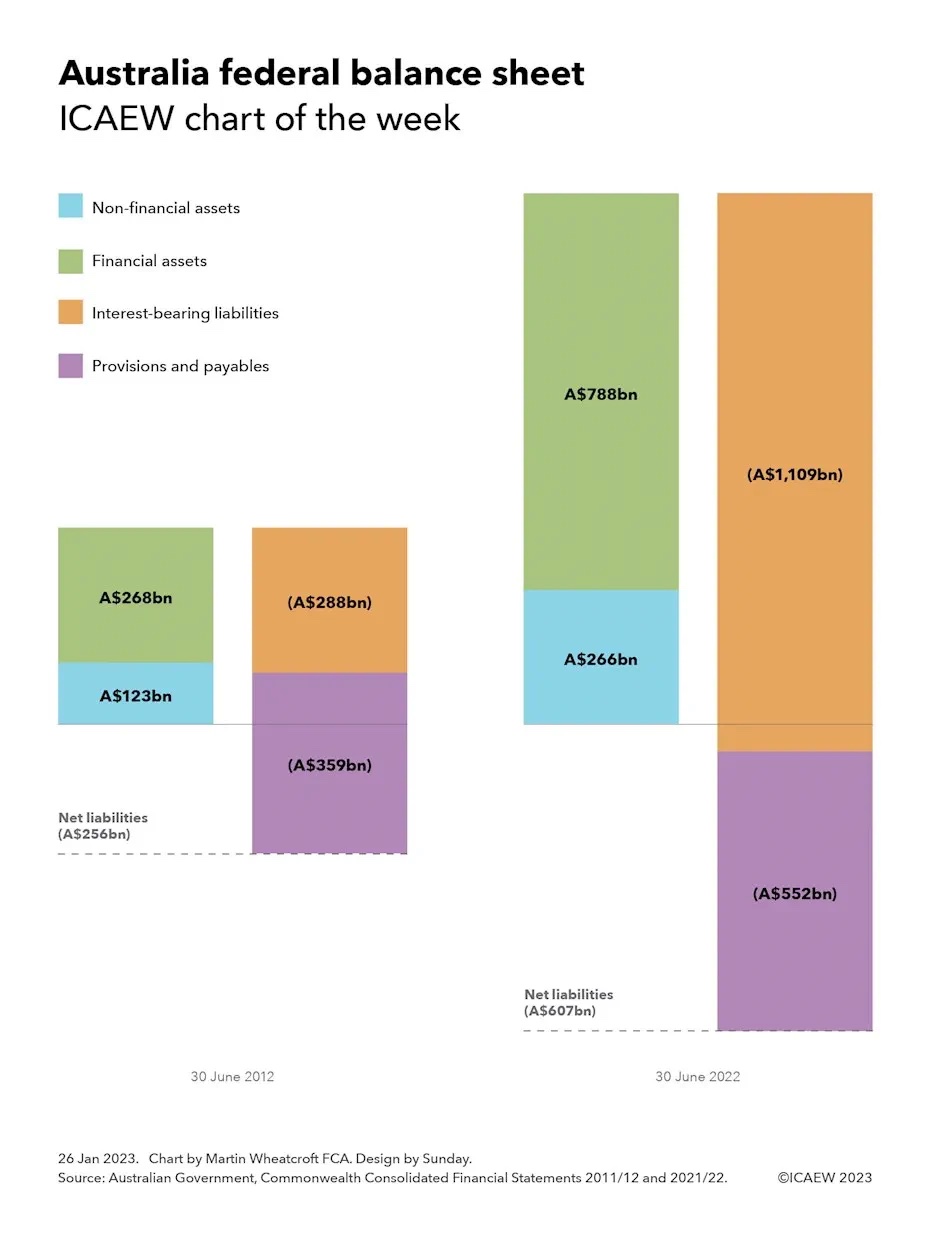
The fiscal numbers in the Budget are based on the National Accounts prepared in accordance with statistical standards. They differ in material respects from the financial performance and position that will eventually be reported in the Whole of Government Accounts prepared in accordance with International Financial Reporting Standards (IFRS).

A (slightly) lower fiscal deficit in 2023/24

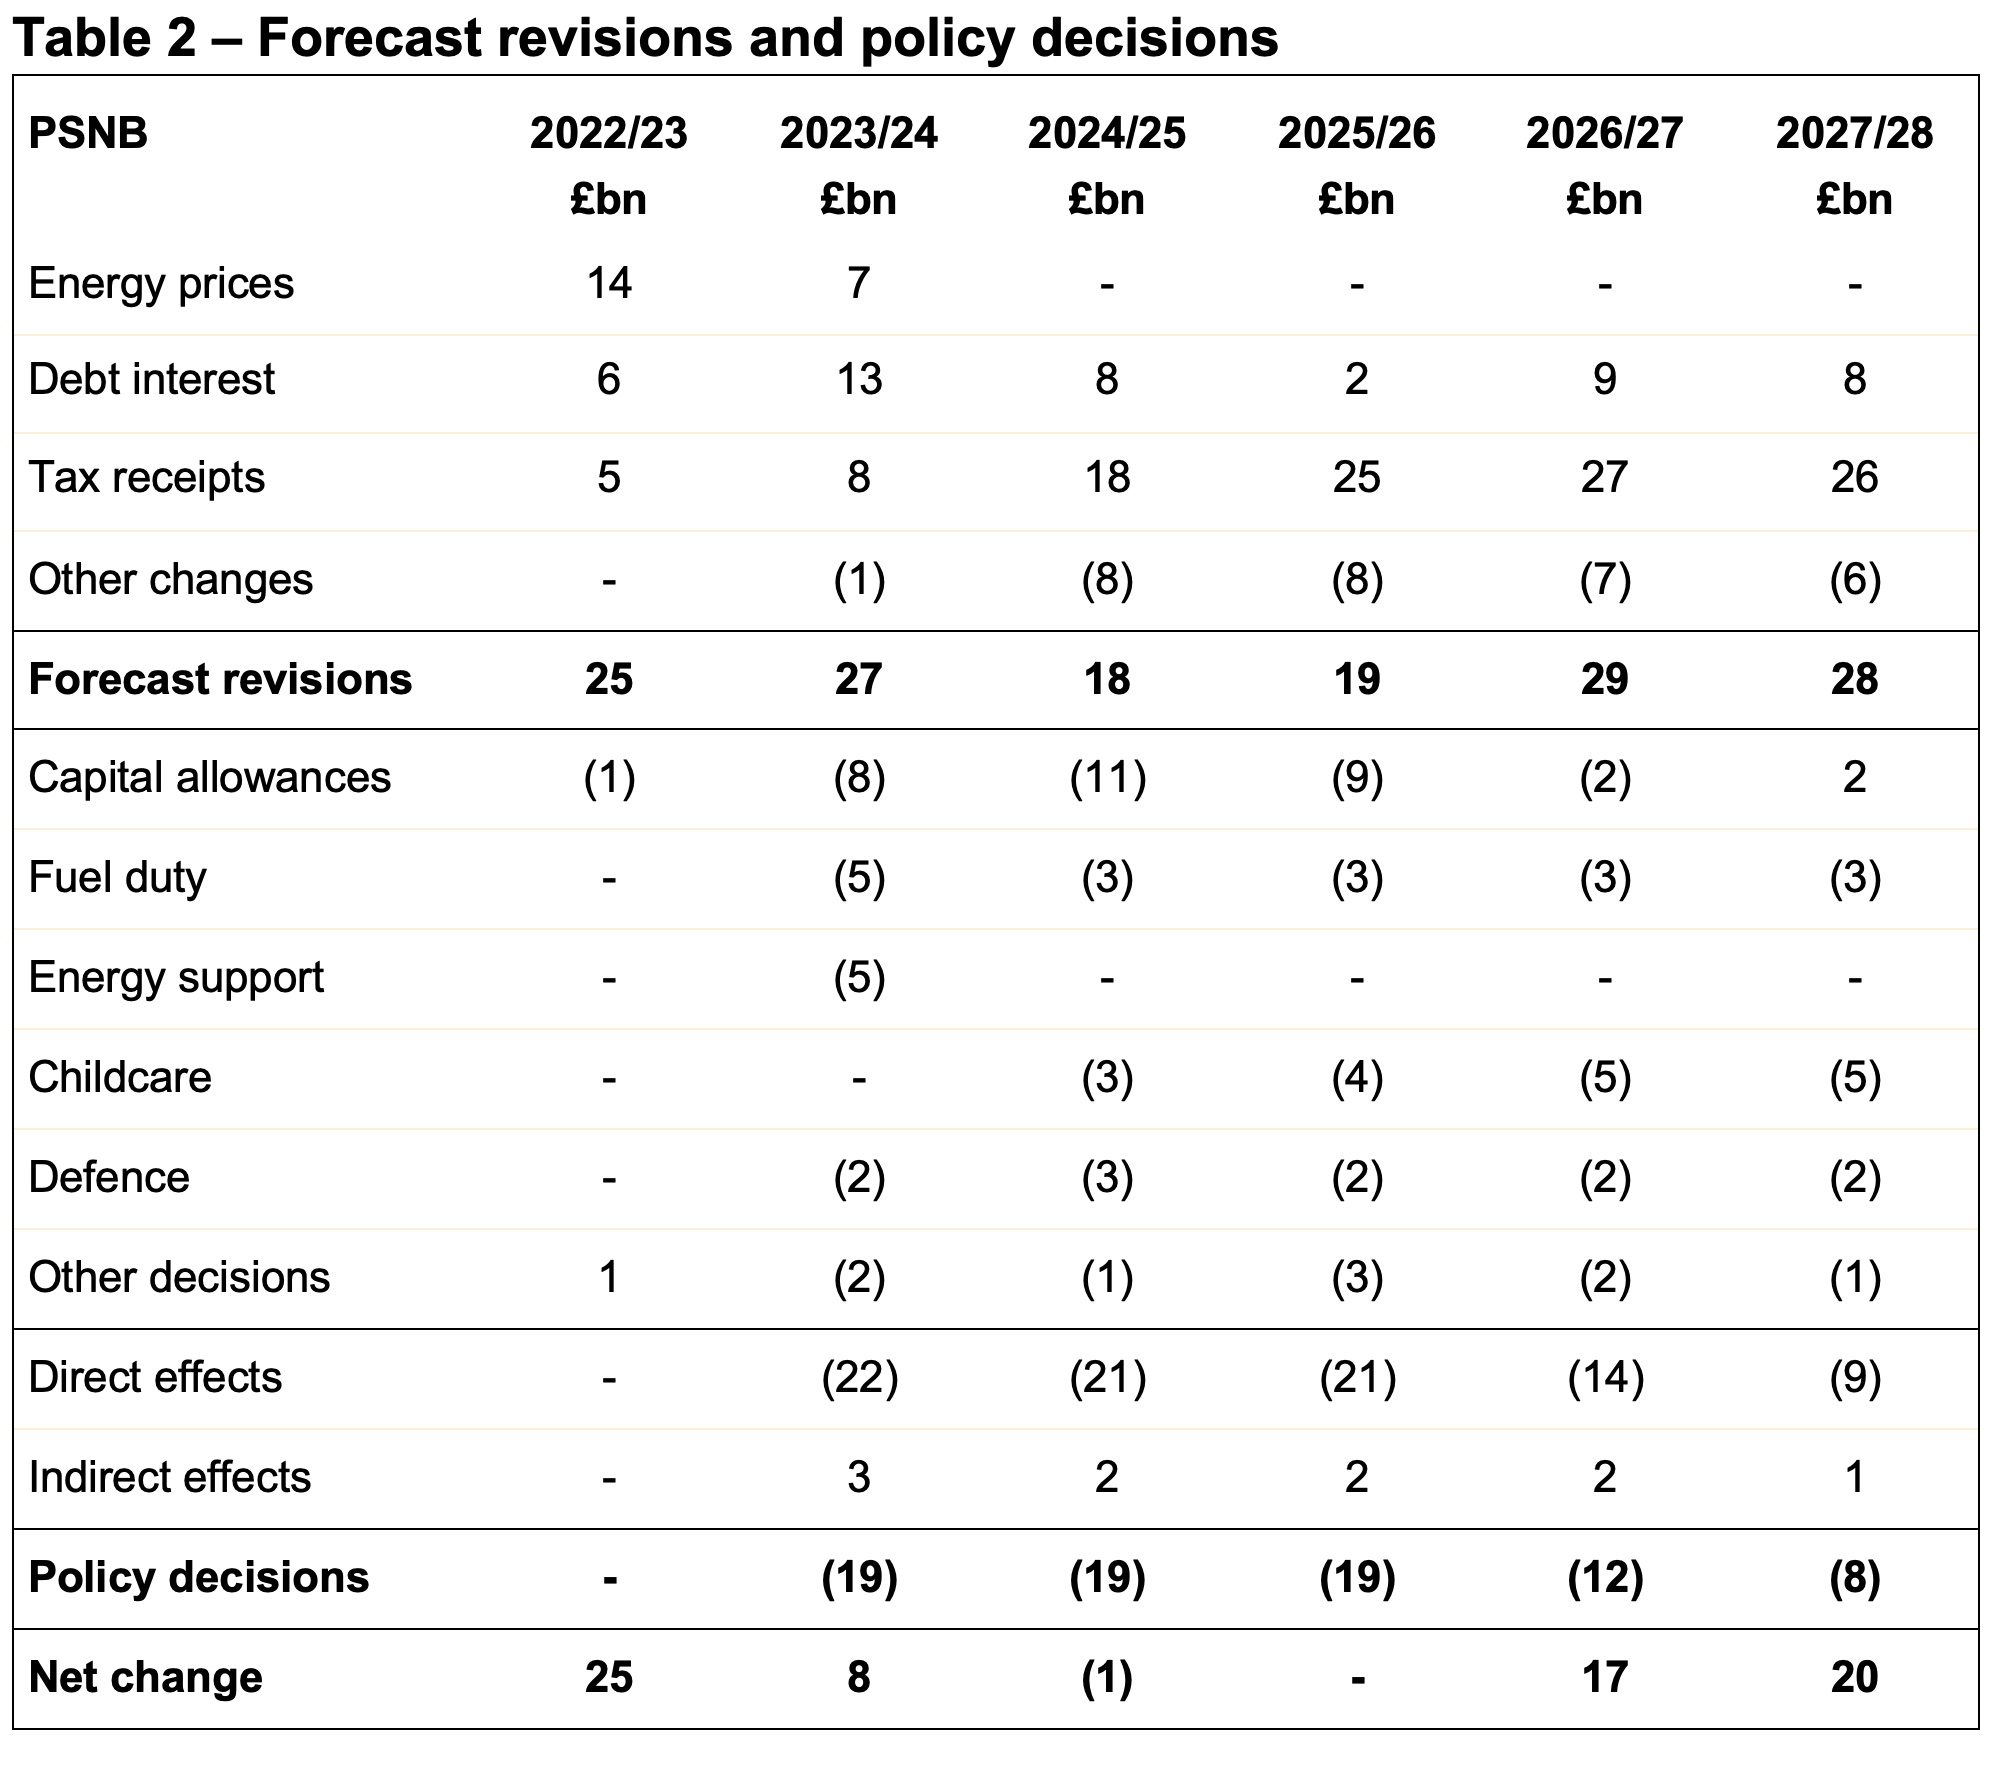
Table 1 shows the Spring Budget estimate for the deficit in 2023/24 is £132bn, £8bn lower than the £140bn forecast in November 2022. Positive revisions to the forecast added £27bn to the bottom line, before £19bn from tax and spending decisions made by the Chancellor.

Image of Table 1 - showing changes in the OBR forecast for the fiscal deficit

Click on link to ICAEW version of article which has a machine readable table.

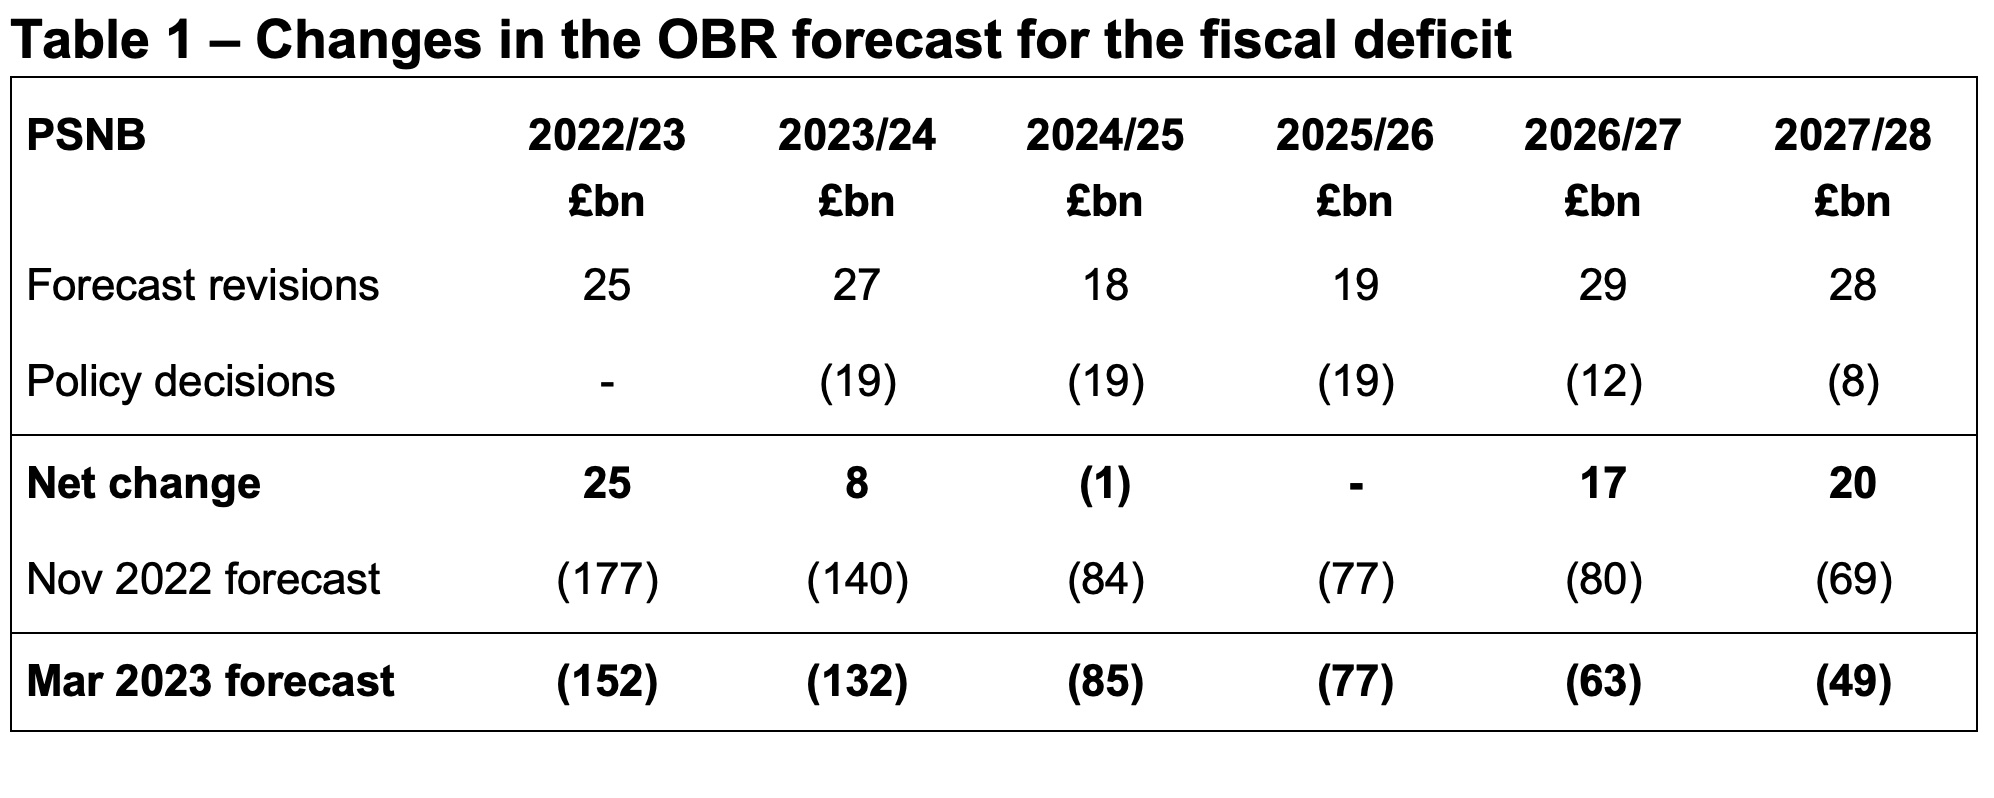
Forecast revisions in 2023/24 comprised £13bn in lower debt interest, £7bn less in energy support and £8bn in higher tax receipts, less £1bn other changes. The cost of tax and spending decisions in 2023/24 was estimated to be £8bn in lower corporation tax receipts from the full expensing of capital expenditure, £5bn from freezing fuel duties, £5bn from extending the energy price guarantee and other energy support measures, £2bn more for defence and security and £2bn from other decisions, less £3bn in indirect effects of those policy decisions on tax receipts and welfare spending.

Total receipts in 2023/24 are now expected to be £1,057bn (£2bn higher than previously forecast) and total managed expenditure is now anticipated to be £1,189bn (£10bn lower).

The forecast for the deficit in 2024/25 was up £1bn at £85bn and was unchanged in 2025/26 at £77bn, with upward revisions of £18bn and £19bn respectively offset by an estimated £19bn net cost of tax and spending decisions. The latter includes £3bn in 2024/25 and £4bn in 2025/26 for expanded childcare eligibility.

The final two years of the forecast were better by £17bn in 2026/27 (down to a fiscal deficit of £63bn) and by £20bn in 2027/28 (down to £49bn), although several commentators have pointed out this is on the basis of unrealistic spending assumptions that do not take account of significant pressures on public services.

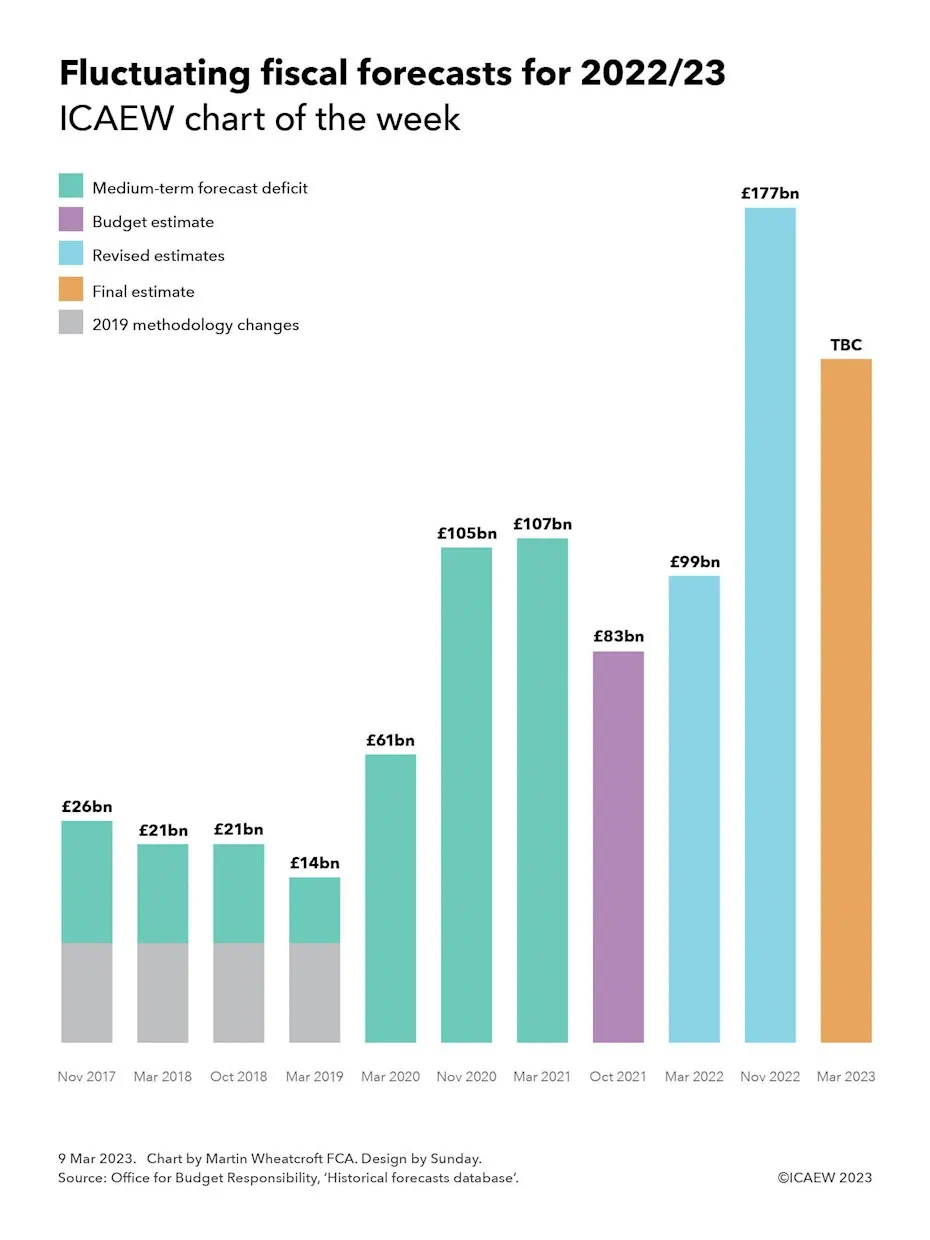
In addition to forecasts for the next five years, the OBR also revised its estimate for the deficit in the current financial year ending 31 March 2023 to £152bn, £25bn lower than November’s estimate of £177bn. This is £53bn more than the OBR’s March 2022 estimate of £99bn and £69bn more than the November 2021 Budget estimate of £83m.

Table 2 provides a breakdown of the forecast changes by year, showing how lower debt interest and higher tax receipts flowing through the forecast period have provided the Chancellor with capacity to extend energy support, incentivise business investment, freeze fuel duty for yet another year (and extend the temporary 5p cut) and increase spending in specific areas.

Image of Table 2 - showing breakdown of forecast revisions and policy decisions.

Click on link to ICAEW version of article which has a machine readable table.

Receipts and expenditure development

As illustrated by Table 3, receipts are expected to rise from £1,020bn in the current financial year to £1,231bn in 2027/28, while expenditure excluding energy support and interest is expected to rise from £968bn in 2022/23 to £1,121bn in 2027/28.. 

Interest costs are expected to fall from £115bn this year to £77bn in 2025/26 as interest rates and inflation moderate, before rising to £97bn in 2027/28 based on a growing level of debt.

Net investment is expected to increase in 2023/24 as an £8bn one-off credit from changes in student loan terms in 2022/23 reverses, before declining gradually as capital expenditure budgets flatline and depreciation grows. Public sector gross investment is planned to be £134bn, £134bn, £133bn, £132bn and £132bn over the five years to 2027/28, in effect a cut in real terms over the forecast period.

Image of Table 3 - summarising the March 2023 OBR forecast

Click on link to ICAEW version of article which has a machine readable table.

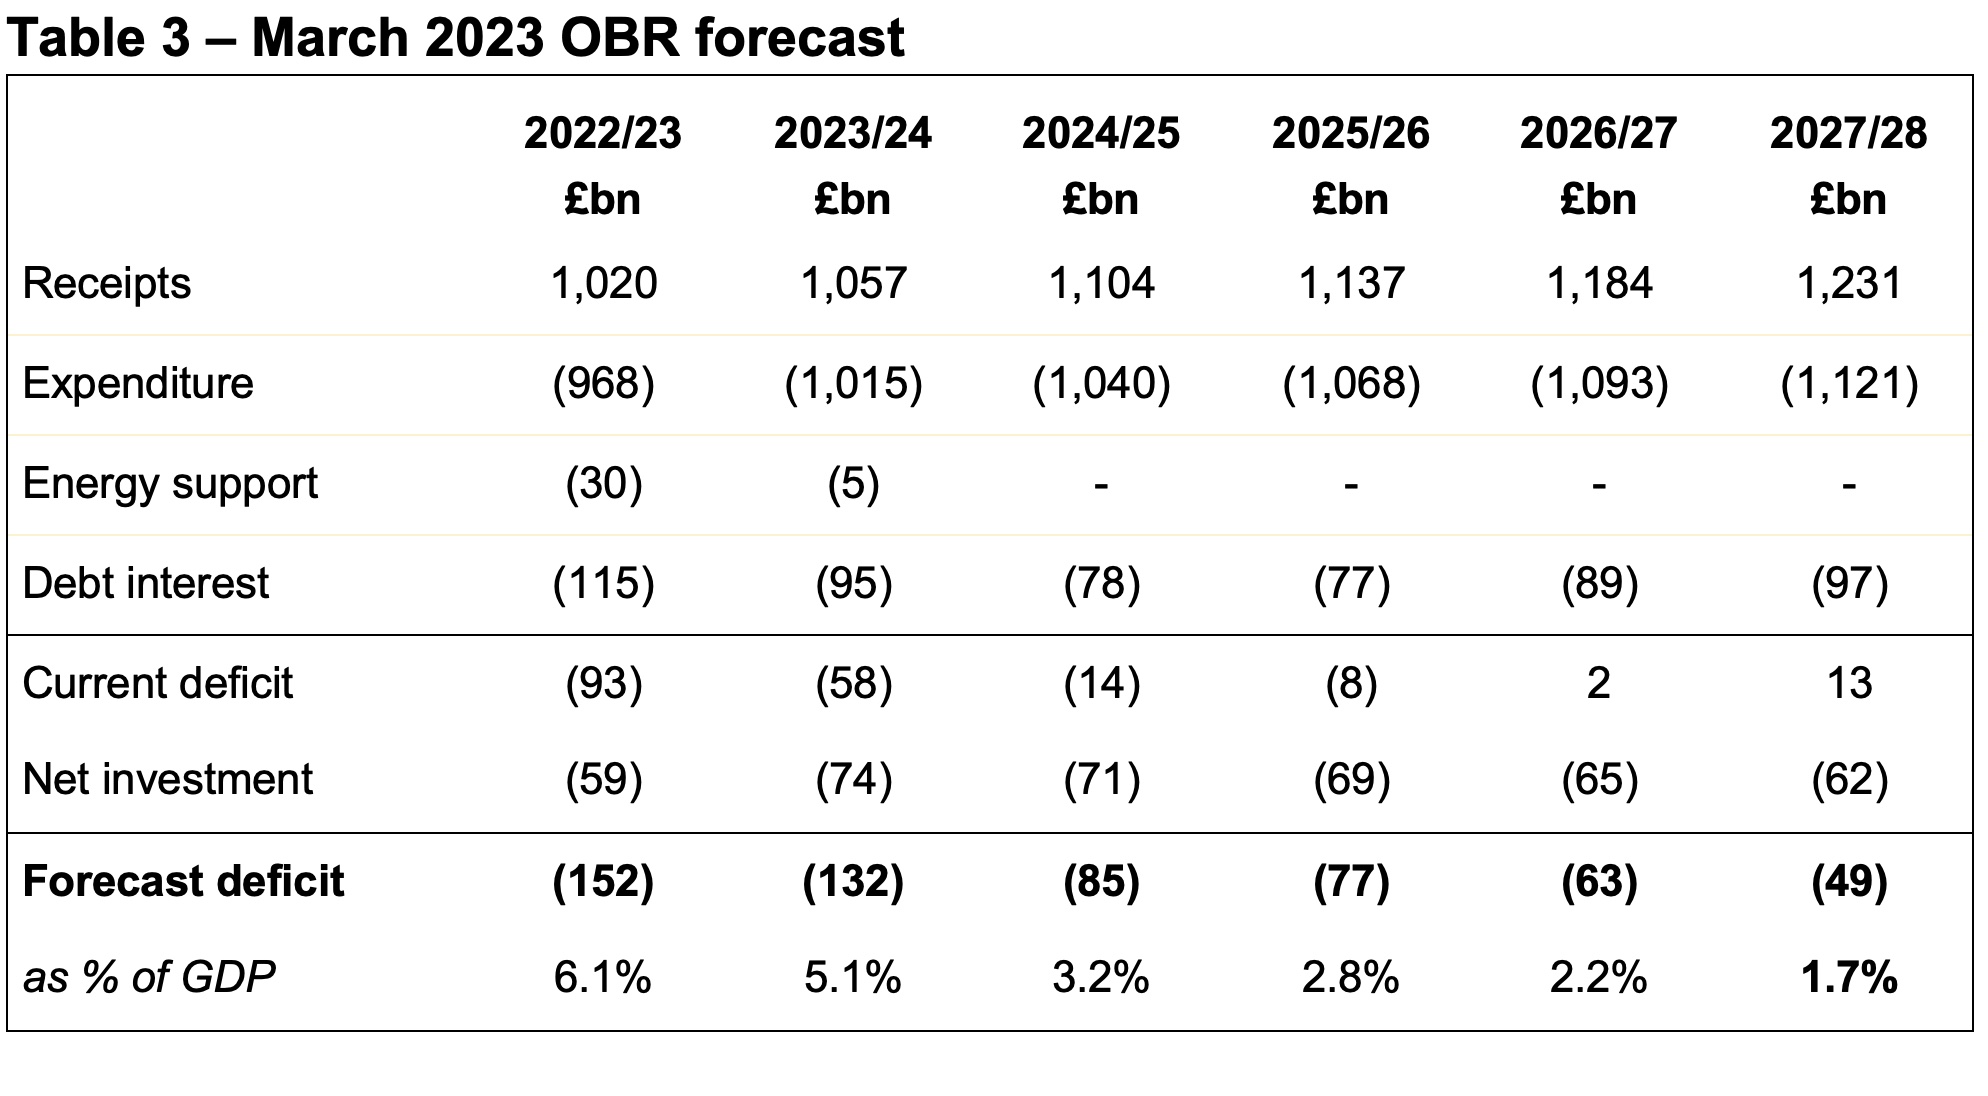
The government’s secondary fiscal target is to keep the fiscal deficit below 3% of GDP by the end of the forecast period. Based on the March 2023 forecasts, it has headroom of 1.3% of GDP, or £39bn, against this target.

Table 4 provides a summary of the year-on-year changes in receipts and spending, together with the forecast for the increase in the size of the economy, including inflation. This highlights how tax and other receipts are expected to increase faster than the overall rate of growth in the overall size of the economy, while the government plans to constrain the average rise in expenditure excluding energy support and interest to 3.0% including inflation.

The former is principally a result of ‘fiscal drag’ as tax allowances are frozen, bringing in proportionately more in tax as incomes rise with inflation. The latter reflects what is generally considered to be unrealistic plans to constrain public spending in the context of an expected 9% rise in the number of pensioners over the five-year period (that will add to pensions, welfare, health and social care spending), pressure on public sector pay and the deteriorating quality of public services.

Image of Table 4 - year-on-year % changes in receipts and spending.

Click on link to ICAEW version of article which has a machine readable table.

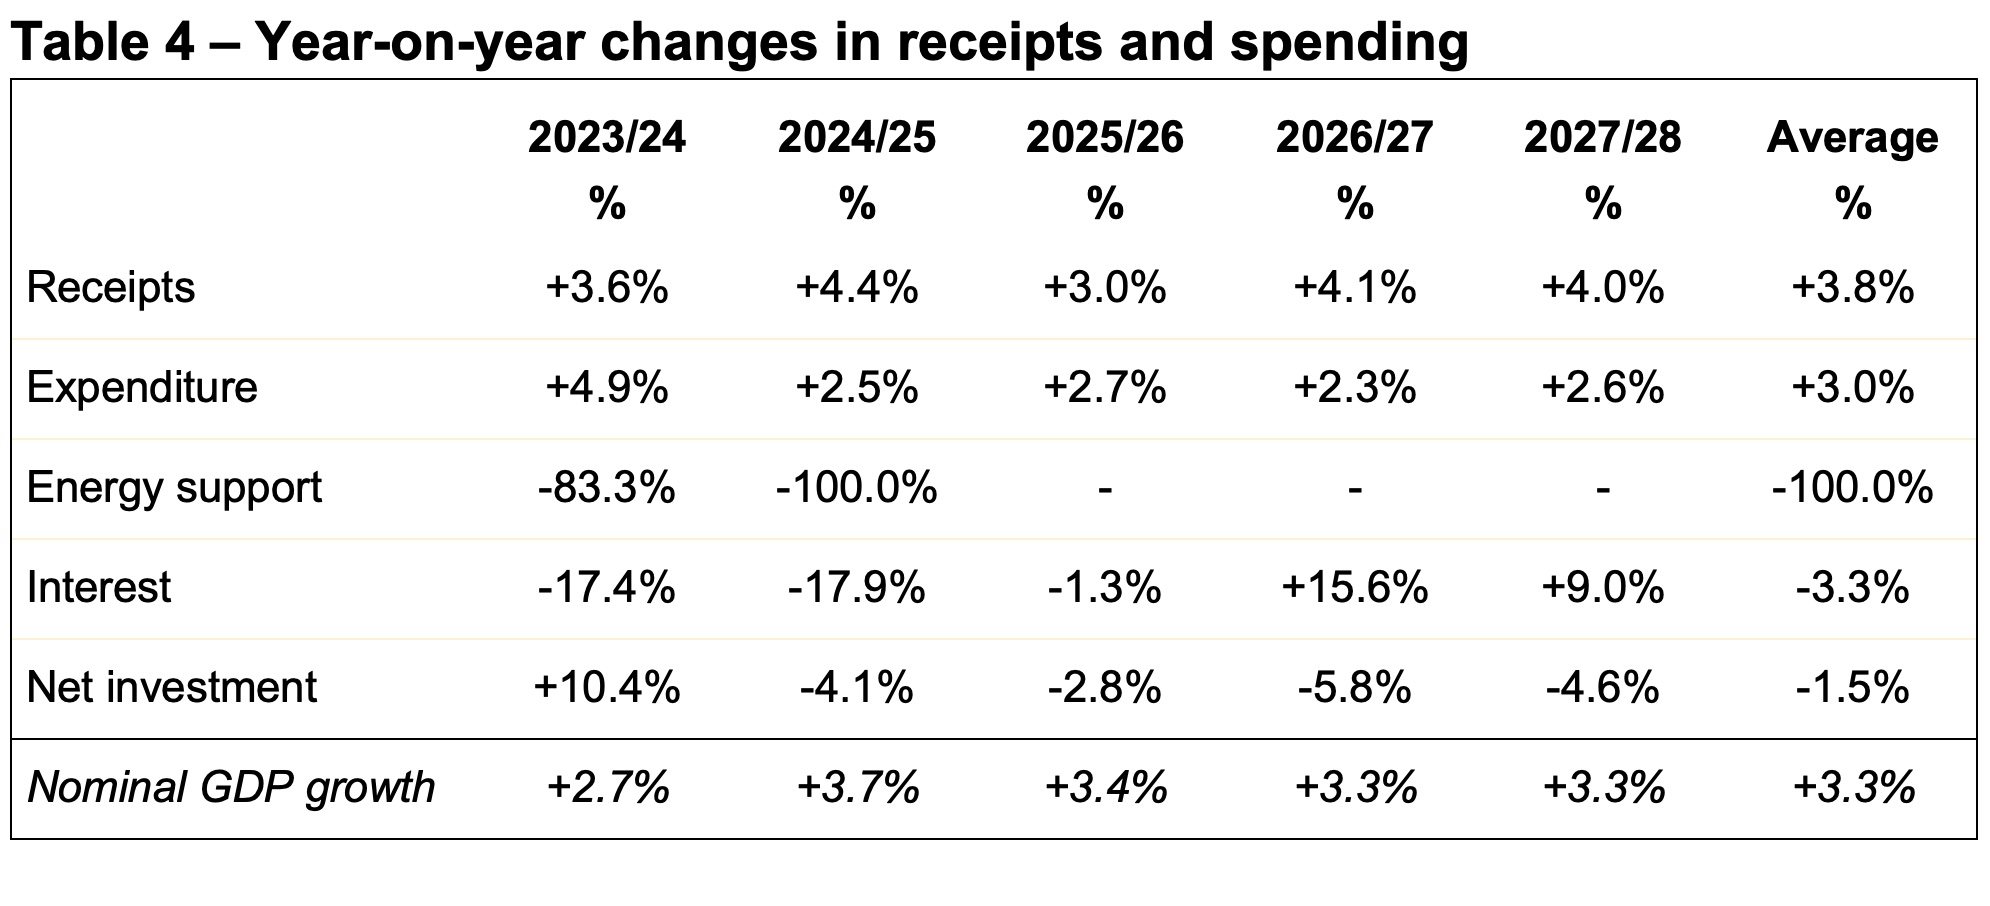
Average nominal GDP growth over the five years of 3.3% combines average real-terms economic growth of 1.7% a year and inflation of 1.6%, the latter using the GDP deflator, a ‘whole economy’ measure of inflation. This is different to consumer price inflation, which is forecast to fall to 4.1% in 2023/24 and average 1.4% over the five years to 2027/28. 

Public sector net debt

Lower deficits over the forecast period translate into lower borrowing requirements, reducing forecasts for public sector net debt from just under £3.0trn to £2.9trn. This is partly increased or offset by changes in the forecasts for financial and other transactions and working capital movements.

Table 5 shows how forecast public sector net debt is now expected to reach £2,909bn by March 2028, £54bn less than was forecast in November. Although an improvement, debt at the end of the forecast period is expected to be £1,089bn higher than £1,820bn reported for March 2020 before the pandemic, reflecting the large amounts borrowed during the pandemic, in addition to borrowing planned over the next five years. 

Image of Table 15- showing changes in the OBR forecast for public sector net debt.

Click on link to ICAEW version of article which has a machine readable table.

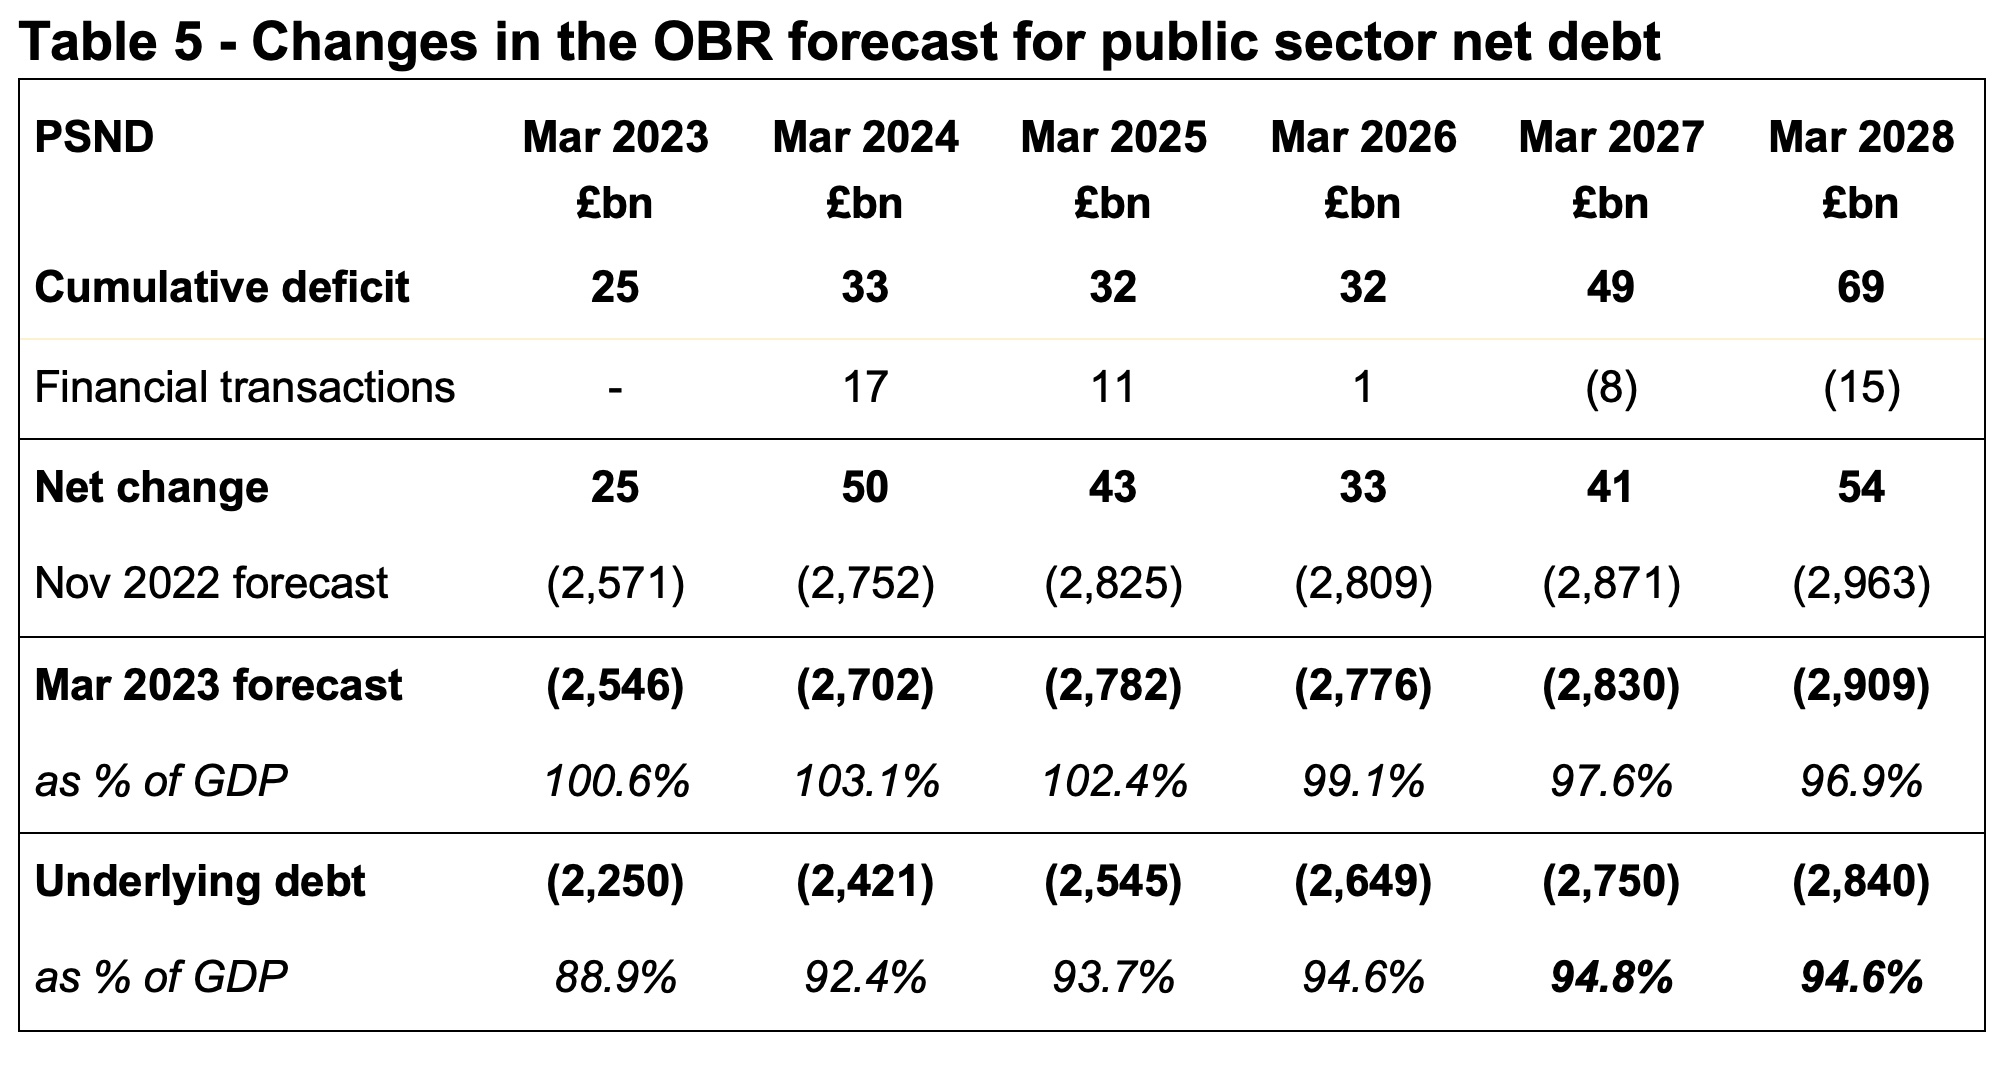
The government’s primary fiscal target is based on ‘underlying debt’, a non-generally accepted statistical practice measure that excludes the Bank of England and hence quantitative easing balances. Underlying debt needs to be falling as a proportion of GDP between the fourth and fifth year of the forecast period. 

The forecast gives the Chancellor just £6.5bn in headroom against this target, with underlying debt / GDP expected to fall from 94.8% to 94.6% between March 2027 and March 2028.

Fiscal rules limit ambitions for tax and spending

Following the disastrous ‘mini-Budget’ of his predecessor Kwasi Kwarteng, the Chancellor’s principal goal has been to stabilise the public finances to provide confidence to debt markets. To do this he has prioritised meeting his fiscal rules over incentivising business investment, cutting taxes and increasing defence spending. He has also adopted what are generally considered to be unrealistic assumptions about public spending in the later years of the forecast to keep within his self-imposed fiscal rules.

This has led to the Chancellor announcing ‘ambitions’ to extend the full expensing of capital expenditure beyond three years and to increase defence and security spending to 2.5% of GDP, as well as continuing to plan for increases in fuel duties each year despite the repeated practice of cancelling these rises. 

Because these are ambitions and not plans, they are not incorporated into the forecasts enabling fiscal targets to be met. The OBR reports that continuing to cancel fuel duty rises each year would reduce the headroom to just £2.8bn, while converting the Chancellor’s ambitions to extend full expensing beyond three years and to increase defence spending to 2.5% of GDP into formal plans would cause him to breach his primary fiscal rule.

Conclusion

The overall fiscal position remains weak, with public finances vulnerable to potential economic shocks.

The Chancellor has followed the practice of many of his predecessors in increasing planned borrowing when fiscal forecasts worsen, as occurred in November 2022, only to then use upsides from improvements in subsequent forecasts to fund new tax and spending commitments. This ratchets up borrowing and debt as forecasts fluctuate and creates instability in both tax policy and public spending plans.

The consequence is a relatively unchanged fiscal position for the financial year commencing 1 April 2023 and the two subsequent financial years, as tax and spending decisions offset forecast upsides. And although there is an anticipated improvement in the projected fiscal position in the final two years of the OBR’s five-year forecast (after the next general election), the likelihood is that it will be offset in due course by the reality of pressures on public service and welfare budgets.

There is a reason why the first Budget following a general election typically sees taxes rise and the Spring Budget 2023 suggests that this pattern is likely to be repeated, irrespective of whichever party wins power.

Read more about the Spring Budget 2023.

This article was originally published by ICAEW.

ICAEW chart of the week: Spring Budget 2023

My chart this week is on the Chancellor’s tax and spending plans for the coming financial year commencing on 1 April 2023.

Column chart showing the final fiscal estimate for 2022/23 and the Budget estimate for 2023/24.

Final estimate 2022/23
Deficit £152bn.
Receipts £1,020bn =  Taxes £922bn + other receipts £98bn. 
Spending £1,172bn = expenditure £968bn + energy support £30bn + interest £115bn + net investment £59bn.

Budget estimate 2023/24
Deficit £132bn.
Receipts £1,057bn =  Taxes £950bn + other receipts £107bn. 
Spending £1,189bn = expenditure £1,015bn + energy support £5bn + interest £95bn + net investment £74bn.

Chancellor Jeremy Hunt presented his first Budget to Parliament on Wednesday 15 March 2023, setting out his formal Budget estimate for the financial year ended 31 March 2024 (2023/24) accompanied by fiscal forecasts from the Office for Budget Responsibility (OBR) for the period up to 2027/28 and the OBR’s final estimate for the current financial year ending on 31 March 2023.

Our chart this week starts by summarising the final estimate for 2022/23, highlighting an expected shortfall of £152bn between anticipated receipts of £1,020bn and spending of £1,172bn. This is followed by a similar analysis for the budget year of 2023/24, with a deficit of £132bn resulting from a shortfall between estimated taxes and other receipts of £1,057bn and spending of £1,189bn.

Receipts in 2022/23 and 2023/34 respectively comprise £922bn and £950bn in tax and £98bn and £107bn in other receipts. The increase in tax of 3.0% is perhaps lower than might be expected given the level of inflation and the new higher rate of corporation tax from 1 April 2023, with an anticipated 10% growth in corporation tax receipts (net of full expensing of business investment) offset by flat or relatively small growth in other taxes. Other receipts are expected to increase by 9%, primarily the effect of higher interest rates on investments.

Total managed expenditure in 2022/23 and 2023/24 respectively comprise £968bn and £1,015bn in current expenditure excluding energy support costs and debt interest, £30bn and £5bn in energy support packages, £115bn and £95bn in debt interest, and £59bn and £74bn in net investment.

Current expenditure excluding energy support costs and debt interest is expected to increase by 4.9% in 2023/24 compared with 2022/23, more than the 2.5% ‘whole economy’ measure of inflation used by the government and the 4.1% forecast for consumer price inflation. This partly relates to inflation in the current financial year feeding through into next year’s budgets, as well as spending measures announced by the Chancellor.

The three-month extension of the energy price guarantee is anticipated to cost £3bn in 2023/24, with other energy support measures adding a further £2bn to the forecast.

Debt interest is expected to fall by 17% to £95bn, principally because of the effect of a much lower rate of inflation on index-linked debt more than offsetting higher interest rates overall.

Public sector net investment comprises gross investment of £116bn and £134bn in the two years respectively, net of depreciation of £57bn and £60bn respectively. The increase in gross investment is flattered by a £8bn one-off credit in the current financial year arising from changes to student loans, which if excluded implies an 8% increase in capital expenditure and other public investment overall. This reflects delays in capital programmes that are expected to come in significantly under budget in the current financial year but cost more in the next, relatively high construction price inflation, and an extra £2bn of capital investment allocated to defence.

The final estimate for the deficit in the current financial year of £152bn is £25bn lower than was expected in the OBR’s November 2022 forecast of £177bn, while the Budget estimate for 2023/24 of £132bn is £8bn lower than the £140bn forecast last time. The reduction in 2022/23 reflects the benefit of a slightly improved economic outlook, with policy decisions for the last couple of weeks of the financial year by the Chancellor netting off to close to nil. This contrasts with 2023/24, where forecast upsides amounting to around £27bn have been mostly offset by a net cost of £19bn from tax and spending decisions.

Overall, the chart highlights just how much money the UK raises in tax and incurs in public spending. Tax and other receipts are expected to approach £1.1trn in the coming financial year, while public spending is anticipated to be just under £1.2trn. 

On a per capita basis in 2023/24 this is equivalent to receipts and spending of approximately £1,290 per month and £1,450 per month for each person in the UK respectively, a shortfall of £160 per person per month that needs to be funded by borrowing.

The challenge for the Chancellor is that with the number of pensioners projected to increase by 9% over the next five years (with consequent implications for spending on pensions, welfare, health and social care), there is not much room to invest in public services or in infrastructure at the same time as also reducing taxes as he would very much like to do. 

The Chancellor wasn’t able to square this circle in the Spring Budget 2023, so watch this space to see whether he can be any more successful in future fiscal events.

This chart was originally published by ICAEW.

ICAEW chart of the week: Fluctuating fiscal forecasts

Ahead of the Spring Budget on 15 March, I take a look at how the official forecast for the 2022/23 fiscal deficit has fluctuated through successive forecasts.

Column chart showing the forecast fiscal deficit for the financial year 2022/23 over successive forecasts.

First four columns (*) have £21bn added to them for methodology changes.

Nov 2017 £26bn *
Mar 2018 £21bn *
Oct 2018 £21bn *
Mar 2019 £14bn *
Mar 2020 £61bn
Nov 2020 £105bn
Mar 2021 £107bn
Oct 2021 £83bn - Budget estimate
Mar 2022 £99bn - revised estimate
Nov 2022 £177bn - revised estimate
Mar 2023 TBC

My chart this week is on the topic of fiscal forecasting, and how the forecast deficit for the UK government’s financial year ending 31 March 2023 (2022/23) has changed over the course of five or so years of official forecasts. 

Our story starts with the Autumn Budget in November 2017, when the Office for Budget Responsibility (OBR) first published a medium-term fiscal forecast that extended to 2022/23. After plugging economic assumptions into its model and combining it with the government’s plans for public spending, it came up with a forecast of £26bn for the 2022/23 fiscal deficit, the shortfall between receipts and public spending calculated in accordance with statistical rules.

Then Chancellor Philip Hammond was at that time pretty positive about the economic prospects for the UK, despite weak productivity causing him to abandon the government’s medium-term plan to completely eliminate the budget deficit. Instead, he settled for a more modest objective of a balanced current budget and a falling debt-to-GDP ratio, extending austerity policies to cut public spending.

The next few fiscal events saw the OBR revise down its forecast for the 2022/23 deficit in the light of moderately better economic data each time. This saw the forecast for the 2022/23 deficit reduce to £21bn in the March 2018 forecast, stay at £21bn in October 2018 and fall to £14bn in the March 2019 forecast. 

The forecasts up to this point were before methodology changes announced in 2019 relating to the treatment of student loans and other items. According to the OBR these had the effect of increasing the forecast for the fiscal deficit in 2022/23 by an estimated £21bn.

The calling of a general election in December 2019 prevented Chancellor Sajid Javid from presenting a Budget in November 2019, so the OBR had to wait until March 2020 to publish its next forecast. At this point, 2022/23 was in the middle of the forecast period and Rishi Sunak’s first fiscal event as Chancellor saw a £26bn increase in the 2022/23 deficit to £61bn in an ‘end-to-austerity’ Budget that saw £46bn in extra planned spending compared with previous forecasts.

Frustratingly for the OBR, its forecasts that day were immediately out of date, as initial emergency pandemic measures were decided too late to be incorporated into its calculations. While these and subsequent temporary measures to support households and businesses through the pandemic primarily affected the 2020/21 and 2021/22 financial years, the economic hit caused by COVID-19 was the primary reason for the OBR increasing its forecast for the 2022/23 fiscal deficit to £105bn in November 2020.

March 2021 saw a small tweak to the forecast to £107bn, but the Autumn Budget and Spending Review in November 2021 saw an improvement to £83bn as the economy emerged from the lockdown phases of the pandemic in a slightly better place than was previously anticipated, with higher spending funded by planned tax rises.

This positive move went into reverse in March 2022 as the OBR revised its Budget estimate upwards to £99bn, reflecting rising interest rates on government debt and the government’s initial response to an emerging cost-of-living crisis. 

The OBR was not asked to produce an official forecast to accompany short-lived Chancellor Kwasi Kwarteng’s tax-cutting ‘mini-Budget’ in September. At £177bn the OBR forecast for the 2022/23 fiscal deficit in November 2022 was eye-watering enough, and that was after current Chancellor Jeremy Hunt’s Budget had reversed most of his predecessor’s tax cuts.

Lower than anticipated wholesale energy prices have led several commentators to suggest that the OBR’s final estimate for the fiscal deficit could be revised down by £30bn or more when it presents its medium-term forecasts up to 2027/28 to accompany the Spring Budget on 15 March 2023. As the chart suggests, this is not a ‘windfall’ as some commentators have claimed. Even if the gap between receipts and spending narrows, the deficit will still be significantly higher than the £83bn official estimate included in the Budget for 2022/23 presented to Parliament.

Fiscal forecasting is of course a very difficult task even in normal times. The deficit is the difference between two very large numbers – receipts of just over a trillion pounds and public spending of nearly £1.2trn – that can each move up or down significantly as economic conditions change, and policy choices are made. Add to that a global pandemic, a cost-of-living crisis and an uncertain policy outlook, and it is perhaps unsurprising that the forecasts have changed so much over the past five years. 

In an uncertain world, fiscal forecasts fluctuate.

This chart was originally published by ICAEW.

ICAEW publishes its vision for local audit

In response to the crisis in financial reporting and audit in local authorities in England, ICAEW argues that urgent action is needed to bring confidence to the finances of local public bodies. 

ICAEW’s vision for local audit sets out its support for understandable financial reports, timely high-quality local audits, strong financial management and good governance, value for money and protecting the public interest, and the critical role accountants and auditors play in enhancing transparency and accountability in the public sector.

The proportion of local authorities in England publishing their audited financial statements on time has fallen from more than 95% in 2017 to less than 12% in 2022, with knock-on effects for the audits of other local public bodies such as in the NHS. High-profile governance failures have led to significant financial losses. Unnecessarily impenetrable financial statements are not well understood and are not being used effectively to hold local public bodies to account. There is insufficient capacity in the local audit market, while auditors, finance teams and regulators are not aligned in their view of audit risks. Under-resourced finance teams struggle to produce good quality working papers. Local authority finance teams and audit firms struggle to retain staff in the profession. 

ICAEW is publishing its vision for local audit to accompany the recent publication of a Memorandum of Understanding (MoU) between the Department of Levelling Up, Housing and Communities (DLUHC) and the Financial Reporting Council (FRC). The Institute welcomes the MoU, which covers the role of the ‘shadow’ system leader for local audit pending the establishment of the Audit, Reporting and Governance Authority (ARGA). 

ICAEW also believes more needs to be done urgently if the local financial reporting and audit crisis is to be resolved.

Designed to prompt discussion about the need for urgent action, the vision identifies a series of challenges we believe need to be overcome, and actions we support to address those challenges. The vision in draft form has provided ICAEW with a focus for engagement with local authorities, auditors, government, and regulators, provoking debate and encouraging everyone involved to take action. 

Alison Ring OBE FCA, Director of Taxation and Public Sector at ICAEW, commented: “Urgent action is needed to address the crisis in local financial reporting and audit in England. Local authority finances are under extreme pressure and the need for high quality financial statements, with the assurance that timely audit provides, is more important than ever.

“We want to see a robust financial reporting and audit system, underpinned by strong financial management, good governance and value for money, to protect the public interest. The vision highlights the critical role accountants and auditors play in enhancing transparency and accountability in the public sector.”

This article was originally published by ICAEW.

ICAEW chart of the week: Government bond yields

My chart this week looks at what a difference one year has made to the cost at which governments around the world can borrow.

Column chart showing 10-year yields on government debt as at 2 Mar 2022 and 2 Mar 2023.

Japan: 0.13%, 0.50%
Germany: 0.02%, 2.71%
France: 0.47%, 3.19%
Canada: 1.81%, 3.40%
UK: 1.26%, 3.84%
USA: 1.87%, 4.02%
Italy: 1.55%, 4.56%

Source: Bloomberg, 'Rates & Bonds 2023-03-02 11:33'.

The past year has seen a dramatic change in economic fundamentals around the world as inflation has surged and growth has stuttered. One of the most dramatic changes has been to the cost of new government borrowing, with the yields payable by governments to sovereign debt investors increasing significantly from where they were a year ago.

As our chart of the week illustrates, Japan has seen yields on 10-year government bonds increase from 0.13% on 2 Mar 2023 to 0.50% on 2 Mar 2023, a far cry from the negative yields it has obtained over much of the last decade when (in effect) investors were paying the government of Japan for the privilege of lending it money. The change for Germany has been even more marked, from a position a year ago where it could borrow over 10 years for almost nothing (0.02%) to today where if it wanted to raise new funds it would pay an interest rate of 2.71% over 10 years. 

The other members of the G7 have also seen the effective interest rate payable on 10-year government bonds rise, with France going from 0.47% a year ago to 3.19% today, Canada from 1.81% to 3.40%, the UK from 1.26% to 3.84%, the USA from 1.87% to 4.02%, and Italy from 1.55% to 4.56%.

Yields from 10-year government bonds are seen as a benchmark rate for most countries, as although governments can and do borrow for much longer periods – with market data often available for 20-year and 30-year bonds as well – most countries have average maturities of much shorter periods. The UK is an outlier in this respect with an average debt maturity on government securities of just over 15 years (before taking account of quantitative easing), in contrast with the more typical average maturity of seven years for Italian government debt.

Although the amount payable on new debt has risen significantly, this should in theory feed in to overall cost of government borrowing gradually as it will take time for existing government bonds to mature and be refinanced. For some time to come the overall cost of borrowing will continue to benefit from medium- and long-term government bonds that were issued at the ultra-low borrowing rates experienced over the last decade or so.

However, in practice not all government borrowing is at fixed rates, with many governments (including the UK) issuing inflation-linked debt, adding to their interest costs as inflation has surged. In addition, some government debt is short term or pays a variable rate of interest, while quantitative easing has seen central banks swap a substantial proportion of fixed-rate government bonds into variable-rate central bank deposits, increasing governments’ exposure to changes in short-term interest rates.

Either way, the rapid rise in the interest rates payable on sovereign debt marks a significant shift in the fiscal calculus for most governments when combined with much higher levels of debt in most developed countries. Lots more pounds, euros, dollars and yen will need to be diverted to servicing debt, making for hard choices for finance ministers as they work out their budgets for coming years.

This chart was originally published by ICAEW.

ICAEW chart of the week: US federal financial statements

My 250th chart of the week for ICAEW takes a look at the recently published Financial Report of the United States Government for the year ended 30 September 2022 and how net liabilities have increased by 67% to $34trn over the past five years.

This week’s chart takes a dive into the latest financial statements of the United States Government for the year ended 30 September 2022 that were published on 16 February 2023, illustrating how the consolidated balance sheet of the executive, legislative and judicial branches has changed over the last five years.

The federal government reported net liabilities of $20.4trn at 30 September 2017, comprising $3.5trn in assets ($1.9trn non-financial and $1.6trn financial) less $23.9trn in liabilities ($14.7trn debt and interest, $7.7trn employee and veteran benefits and $1.5trn other liabilities). 

By 30 September 2022, net liabilities had increased by 67%, from $13.6trn to $34.0trn, comprising $5.0trn in assets ($2.3trn non-financial and $2.7trn financial) less $39.0trn in liabilities ($24.3trn debt and interest, $12.8trn employee and veteran benefits and $1.9trn other liabilities).

The increase in net liabilities is a consequence of net accounting losses of $1.2trn, $1.4trn, $3.8trn, $3.1trn and $4.2trn for the five financial years up to 30 September 2022. These amounts are calculated in accordance with US generally accepted accounting principles (US GAAP) as adapted for government by Federal Financial Accounting Standards (FFAS) issued by the Federal Accounting Standards Advisory Board (FASAB). They differ from cash budget deficits (outlays less receipts) of $0.8trn, $1.0trn, $3.1trn, $2.8trn and $1.4trn over the same period.

Revenue in the year ended 30 September 2022 of $4.9trn comprised $4.0trn from individual income taxes and tax withholdings, $0.4trn in corporate income taxes and $0.5trn in other taxes and receipts. The net cost of government operations amounted to $9.1trn, comprising $7.4trn in gross costs less $0.5trn in fees and charges plus $2.2trn from changes in assumptions. The latter primarily relate to employee and veteran benefit obligations that are on the balance sheet in the US GAAP numbers.

The scale of the negative balance sheet and continued deficit financing highlight just how dependent the US federal government is on its ability to borrow money as needed to meet its financial obligations as they fall due, and why the current challenge in raising its self-imposed debt ceiling is starting to concern markets.

This is the 250th ICAEW chart of the week, a milestone that has crept up on us as we seek to share insights into the economy and public finances that we hope are of interest to ICAEW members and all our other readers. Many thanks for your continued interest and we look forward to providing you with many more nuggets in the future.

This article was originally published by ICAEW.

January surplus small comfort for Chancellor ahead of Spring Budget

Better than expected self assessment tax receipts helped generate a small fiscal surplus of £5bn in January, reducing the year-to-date deficit to £117bn, £7bn more than the comparative period in the previous financial year.

The monthly public sector finances for January 2023 released on Tuesday 21 February 2023 reported a provisional surplus for the month of £5bn. This was a significant improvement over the deficit of £26bn reported for the previous month (December 2022), but £7bn less than the surplus reported for the same month last year (January 2022).

A surplus arose primarily because better than expected self assessment tax receipts were sufficient to offset the effect of higher interest costs, higher inflation on index-linked debt, and the cost of the energy price guarantee for households and businesses incurred during the month. January also saw the Office for National Statistics (ONS) record a £2bn charge for custom duties that the UK had failed to collect when it was a member of the EU Customs Union.

The cumulative deficit for the first 10 months of the financial year was £117bn, which is £7bn more than in the same period last year but £155bn lower than in 2020/21 during the first stages of the pandemic. It was £64bn more than the deficit of £53bn reported for the first 10 months of 2019/20, the most recent pre-pandemic pre-cost-of-living-crisis comparative period. 

The deficit was £22bn below the Office for Budget Responsibility (OBR)’s revised forecast made at the time of the Autumn Statement in November, primarily because the energy price guarantee has cost less than anticipated.

Public sector net debt was £2,492bn or 98.9% of GDP at the end of January 2023, dipping below the £2.5tn reported last month because of corrections to prior month data. This is £672bn higher than net debt of £1,820bn at 31 March 2020, reflecting the huge sums borrowed since the start of the pandemic. The OBR’s latest forecast is for net debt to reach £2,571bn by March 2023 and to approach £3trn by March 2028.

Tax and other receipts in the 10 months to 31 January 2023 amounted to £839bn, £88bn or 12% higher than a year previously. Higher income tax and national insurance receipts were driven by rising wages and the higher rate of national insurance for part of the year, while VAT receipts benefited from inflation in retail prices.

Expenditure excluding interest and investment for the ten months of £802bn was £41bn or 5% higher than the same period in 2021/22, with Spending Review planned increases in spending, the effect of inflation, and the cost of energy support schemes partially offset by the furlough programmes and other pandemic spending in the comparative period not being repeated this year.

Interest charges of £110bn for the 10 months were £49bn or 80% higher than the £61bn reported for the equivalent period in 2021/22, through a combination of higher interest rates and higher inflation driving up the cost of RPI-linked debt. 

Cumulative net public sector investment to January was £44bn, £5bn more than a year previously. This is much less than might be expected given the Spending Review 2021 pencilled in significant increases in capital expenditure budgets in the current year.

The increase in net debt of £120bn since the start of the financial year comprised borrowing to fund the deficit for the 10 months of £117bn together with a further £3bn to fund student loans, lending to businesses and others, and working capital requirements, net of cash inflows from repayments of deferred taxes and loans made to businesses during the pandemic.

Alison Ring OBE FCA, Public Sector and Taxation Director for ICAEW, said: “With a small surplus, January’s fiscal numbers benefited from stronger self-assessment tax receipts than expected, providing some comfort to Chancellor Jeremy Hunt as he assembles his first Budget. The deficit for the current financial year is still on track to be one of the highest ever recorded, reaching £117bn for the ten months to January 2023 after energy support and interest costs more than offset the benefit of higher tax receipts.

Although it appears that inflation has peaked, the near-term economic outlook continues to deteriorate and so calls for immediate tax cuts are likely to remain unanswered. We are asking the Chancellor to take urgent action to eliminate the backlog at HMRC that is inhibiting business growth, and to make improving the resilience of the UK economy and the public finances a priority.”

Table containing four columns with the cumulative ten month numbers from April to January to Jan 2020, 2021, 2022 and 2023 - receipts, expenditure, interest, net investment, deficit, other borrowing, debt movement, net debt and net debt / GDP.

Click on link at end of this post to go to the ICAEW website for a readable version.

Caution is needed with respect to the numbers published by the ONS, which are expected to be repeatedly revised as estimates are refined and gaps in the underlying data are filled.

The ONS made several revisions to prior period fiscal numbers to reflect revisions to estimates. These had the effect of reducing the reported fiscal deficit for the nine months ended 31 December 2022 by £6bn to £122bn and reducing the reported fiscal deficit for the year to 31 March 2022 by £1bn to £122bn.

For further information, read the public sector finances release for January 2023.

This article was originally published by ICAEW.

ICAEW chart of the week: Australia federal deficit

Our chart heads down under this week to take a look at how the reported financial position of Australia’s federal government has changed over the last decade.

Australia Day on 26 January provides an opportunity to take a look at the federal balance sheet for Australia. This is included in the audited consolidated financial statements of the Commonwealth of Australia that are prepared in accordance with Australian Accounting Standards, which generally align with International Financial Reporting Standards (IFRS), although AASB 1049 Whole of Government and General Government Sector Financial Reporting diverges from IFRS in some aspects. They encompass the federal level of government in Australia, excluding states, territories and local authorities.

Our chart shows how the balance sheet has grown over the last 10 years, from net liabilities of A$256bn at 30 June 2012 (£147bn at the current exchange rate of A$1.77:£1.00) to A$607bn at 30 June 2022 (£348bn).

At 30 June 2012, the balance sheet comprised non-financial assets of A$123bn and financial assets of A$268bn, less interest-bearing liabilities of A$288bn, and provisions and payables of A$359bn to give a negative net worth of $256bn. These balances had grown to non-financial assets of A$266bn and financial assets of A$788bn at 30 June 2022, less interest bearing liabilities of A$1,109bn, and provisions and payables of A$552bn. 

Non-financial asset balances grew over the 10 years from 2012 to 2022 with land and buildings increasing from A$35bn to A$66bn, military equipment A$40bn to A$81bn, other plant, equipment and infrastructure $19bn to A$72bn, intangibles A$7bn to A$15bn, heritage and cultural assets A$10bn to A$13bn, and other from A$12bn to A$19bn.

Financial assets also grew, with investments and loan balances increasing from A$197bn to A$640bn, advances from A$27bn to A$70bn, receivables and accrued revenue from A$39bn to A$69bn, and cash from A$5bn to A$9bn. A substantial proportion of this growth relates to the Australia Future Fund, a sovereign wealth fund that was established in 2006 primarily to cover the costs of paying for unfunded pension obligations, together with a series of smaller funds intended to support infrastructure investment, disability insurance, medical research, indigenous communities and natural disasters.

Interest-bearing liabilities increased significantly as a consequence of the pandemic, with government securities increasing from A$268bn to A$577bn over the 10 years to June 2022, central bank and other deposits from A$3bn to A$426bn, and loans, leases and other interest bearing liabilities from A$17bn to A$106bn.

Provisions and payables grew by a lesser extent, with superannuation and other employee liabilities increasing from A$252bn to A$359bn, Australian currency on issue from A$54bn to A$102bn, payables from A$23bn to A$27bn, and provisions from A$30bn to A$64bn.

While negative net worth has increased from 17% of GDP to 24% of GDP over the 10 years, principally as a consequence of the pandemic in the last couple of years, the establishment of the Australia Future Fund, the move of federal employees from defined benefit to defined contribution pension arrangements, and active management of the balance sheet means that Australia is in a much healthier fiscal position than many other developed countries. 

For the Australian Department of the Treasury at least, this should make for a happy Australia Day.

This chart was originally published by ICAEW.

Public sector net debt tops £2.5trn for the first time

The highest December deficit on record has been driven by higher debt interest costs and the cost of energy support schemes.

The monthly public sector finances for December 2022, released on Tuesday 24 January 2023, reported a provisional deficit for the month of £27bn, the highest December deficit since records began in 1993. This was despite a mild December helping to mitigate some of the cost of energy support schemes.

The deficit for the month of £27bn was £12bn higher than the equivalent month in the previous financial year (December 2021) and £8bn more than the previous month (November 2022).

This brought the cumulative deficit for the first three quarters of the financial year to £128bn, which is £3bn below the Office for Budget Responsibility (OBR)’s revised forecast made at the time of the Autumn Statement last November. This substantially exceeds the budget of £99bn for the entire financial year to March 2023 forecast by the OBR at the time of the Spring Statement as higher interest costs, the effect of higher inflation on index-linked debt, and the cost of the energy price guarantee for households and businesses over the winter all add to public spending.

Public sector net debt was £2,504bn or 99.5% of GDP at the end of December 2022, up £131bn from £2,373bn at the end of March 2022. This is £684bn higher than net debt of £1,820bn on 31 March 2020, reflecting the huge sums borrowed since the start of the pandemic. 

The OBR’s latest forecast is for net debt to reach £2,571bn by March 2023 and to approach £3trn by March 2028, although energy prices falling faster than expected may help improve the outlook somewhat.

The cumulative deficit for the first three quarters of the financial year of £128bn was £5bn lower than this time last year and £143bn lower than in 2020/21 during the first stages of the pandemic. However, it was £67bn more than the deficit of £61bn reported for the first nine months of 2019/20, the most recent pre-pandemic pre-cost-of-living-crisis comparative period. 

Tax and other receipts in the three quarters to 31 December 2022 amounted to £721bn, £73bn or 11% higher than a year previously. Higher income tax and national insurance receipts were driven by rising wages and the higher rate of national insurance, while VAT receipts benefited from inflation in retail prices. Year-to-date receipts included £3.7bn accrued for the energy profits levy ‘windfall tax’.

Expenditure excluding interest and investment for the nine months of £716bn was £30bn or 4% higher than the same period in 2021/22, with Spending Review planned increases in spending, high inflation and the cost of energy support schemes more than offsetting the furlough programmes and other pandemic spending in the comparative period not repeated this year.

Interest charges of £100bn for the three quarters were £46bn or 85% higher than the £54bn reported for the equivalent period in 2021/22, through a combination of higher interest rates and higher inflation driving up the cost of RPI-linked debt. 

Cumulative net public sector investment to December was £33bn. This is £2bn more than a year previously, much less than might be expected given the Spending Review 2021 pencilled in significant increases in capital expenditure budgets in the current year.

The increase in net debt of £131bn since the start of the financial year comprised borrowing to fund the deficit for the nine months of £128bn together with a further £3bn to fund student loans, lending to businesses and others, and working capital requirements, net of cash inflows from repayments of deferred taxes and loans made to businesses during the pandemic.

Alison Ring OBE FCA, Public Sector and Taxation Director for ICAEW, said: “A mild December was not enough to prevent public debt from reaching £2.5tn for the first time, in a disappointing set of numbers for December 2022. However, the Chancellor will take comfort that cumulative borrowing for the first three quarters of the financial year was less than feared when the budget for 2022/23 was updated back in November. Energy prices coming down much faster than expected should also improve the outlook for the final quarter as well as the new financial year.

“The deficit is still on track to be one of the highest ever recorded in peacetime and stabilising the fiscal position is the best that Jeremy Hunt can hope for in the short term. Amid a sea of red ink, sustainable public finances remain a distant prospect for now.”

Table showing trends in receipts, expenditure, interest, net investment, deficit, other borrowing, debt movement, net debt and net debt / GDP for the nine months Apr-Dec 2019, 2020, 2021 and 2022.

Click on the link to ICAEW article at the end for a readable version of this table.

Caution is needed with respect to the numbers published by the ONS, which are expected to be repeatedly revised as estimates are refined and gaps in the underlying data are filled.

The ONS made several revisions to prior period fiscal numbers to reflect revisions to estimates. These had the effect of reducing the reported fiscal deficit for the eight months ended 30 November 2022 by £5bn to £101bn and reducing the reported fiscal deficit for the year to 31 March 2022 by £2bn to £123bn.

The revisions in the current year principally relate to an increase of £4bn in the estimate for accrued corporation tax receipts at 30 November 2022, while the prior year numbers were updated to reflect a £0.7bn correction to reported VAT cash receipts during 2021/22 and a £1bn increase in the estimate for accrued corporation tax receipts at 31 March 2022.

This article was originally published by ICAEW.

ICAEW chart of the week: China population

Our chart this week follows the news that China’s population has peaked at just over 1.4bn, illustrating the dramatic change that has taken place over the last 40 years.

Step chart showing the change between China's population in 1981 and 2021.

997m in 1981, comprising 765m age 0-39, 228m age 40-79 and 4m age 80+.

+776m births
- 332m deaths
- 15m net migration

= 1,426m in 2021 comprising 735m age 0-39, 658m age 40-79 and 33m age 80+.

The news that China’s population has peaked and is starting to fall prompted us to take a look at how the country with the largest population in the world has changed over the last 40 years.

In 1981, two years after the introduction of the one-child policy, China was a young country, with a population of 997m and a median age of 21. Today it is a mature country, with a population of 1,426m and a median age of 38, approaching that of many western countries.

Our chart shows how that population has changed according to the United Nations Population Division. In July 1981, China was estimated to amount to 997m, comprising 765m under the age 40, 228m between the ages of 40 and 79, and 4m aged 80 or over. Since then, there have been 776m births, 332m deaths and net outward migration of 15m to reach a total of 1,426m in July 2021. This comprised 735m people aged between 0 and 39, 658m between 40 and 79 and 33m aged 80 or over.

The dramatic change in the age profile reflects the huge success that China has had in tackling poverty and disease, enabling many more children to survive into adulthood compared with previous generations, and to then live longer lives. Infant mortality fell from 45 per thousand births in 1981 to less than six per thousand in 2021 and life expectancy at birth increased from 65 to 78.

The rapid growth in the population over the last 40 years has slowed in recent years as the number of births has fallen and (as the population has aged) deaths have increased. There were 10.9m births in 2021 (down from 12.2m in 2020, much less than the 22.8m births in 1981) and 10.6m deaths (up from 10.3m in 2020 and much higher than the 7.4m deaths recorded in 1981). With net outward migration of 0.2m, the net increase in the population in 2021 was less than 0.1m, down from the net increase of 1.9m in 2021 and much lower than the 17.1m increase experienced in 1982 and the peak increase of 19.9m in 1990.

According to the UN’s numbers, China’s population was expected to peak this year (in 2023), with a central projection that would see the population falling by 233m the next 40 years to 1,193m in 2061, and then to 767m in 2100.

However, China’s population is now believed to have peaked already, with the National Bureau of Statistics of China announcing on 17 January 2023 that China’s population excluding foreign citizens and excluding Hong Kong, Macau and Taiwan fell by 0.85m from 1,412.6m in December 2021 to 1,411.75m at the end of 2022.

India, with an estimated population of 1,407m in July 2021 according to the UN, was expected to overtake China as the world’s largest population during 2023, but there is some speculation following China’s announcement that this has already occurred. India’s population is currently projected to continue to grow over the next 40 years and peak at 1,697m in 2064.

With the population peaking and many more people living longer lives, the fiscal challenge facing China becomes similar to those facing western nations: how to support a rapidly increasing number of pensioners at the same time as the working age population is declining.

This chart was originally published by ICAEW.