March fiscal deficit hits £28bn as departments rush to spend capital budgets

The UK reported a £28.0bn fiscal deficit in March 2021, bringing the total shortfall for 2020-21 to £303.1bn. The last month of the financial year saw net investment of £10.3bn, up from a monthly average of £4.0bn over the previous eleven months.

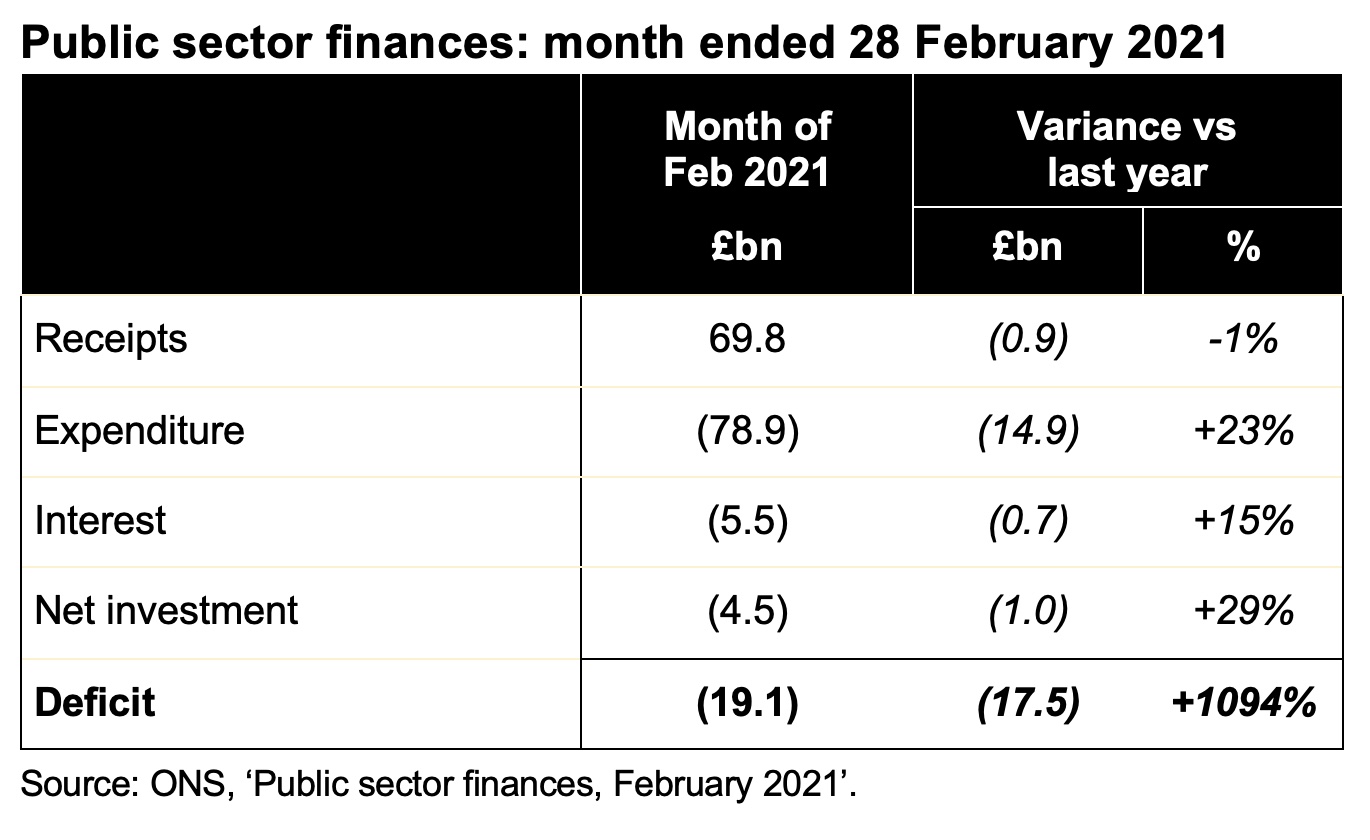
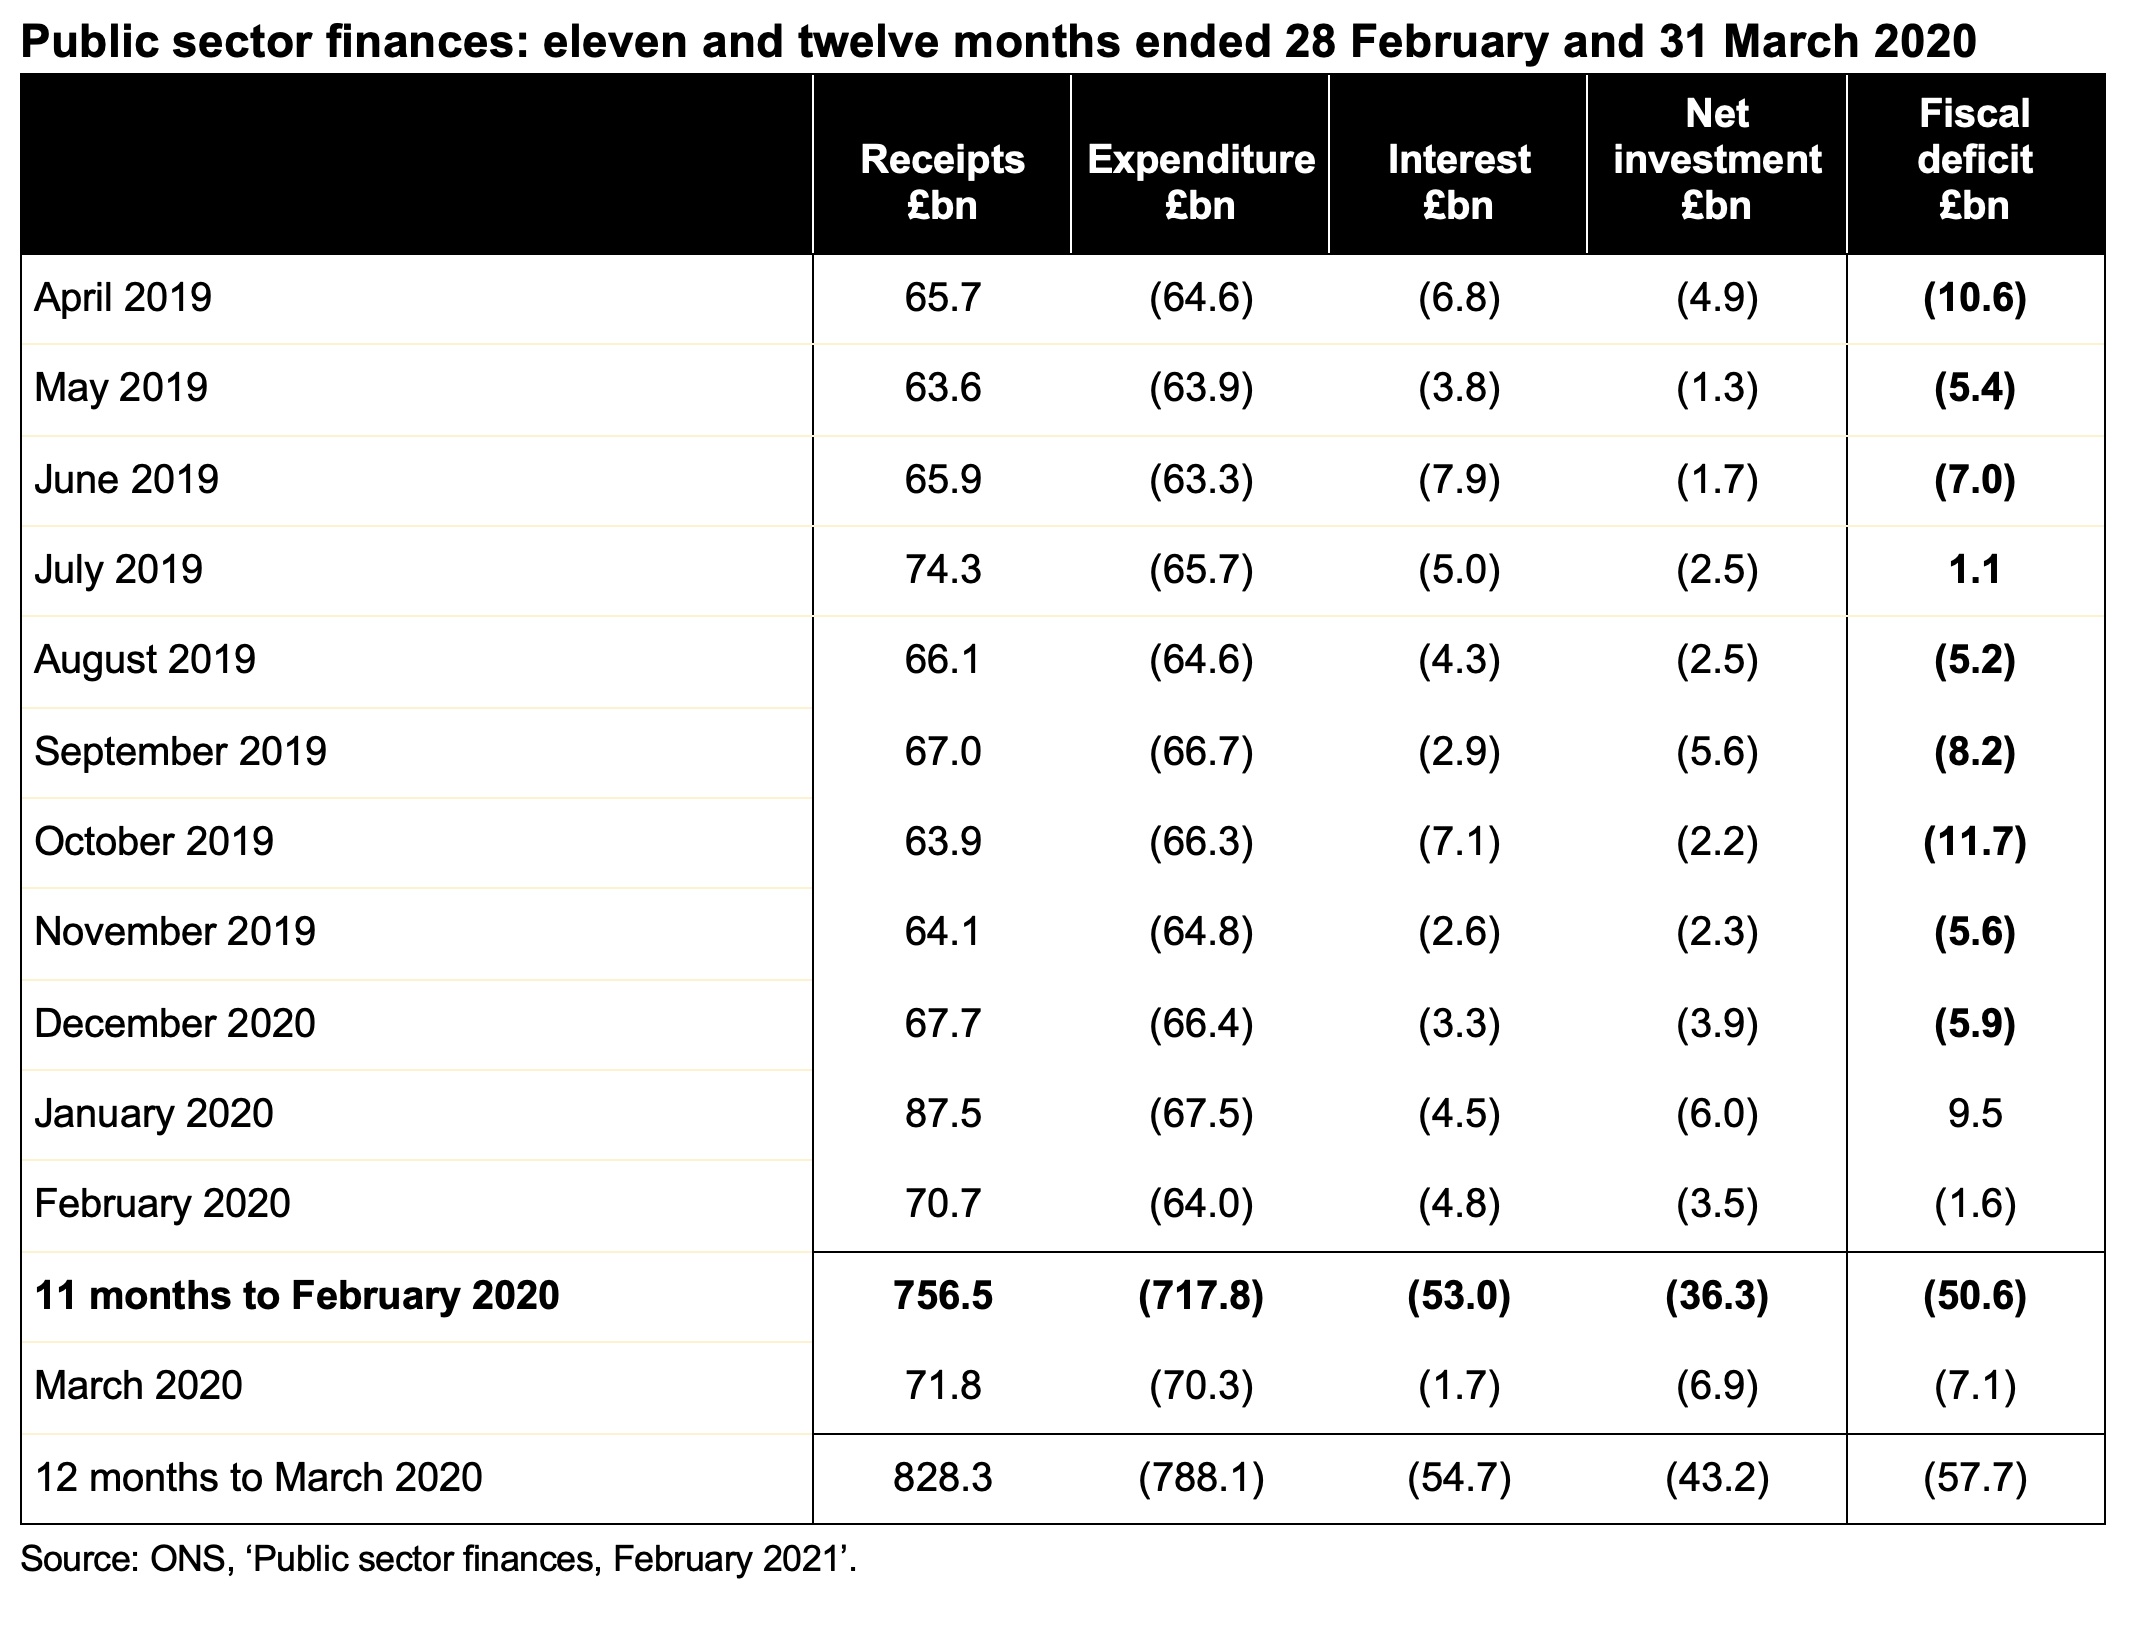
The latest public sector finances released on Friday 23 April reported a deficit of £28.0bn for March 2021, as COVID-related spending continued to weigh on the public finances. This brought the cumulative deficit for the financial year to £303.1bn, £246.0bn more than the £57.1bn reported for the same period last year.

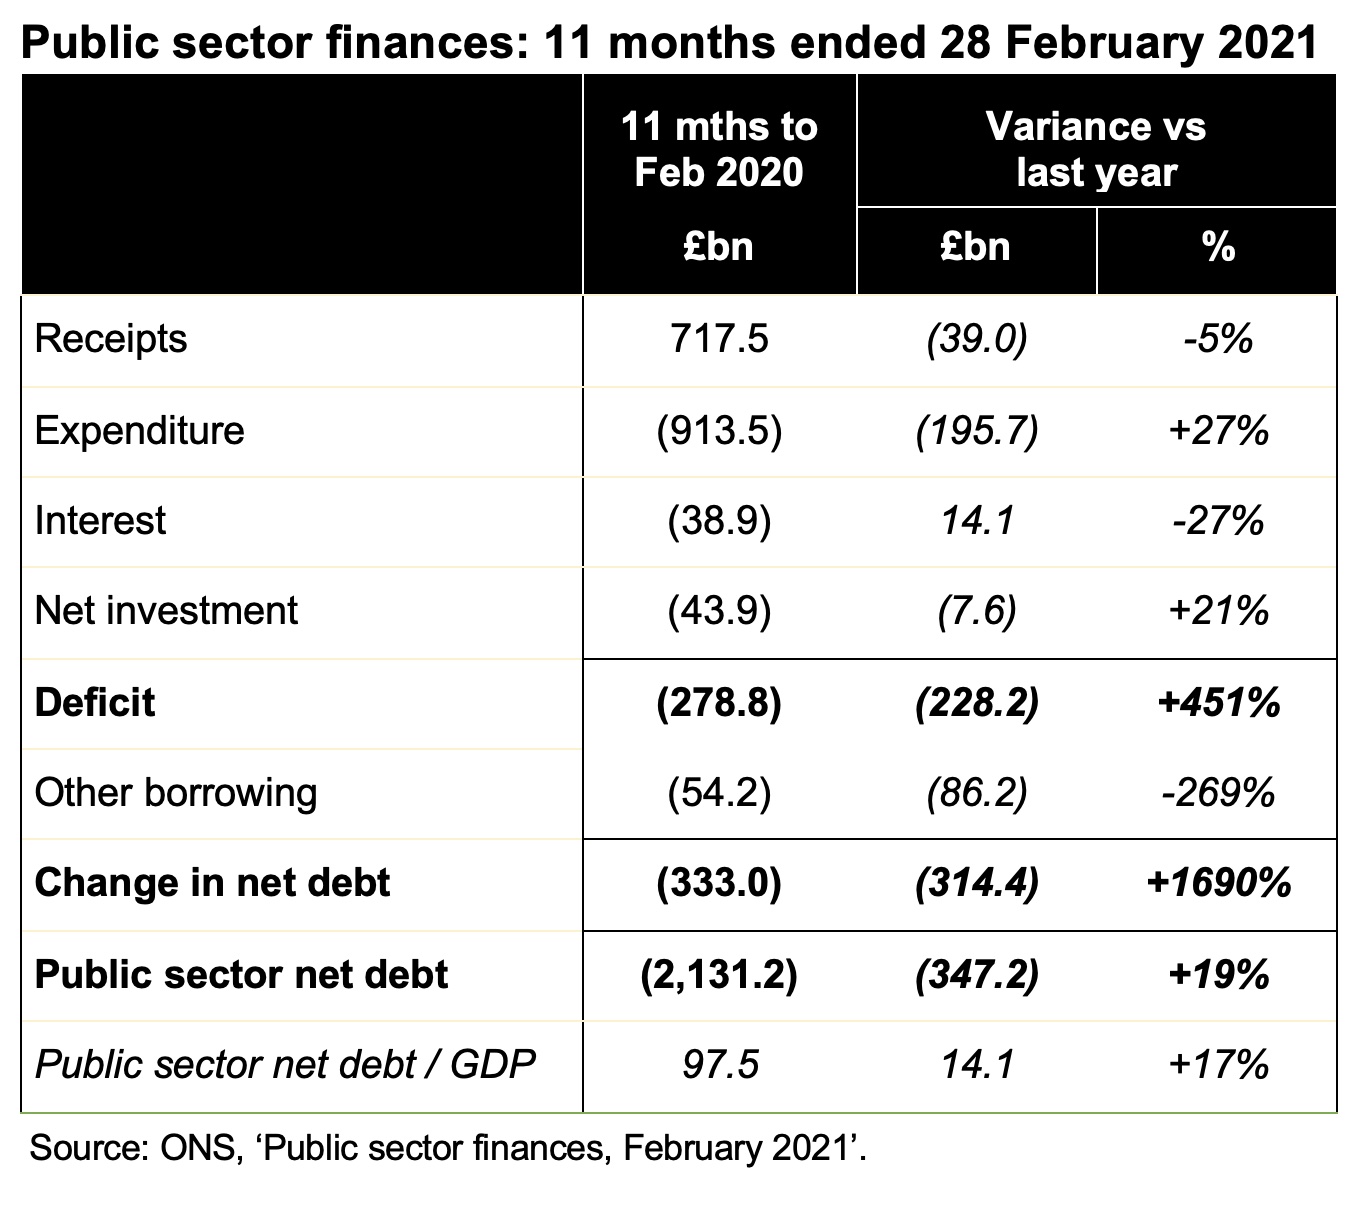
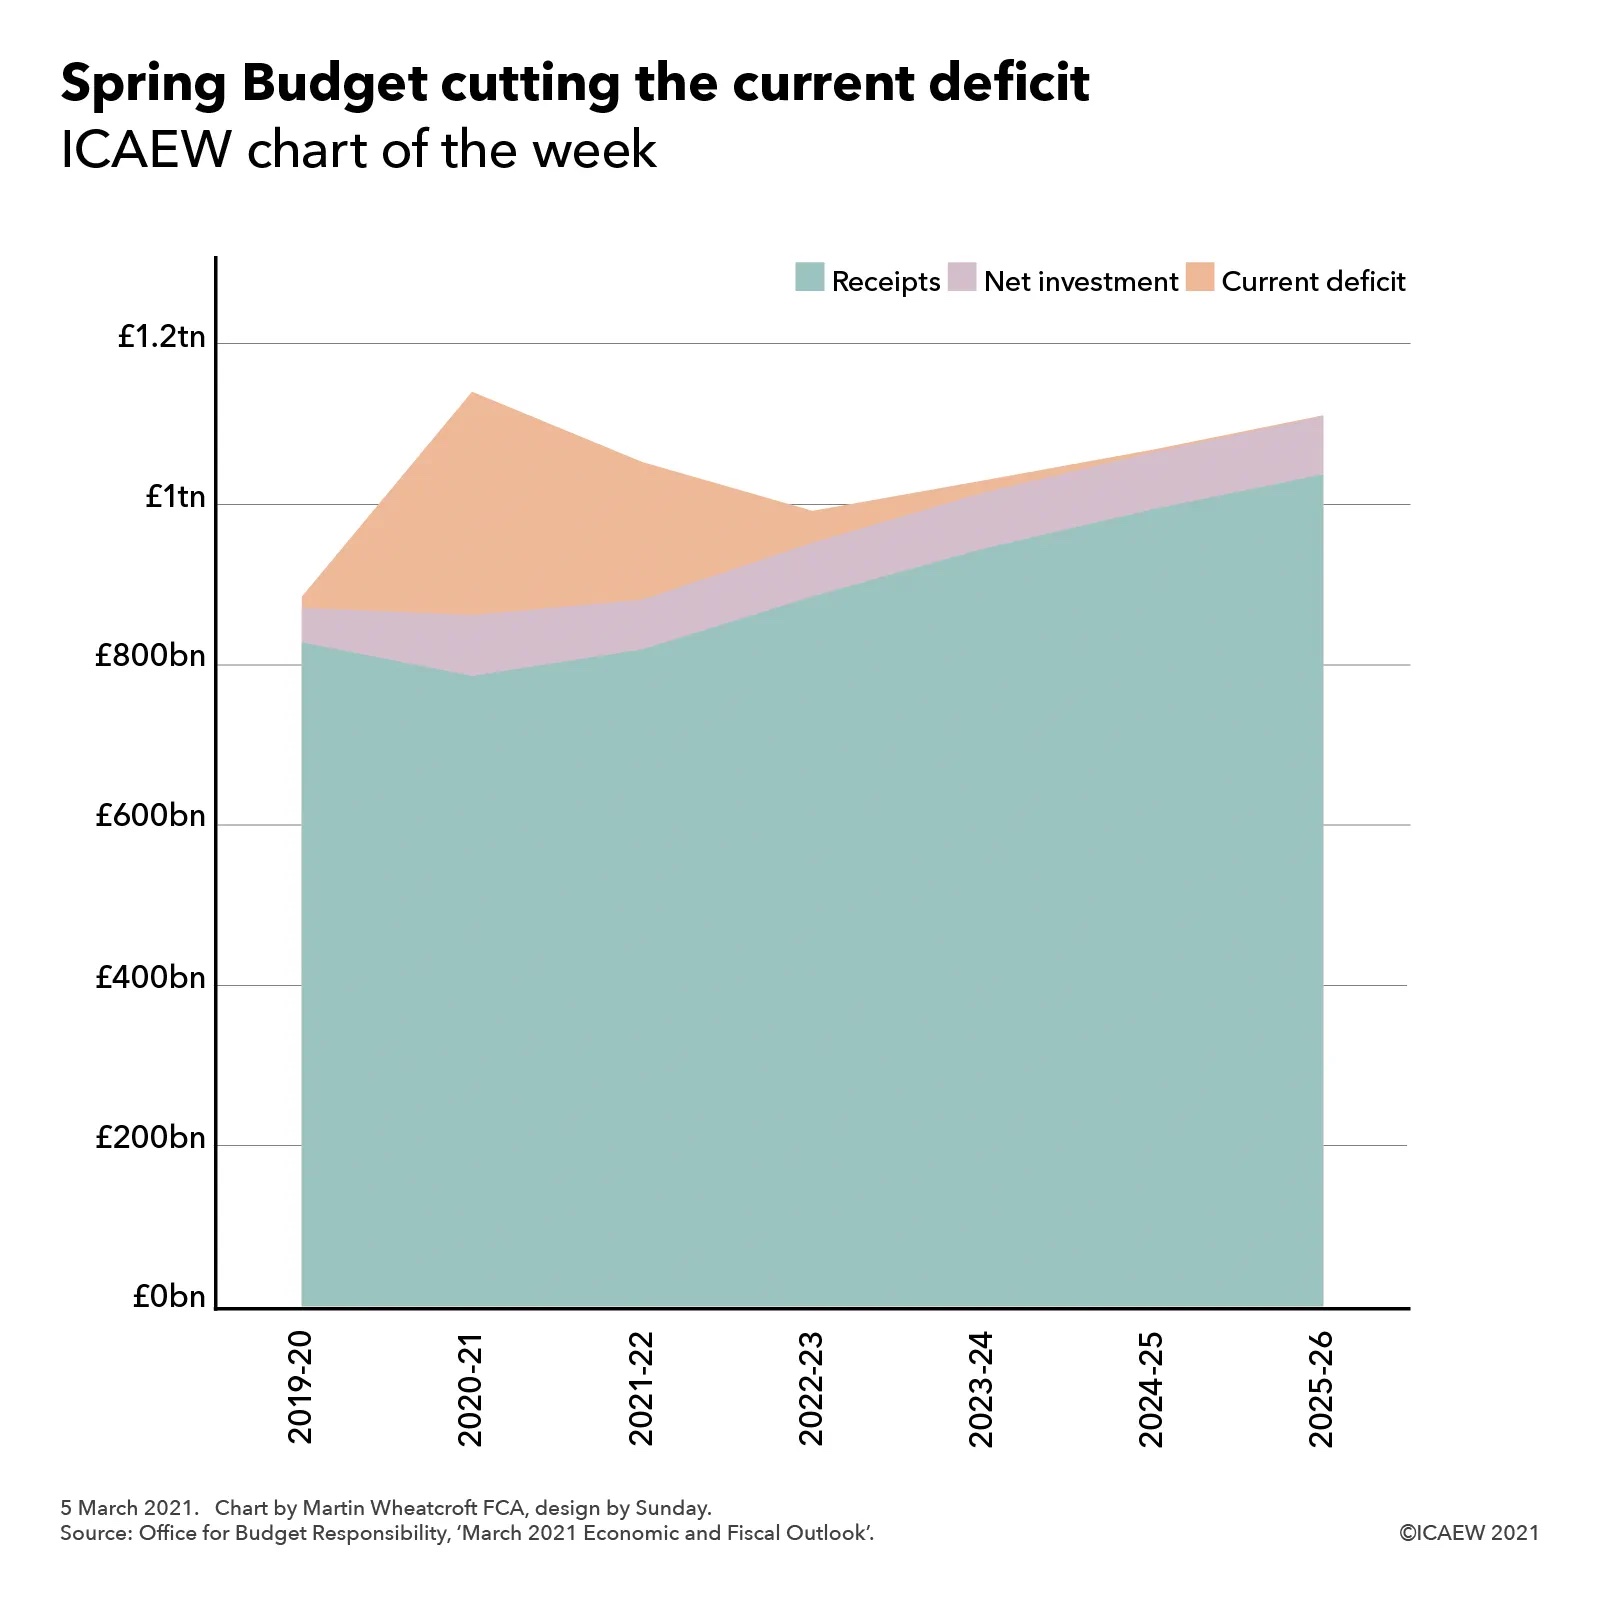
The combination of receipts down 5%, expenditure up 27% and net investment up 25% has resulted in a deficit for the twelve months to March 2021 that is more than five times as much as the budgeted deficit of £55bn for the whole of the 2020-21 financial year set in the Spring Budget in March, despite interest charges being lower by 25%.

The deficit is smaller than the £354.6bn forecast by the Office for Budget Responsibility (OBR) in March as the economy has been less damaged than was feared, despite the extended lockdown during the final quarter of the financial year. However, some of this difference relates to spending that has been deferred into the following financial year, while the provisional numbers also exclude £27bn of bad debts on COVID-related lending that were included in the OBR forecast.

Falls in VAT, corporation tax and income tax receipts and the waiver of business rates were the principal driver of lower tax revenues over the last twelve months, while large-scale fiscal interventions have resulted in much higher levels of expenditure. 

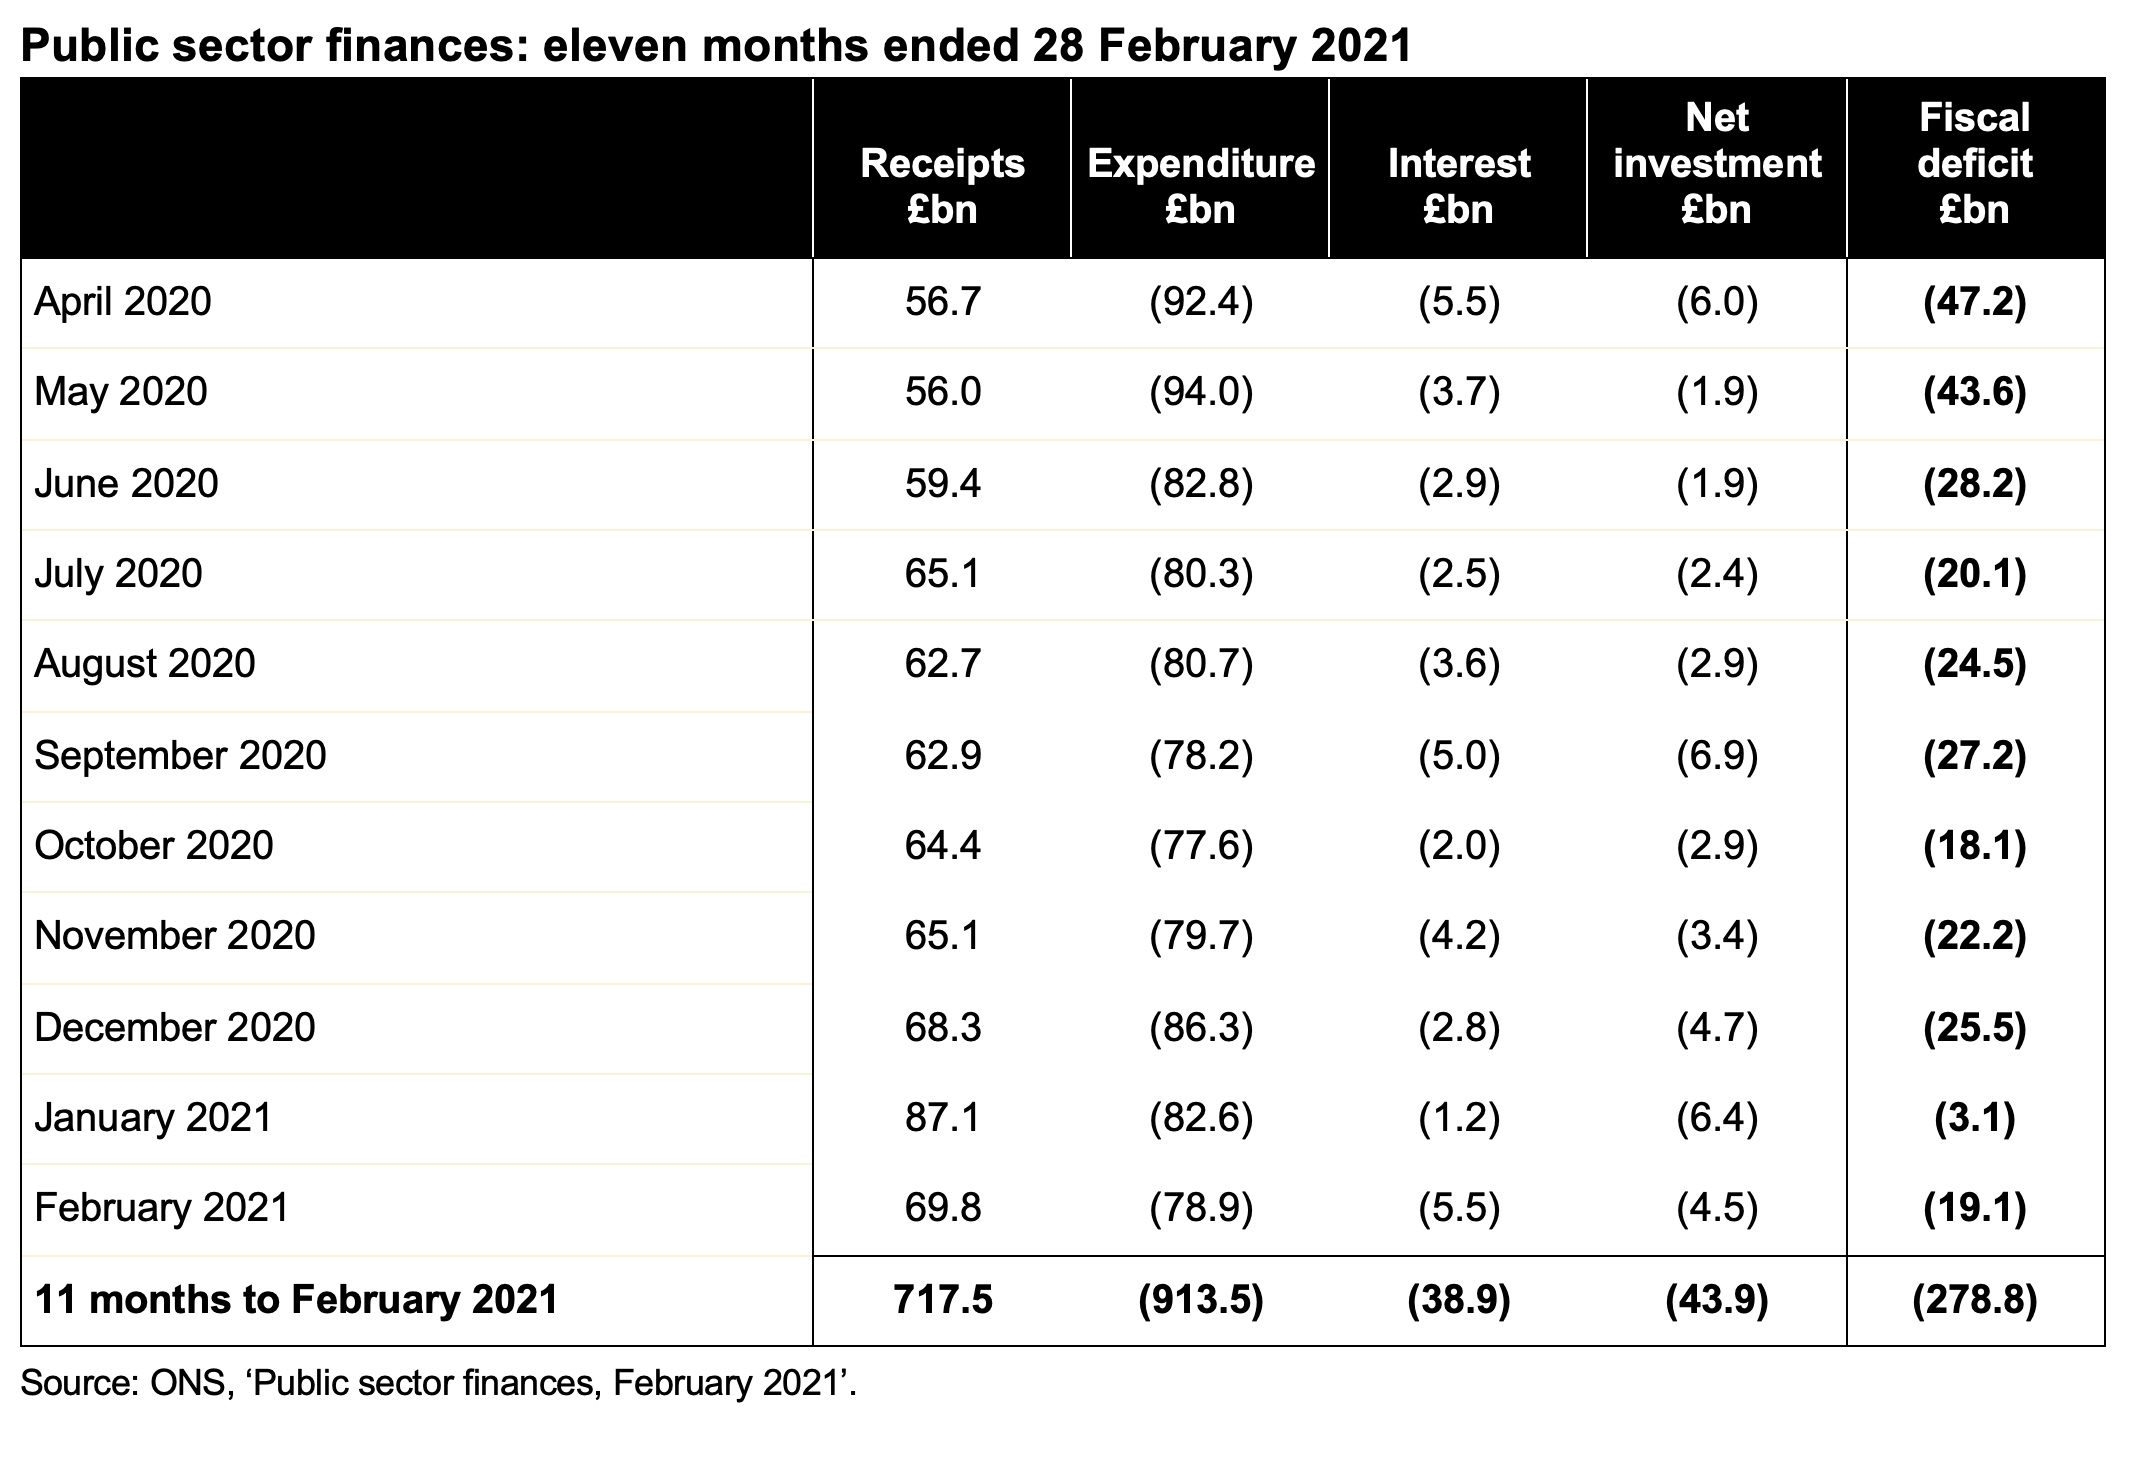
Net investment is greater than last year (mostly as planned), while the interest expense line has benefited from ultra-low interest rates. March 2021 saw a return to the traditional end-of-financial-year rush to get capital budgets spent, with net investment spending of £10.3bn in March contrasting with an average of £4.0bn over the previous eleven months.

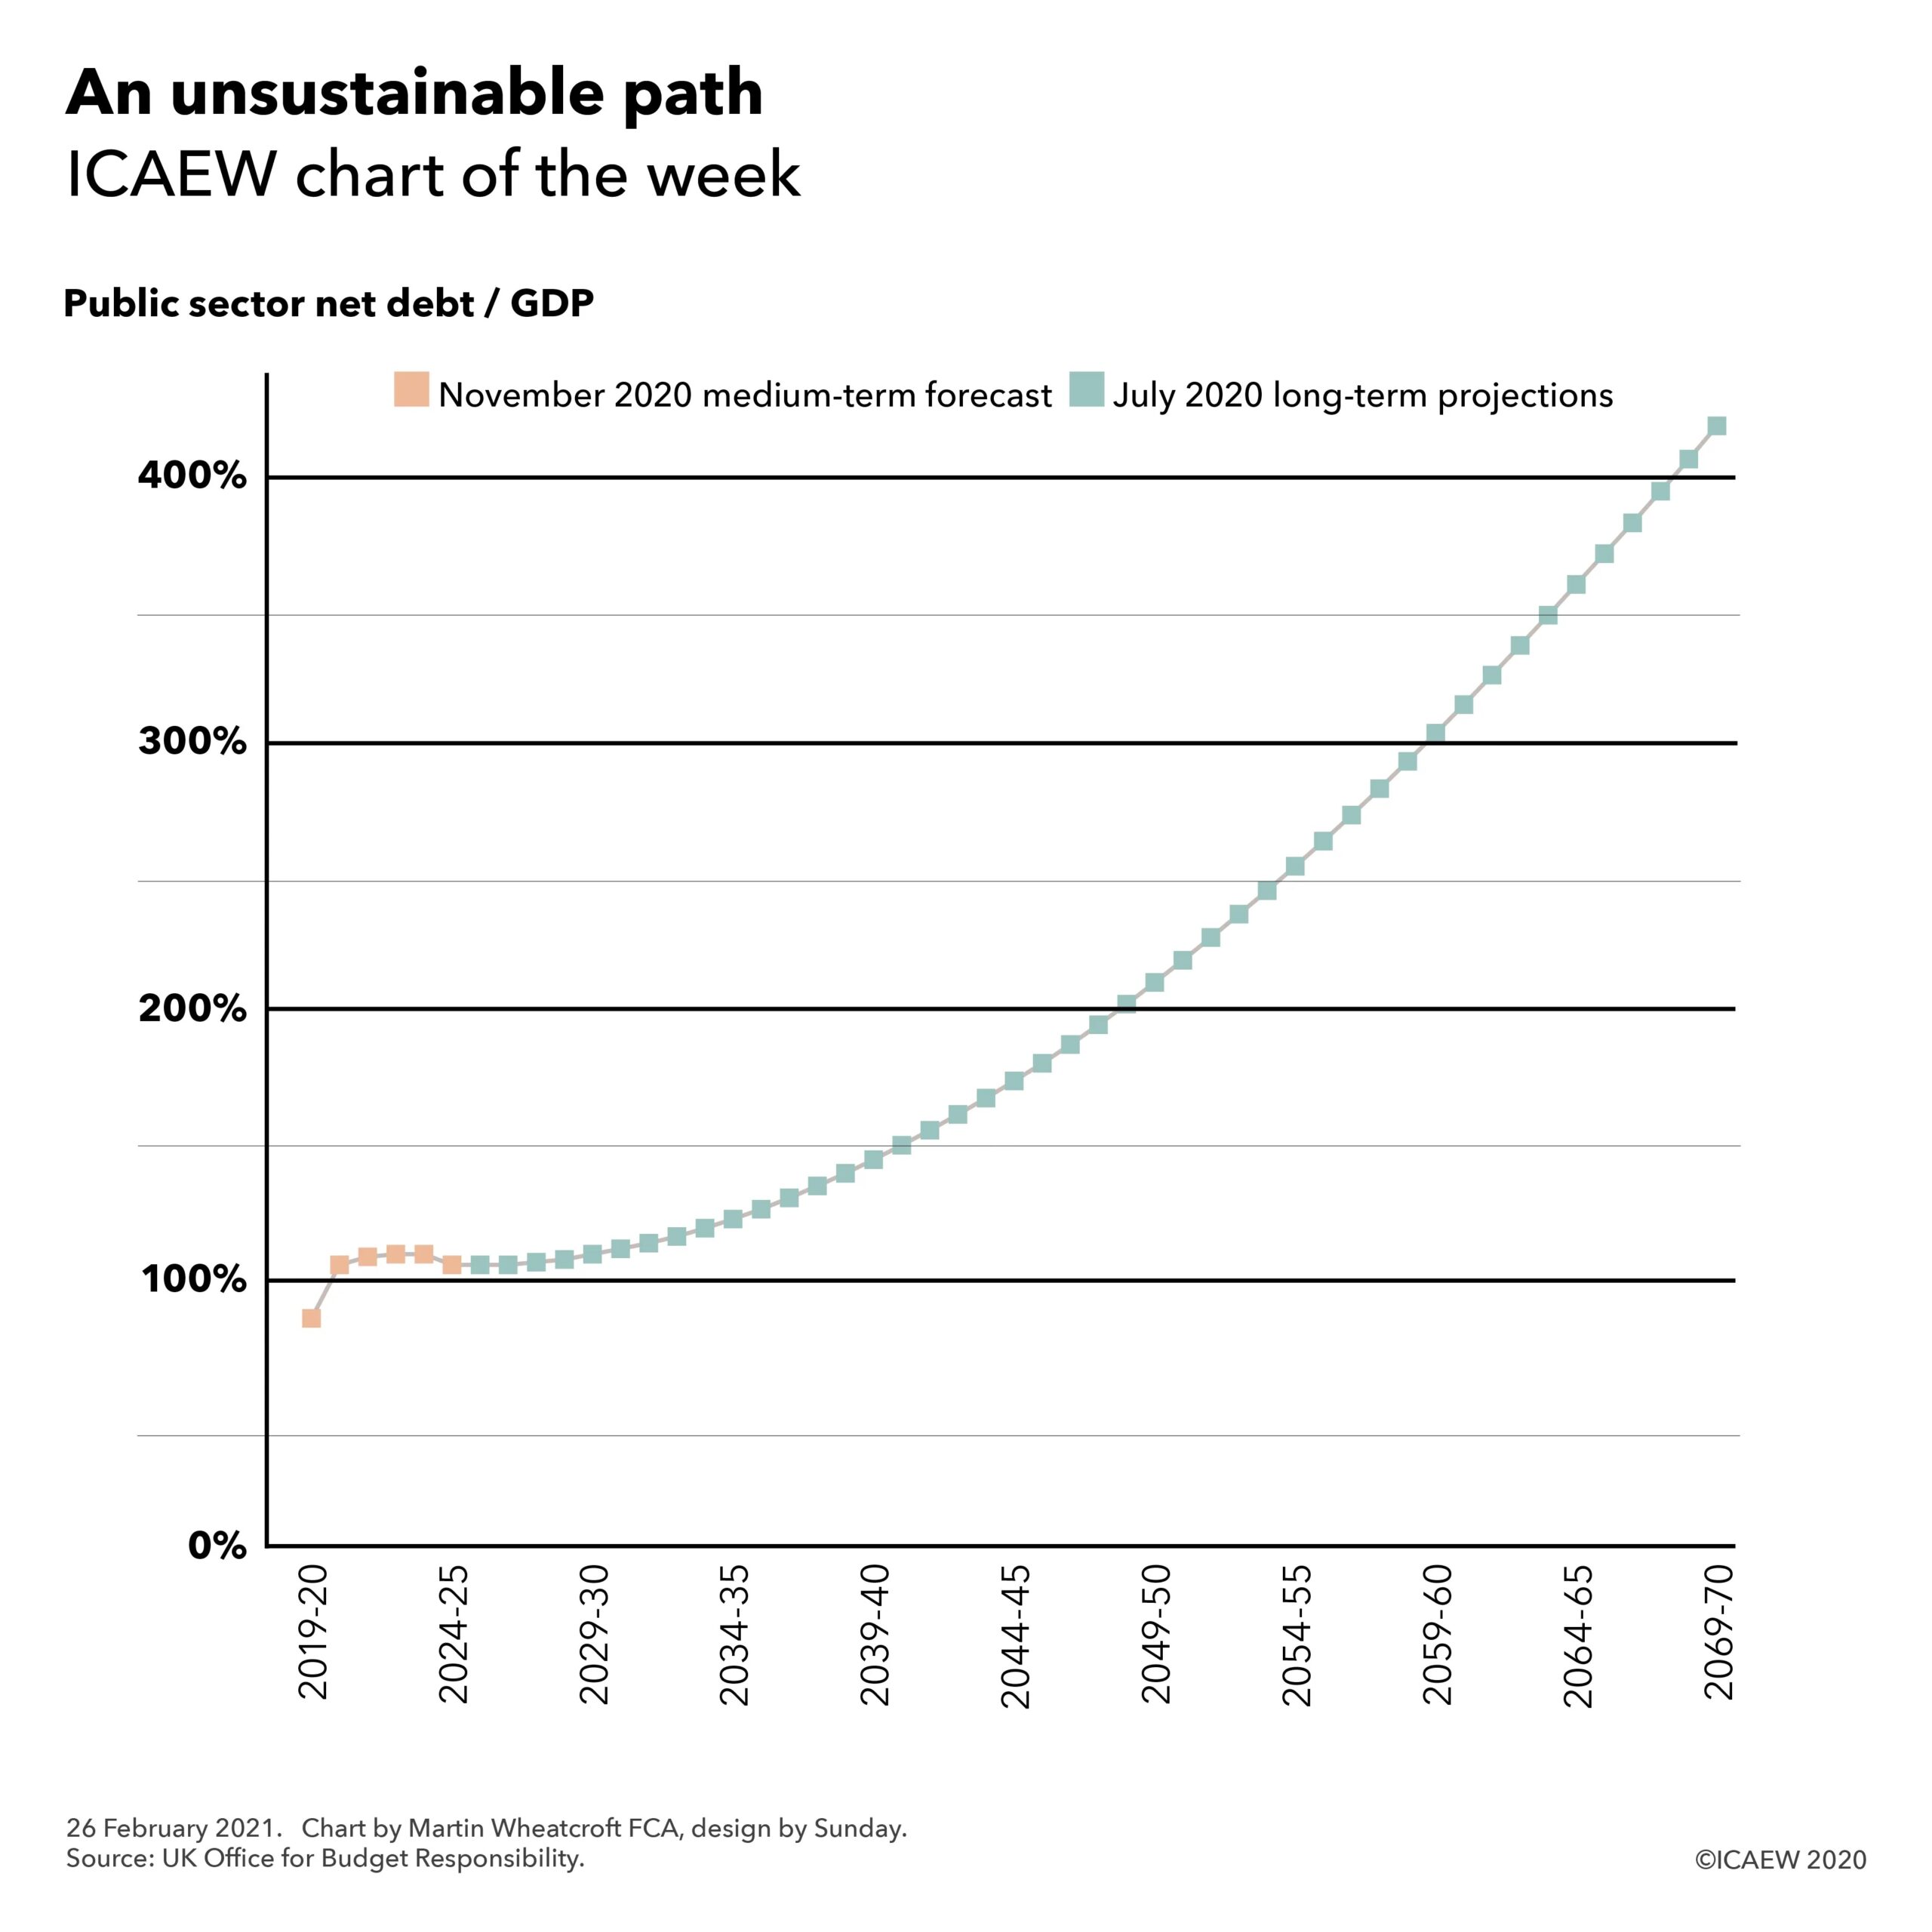
Public sector net debt increased to £2,141.7bn or 97.7% of GDP, an increase of £344.0bn from the start of the financial year. This reflected £40.9bn of additional borrowing over and above the deficit, much of which has been used to fund coronavirus loans to businesses and tax deferral measures. Although net debt was reported as exceeding 100% of GDP at various points during the financial year, slightly improved GDP numbers have kept the ratio below that point.

The cash outflow (the ‘public sector net cash requirement’) for the month was £16.4bn, increasing the cumulative total cash outflow for 2020-21 to £339.0bn. This is a significant increase over the cumulative net cash outflow of £17.2bn reported for 2019-20.

Caution is needed with respect to the numbers published by the ONS, which are expected to be repeatedly revised as estimates are refined and gaps in the underlying data are filled.

The ONS made a number of revisions to prior month and prior year fiscal numbers to reflect revisions to estimates and changes in methodology. These had the effect of reducing the reported fiscal deficit in the first eleven months from £278.8bn to £275.1bn and the reported deficit for 2019-20 from £57.7bn to £57.1bn.

This article was originally published by ICAEW.

Biggest peacetime deficit caps extraordinary year for UK public finances

Huge economic shock combined with unprecedented fiscal interventions results in a provisional fiscal deficit of £303bn or 14.5% of GDP for the year ended 31 March 2021.

The Office for National Statistics today published its first estimate of fiscal history, reporting a provisional fiscal deficit of £303bn or 14.5% of GDP for 2020-21 and a £344bn increase in public sector net debt from £1.8bn to £2.14tn at 31 March 2021, breaking peacetime records for the public finances. This compares with an official forecast for the deficit of £55bn presented by the Chancellor just prior to the start of the financial year last March, admittedly together with the first in a series of mini-fiscal announcements that saw spending soar to tackle the pandemic at the same time as tax revenues collapsed.

The damage is less than had been feared at some points during the past year, with the provisional deficit coming in below the £355bn estimated by the Office for Budget Responsibility (OBR) at the time of the Spring Budget 2021 last month and substantially below their forecast of £394bn in November 2020 at the time of the Spending Review. While some of this is down to better economic performance as lockdowns have been less harmful than anticipated, there has been an offsetting increase in the forecast deficit for the 2021-22 financial year starting this month to £234bn compared with the pre-pandemic projection of £67bn. The provisional deficit of £303bn also excludes somewhere in the region of £27bn for bad debts on covid-related lending that will need to be accounted for at some point.

The deficit is only part of the story, as the government has borrowed significant amounts to finance tax deferrals and lending to business to help them survive. As a consequence, public sector net debt has increased by more than the deficit, with an increase of £344bn to a provisional £2,142bn or 97.7% of GDP at 31 March 2021. Debt is expected to rise over the next couple of years to in excess of £2.5tn.

While the numbers for both the deficit and debt are likely to be revised up or down over the next few months, the big picture won’t change – debt as a proportion of GDP has increased from 35% in March 2008 before the financial crisis to around 80% of GDP a couple of years ago before climbing to in the region of 100% of GDP today. These numbers don’t include other significant liabilities in the government balance sheet such as public sector employee pension obligations, nor do they include future financial commitments such as for welfare benefits. Despite that they still provide an indication of just how significantly the UK’s fiscal position has changed over a period of less than a decade and a half.

Fortunately, interest rates have been coming down even faster than debt has been going up, enabling the Government to reduce its interest bill over the course of the year. However, higher leverage comes with a greater exposure to movements in interest rates going forward, a concern for the Chancellor in mapping out his plans for the next few years.

While the Spring Budget last month provided some indications on how the Chancellor aims to stabilise the public finances through a combination of higher investment spending, short-term economic stimulus and a corporation tax rise, there is as yet no indication of his longer-term fiscal strategy to address the unsustainability of the public finances identified by the OBR before the pandemic.

While the government has been taking steps to set the foundations for better management of the public finances, for example through the National Infrastructure Strategy released last year, the soon to be launched National Data Strategy and actions coming out of HM Treasury’s recent Balance Sheet Review, there is no clear plan for how the government intends to fund pensions, health and social care over the next quarter of a century. These costs will continue to grow as many more people live longer in retirement and the working age population shrinks, just at a time that huge investments are needed to achieve net zero and pressures on public spending are unlikely to disappear. At the same time the government needs to work out how it can ensure the public finances are more resilient and better prepared for future crises – from whatever corner they may come.

Alison Ring, ICAEW Public Sector Director, said: “Today’s numbers cap a dramatic year for the UK’s public finances, and show this is the biggest deficit since the end of World War Two. However, the damage is less than had been feared, with the shortfall lower than the OBR had forecast.

Ultra-low borrowing costs have provided the government with the room it needed to provide unprecedented spending to tackle the coronavirus pandemic, protect jobs and prevent the economy from crashing, as well as the opportunity to invest for growth in the coming years.

However, even as the economy starts to recover, the legacy of higher debt and a greater exposure to changes in interest rates will be with us for years, if not decades to come. The public finances were already on an unsustainable path before the pandemic, and the government will need a long-term strategy for rebuilding them.”

This article was originally published by ICAEW.

ICAEW chart of the week: Canada Budget 2021

Canada Budget 2021

2020-21 Forecast outturn
C$635 (£363bn)

Budget shortfall C$339bn + Taxes and other income C$296bn
Covid-19 C$252bn + Federal spending C$363bn

2021-22 Federal budget
C$498bn (£285bn)

Budget shortfall C$143bn + Taxes and other income C$355bn
Covid-19 C$76bn + Federal spending C$422bn

Monday 19 April 2021 saw Chrystia Freeland, the Canadian deputy prime minister and minister of finance, release her country’s 725-page Budget 2021, setting out the Government of Canada’s plan to “finish the fight against COVID-19 and ensure a robust economic recovery that brings all Canadians along”.

As the #icaewchartoftheweek illustrates, the forecast outturn for the fiscal year ended 31 March 2021 involved spending by the federal government of C$635bn (equivalent to £363bn at an exchange rate of C$1,75:£1), resulting in a budget shortfall of C$339bn after taking taxes and other income of C$296bn into account. Spending comprised C$363bn on ‘normal’ federal government activities – operational spending, welfare payments and transfers to provinces and territories and C$272bn on exceptional measures in response to covid-19.

COVID-19 spending is much lower in 2021-22 at C$76bn, even as other spending increases to C$422bn as the federal government seeks to generate economic growth following the pandemic – total spending of C$498bn (£285bn). Assuming taxes and other income recovers to C$355bn as expected, the budget shortfall should reduce to C$143bn – still much higher than the C$29bn seen before the pandemic in 2019-20.

The federal finances were in a fairly strong position coming into the pandemic compared with many other countries, with debt at 31 March 2020 of C$813bn (31% of GDP) rising to C$1,176bn (49% of GDP) at 31 March 2021 and a forecast C$1,334bn (51% of GDP) at 31 March 2022. This provides Canada with some room for manoeuvre as it navigates its way after the pandemic. 

Fortunately for Canadians, one side-effect of the US government’s stimulus package is that it is expected to not only drive growth in the US economy, but in its Canadian neighbour too.

More (much more) information is available in the Canada Budget 2021.

This chart was originally published by ICAEW.

ICAEW chart of the week: Tax Day

26 March 2021: ICAEW’s chart this week is in honour of Tax Day, the newest fiscal event in the government calendar where reforms of the tax system under consideration are opened up to consultation.

Chart showing components of tax receipts of £732bn in 2021-22 and changes to the £928bn projected in 2025-26.

Numbers for chart elements included in the text below.

The #icaewchartoftheweek starts with the Spring Budget forecast tax receipts of £732bn for the coming financial year from 1 April 2021 and how these are expected to increase to £928bn in 2025-26 through a combination of economic growth, inflation and higher receipts principally from corporation tax, income tax, VAT and business rates. 

The chart illustrates how the ‘big three’: income tax (£198bn in 2021-22), VAT (£151bn) and national insurance (£147bn) together comprise 67.8% of the total tax take, with corporation tax (£40bn), council tax (£40bn), fuel duties (£26bn), business rates (£24bn), alcohol & tobacco duties (£22bn), stamp duty (£12bn) generating a further 22.4%. The next 5 taxes – environmental levies (£10bn), capital gains tax (£9bn), insurance premium tax (£7bn), vehicle excise duties (£7bn) and inheritance tax (£6bn) – generate 5.3%, while all other taxes (£33bn) comprise the balance of 4.5%.

With the Chancellor constrained by a commitment not to raise the main rates of income tax, VAT and national insurance, the principal focus of both the Spring Budget and Tax Day has been on improving the tax take from existing taxes, for example by looking at tax reliefs and tackling tax avoidance, and on raising more money from smaller taxes.

This is reflected in the Office for Budget Responsibility projections for tax receipts that accompanied the Spring Budget, which indicate that receipts from most taxes are expected to rise broadly in line with economic growth (generating £80bn in higher tax receipts) and inflation (£46bn) between 2021-22 and 2056-26. This reflects anticipated economic recovery from the pandemic as well as a boost from stimulus measures announced by the Chancellor in addition to existing plans to increase public investment.

The biggest incremental change is an expected increase in corporation tax receipts of £38bn over and above economic growth and inflation. Some of this rise is recovery to a more normal level, as businesses will be able to reduce their tax bills in the coming year by offsetting losses incurred during the pandemic and using the temporary ‘super deduction’ of 130% of qualifying capital expenditure, but the principal driver is an increase in the corporation tax rate on larger businesses from 19% to 25% in 2023.

The next highest increases are from income tax (+£16bn) and VAT (+£9bn) where a combination of fiscal drag from freezing tax allowances (income tax) and registration thresholds (VAT) will bring more transactions into the scope of both taxes and hence generate more revenue. Both taxes are also the focus of efforts to make taxes easier to pay and to tackle tax avoidance as addressed in several of the Tax Day consultations. 

The other significant increase is in business rates (+£7bn), although this mostly reflects pandemic related reliefs in the coming financial year that are not expected to continue into subsequent financial years. In practice, there are some questions as to whether this increase will be deliverable, with the Tax Day consultation on business rates suggesting that levels are too high and a reduction could help bricks and mortar businesses survive against online competition and so ‘save the high street’. The dilemma for the Chancellor is that if he were to cut business rates as some hope, then what tax lever he would need to pull to make up for that lost revenue?

Much of the focus of this first Tax Day has been on the efficiency and effectiveness of the tax system and how it can be made to work better. Perhaps future Tax Days will tackle some of the bigger questions surrounding the role of taxation in the long-term sustainability and resilience of the public finances – and whether some bigger tax levers might need to be pulled at some point in the future?

This chart was originally published by ICAEW.

Fiscal deficit on course to exceed £300bn in 2020-21

The UK reported a £19.1bn fiscal deficit in February 2021, bringing the total shortfall over eleven months to £278.8bn. Public sector net debt is up by £333.0bn at £2.13tn.

The latest public sector finances released on Friday 19 March reported a deficit of £19.1bn for February 2021, as COVID-related spending continued to weigh on the public finances. This brought the cumulative deficit for the first eleven months of the financial year to £278.8bn, £228.2bn more than the £50.6bn reported for the same period last year.

The reported deficit for the eleven months excludes £27.2bn in potential business loan write-offs that the Office for Budget Responsibility (OBR) has included in its forecast deficit of £354.6bn for the full financial year.

Falls in VAT, corporation tax and income tax receipts and the waiver of business rates were the principal driver of lower tax revenues over the last eleven months, while large-scale fiscal interventions have resulted in much higher levels of expenditure. Net investment is greater than last year (mostly as planned), while the interest line has benefited from ultra-low interest rates.

Public sector net debt increased to £2,131.2bn or 97.5% of GDP, an increase of £333.0bn from the start of the financial year and £347.2bn higher than in February 2020. This reflects £54.2bn of additional borrowing over and above the deficit, much of which has been used to fund coronavirus loans to businesses and tax deferral measures.

The cash outflow (the ‘public sector net cash requirement’) for the month was £11.4bn, increasing the cumulative total cash outflow this financial year to £322.3bn. This is a significant swing from the cumulative net cash inflow of £10.9bn reported for the equivalent eleven-month period in 2019-20.

The combination of receipts down 5%, expenditure up 27% and net investment up 21% has resulted in a deficit for the eleven months to February 2021 that is around five times as much as the budgeted deficit of £55bn for the whole of the 2020-21 financial year set in the Spring Budget in March, despite interest charges being lower by 27%.

Alison Ring, ICAEW Public Sector Director said: “Today’s numbers are in line with expectations, with the deficit for the past 11 months reaching £278.8bn. This means we are on track for public sector net borrowing to exceed £300bn for the full year once a potential £27bn in bad debts that have not yet been recorded are factored in.

“Our eyes are now focused on what possible tax measures, in addition to the planned corporation tax rise, the government might use to start rebuilding the public finances.”

Table: public sector finances month ended 28 February 2021. Analyses deficit of £19.1bn for month and variances from same month last year.

Click on link at the end of the post to ICAEW article for a readable version of the table.
Table: public sector finances 11 months ended 28 February 2021. Analyses deficit of £278.8bn and change in net debt of £333.03bn and variances from same period last year, together with net debt of £2,131.2bn or 97.5% of GDP.

Click on link at the end of the post to ICAEW article for a readable version of the table.
Table: month by month analysis of receipts, expenditure, interest, net investment and the fiscal deficit for the 11 months to 28 February 2021.
 
Click on link at the end of the post to ICAEW article for a readable version of the table.
Table: month by month analysis of receipts, expenditure, interest, net investment and the fiscal deficit for the prior year.
 
Click on link at the end of the post to ICAEW article for a readable version of the table.

Caution is needed with respect to the numbers published by the ONS, which are expected to be repeatedly revised as estimates are refined and gaps in the underlying data are filled.

The ONS made a number of revisions to prior month and prior year fiscal numbers to reflect revisions to estimates and changes in methodology. These had the effect of reducing the reported fiscal deficit in the first ten months from £270.6bn to £259.7bn and increasing the reported deficit for 2019-20 from £57.1bn to £57.7bn.

This article was originally published by ICAEW.

ICAEW chart of the week: Debt to GDP ratio

12 March 2021: This week’s chart illustrates how an expected increase of £1tn of additional public debt between 2020 and 2026 translates into the debt to GDP ratio.

Chart showing public sector net debt increased from £1,798bn (84.4% of GDP) at March 2020 to £2,747bn (109.7%) at March 2024 and £2,804bn (103.8%0 at March 2026.

This week’s #icaewchartoftheweek illustrates how a trillion pounds of extra public debt translates into the debt to GDP ratio. This rises from 84.4% last March to a forecast peak of 109.7% in 2024 before falling to 103.8% in 2026, according to the medium-term economic and fiscal forecasts from the Office for Budget Responsibility (OBR) that accompanied the Spring Budget. These forecast a rise in public sector net debt from £1.8tn at 31 March 2020 to £2.8tn at 31 March 2026.

Most of the additional borrowing is expected to occur in the period to March 2024, with £781bn (equivalent to 35.2% of a year’s GDP) borrowed to fund four years of deficits – an estimated £355bn (16.9% of GDP) in the current financial year and forecast deficits of £234bn (10.3% of GDP), £107bn (4.5% of GDP) and £85bn (3.5% of GDP) in 2021-22 through 2023-24 respectively. A further £168bn (7.5% of GDP) is needed over that same period to fund lending and working capital requirements.

Despite borrowing the equivalent of 42.7% of GDP, the debt to GDP ratio is expected to increase by a smaller amount – 25.3% of GDP from 84.4% at 31 March 2020 to 109.7% of GDP at 31 March 2024. This reflects an increase in the denominator for GDP, as a combination of inflation and economic growth ‘inflate away’ the debt by the equivalent of 17.4% over four years. This effect appears quite large, given the annualised growth of 0.7% a year forecast over the four years (comprising a 12% fall during the current financial year followed by growth of 10% in the coming financial year, 5% in 2022-23 and 1.5% in 2023-24) and an average GDP deflator inflation rate of 1.8%, but the magic of compounding, combined with timing differences in the value for GDP used in the calculation all multiply up.

The following two years see the forecast debt to GDP ratio decline to 103.8%. Debt is only expected to increase by £57bn (or 2.2% of GDP) over these two years because lending to businesses during the pandemic is expected to be repaid, reducing the £148bn (5.7% of GDP) needed to fund deficits of £74bn (2.9% of GDP) in 2024-25 and £74bn (2.8% of GDP) in 2025-26 by a net cash inflow of £91bn (3.5% of GDP). As a consequence, the debt to GDP ratio is forecast to drop by 5.9% overall once 8.1% of ‘inflating away’ is taken into account.

As with all forecasts, the reality will be different. A stronger economic recovery would both reduce the need for borrowing and increase the size of GDP at the same time, accelerating the decline in the debt to GDP ratio. A weaker recovery combined with higher spending in response to pressures on public services and/or higher interest rates might do the reverse. Either way, the debt to GDP is likely to remain at a significantly higher level than the pre-financial crisis 34% seen in 2008 for many years, if not decades, to come.

This chart was originally published by ICAEW.

ICAEW chart of the week: Spring Budget cutting the current deficit

5 March 2021: The Budget provides the basis for this week’s chart, which illustrates government plans to achieve a current budget surplus to meet a new fiscal rule that hasn’t yet been formally announced but was hinted at.

Chart showing receipts, net investment and the current deficit from 2019-20 to 2025-26, showing very large current deficit in 2020-21 falling to almost zero by 2025-26.

The Chancellor will use a corporation tax rise and spending cuts to cut the current deficit over the next five years, but this relies on the economy recovering as expected and being able to restrain pressures on public spending.

The current deficit – the difference between receipts and expenditure excluding net investment – is expected to go from £14bn in 2019-20 to £279bn in the current financial year before falling to £172bn in 2021-22, £40bn in 2022-23, £15bn in 2023-24, £3bn in 2024-25 and just under £1bn in 2025-26 – almost, but not quite meeting the anticipated fiscal rule hinted at by Rishi Sunak in his Budget speech.

This will only be achievable if the pandemic can be brought under control so that support measures are no longer needed, in addition to depending on the strength of the economic recovery. The government will be hoping that the economic stimulus it plans to provide over the next two years will help drive that growth, with the hope of higher corporate profits to pay a higher rate of corporation tax over the rest of the period.

Despite the uncertainties around the numbers, the Chancellor felt it necessary to trim £4bn a year from public spending to get within touching distance of meeting his non-target – signalling his commitment to ‘fiscal responsibility’ and helping to achieve his other main non-target, which is to see the debt to GDP ratio start to fall after peaking at 110% of GDP in 2024. However, a number of commentators have suggested that this appears unlikely to be achievable, given both pre-existing pressures on public spending and a likely need to provide additional post-pandemic support to the NHS, social care and education in particular.

This provides a challenging context for the three-year Comprehensive Spending Review later this year, especially as the longer-term challenges facing the public finances remain unaddressed. In the nearer term though, the Chancellor will be hoping for a bigger bounce back to the economy over the summer to provide him with more room for manoeuvre in the autumn.

This chart was originally published by ICAEW.

ICAEW chart of the week: an unsustainable path

26 February 2021: The Chancellor needs to build a bridge to economic recovery in his first Budget on Wednesday, focusing on jobs, exports and investment. But with the OBR’s official projections showing public debt to be on an unsustainable path, what vision will he set out for the public finances in the long-term?

The Spring Budget announcement on Wednesday will primarily be about the government’s fiscal budget for the financial year commencing 1 April 2021. The UK is still in the midst of a major health emergency and in a difficult economic situation, and the announcement is likely to provide for an extension of support measures for businesses and individuals affected by the pandemic, funding for under-pressure public services and stimulus measures to drive economic growth once restrictions are lifted, particularly in the second half of the financial year. 

In the absence of a formal fiscal strategy event in the Parliamentary calendar, the Budget is also the main forum the Chancellor has to discuss the medium and long-term prospects for the public finances. This includes considering the five-year fiscal forecasts prepared by the Office for Budget Responsibility (OBR), as well as setting out any medium-term fiscal rules the government might want to use in determining its tax and spending plans and in demonstrating financial credibility with debt investors and citizens.

What is often less discussed is the long-term path for the public finances, which – as the #icaewchartoftheweek illustrates – is on an unsustainable path according to the official 50-year fiscal projections prepared by the OBR last July.

These projections indicate that, in the absence of government action, public debt will rise steadily over the next fifty years as public spending grows in line with anticipated demand, and increasing amounts of borrowing will be needed to cover the shortfall between that spending and the amount collected in taxes. It is important to understand that these projections were already on this path before the pandemic arrived and the principal difference between the OBR’s 2020 and 2018 projections is that the initial level of debt has increased from in the order of 80% to just over 100% of GDP. The starting point may be higher, but the fundamental issues haven’t changed.

This financial backdrop permeates every Budget and is the reason the Chancellor finds himself constrained in the choices he can make, despite ultra-low interest rates that currently permit him to borrow huge sums for one-off expenditures at almost no cost. He doesn’t have the same freedom when it comes to permanent increases in spending, whether that be on health, social care, welfare, education, defence or other public services, especially if he wants to minimise the scale of any potential tax increases. Of course, higher economic growth would help – but as successive Chancellors have found that is not so easy to deliver.

So while much of the focus on the Budget on Wednesday will be on the short-term extension of the life support package for individuals and businesses while restrictions remain in place and the economic stimulus thereafter, the Chancellor’s words will also be scrutinised for his vision on the direction of travel for the public finances beyond the end of the next financial year.

This chart was originally published by ICAEW.

ICAEW chart of the week: US federal budget baseline projections

19 February 2021: Congressional Budget Office expects a decade of trillion-dollar deficits as the US public finances are hit by the pandemic.

The US Congressional Budget Office (CBO) recently updated its ten-year fiscal projections for the federal budget, providing the subject for this week’s #icaewchartoftheweek. 

As the chart illustrates, there was a shortfall of $3.1tn between revenues and spending by the federal government in the year ended 30 September 2020, with a projected deficit of $2.3tn in the current financial year and deficits ranging from $0.9tn to $1.9tn over the coming decade.

The CBO is at pains to stress that its projections are not a forecast of what will happen but instead, provide a baseline against which decisions can be assessed. This is particularly relevant at the moment as Congress debates a potential $1.9tn stimulus plan that would increase this year’s deficit significantly if passed.

On the path shown in the projections, the CBO calculates that debt held by the public will increase from $21.0tn (100% of GDP) in 2020 up to $35.3tn (107% of GDP) by 2031. Will policymakers in the US be comfortable in continuing to run with such a high level of debt compared with pre-pandemic levels of around 80% of GDP and a pre-financial crisis level of less than 40%?

The projections are based on assumed economic growth excluding inflation of 4.6% in the current financial year following on from a fall of 3.5% last year, with the recovery continuing into 2022 with growth of 2.9%. Economic growth over the following nine years to 2031 is expected to average around 1.9%. This is much lower than the average rate of growth experienced before the financial crisis just over a decade ago but may still prove optimistic given the potential for a recession at some point over the next ten years.

The UK counterpart to the CBO – the Office for Budget Responsibility (OBR) – is currently working its abacus quite hard on updating its five-year projections ready for the Budget on 3 March. The OBR’s projections will be extremely useful in understanding the near-term path in the UK’s public finances, including the effect of any tax and spending announcements that may be featured in the Budget. Unfortunately, they will be less useful than the CBO’s projections in that they are not expected to provide a refreshed baseline for the second half of the decade when the hard work of starting to repair the public finances is expected to take place.

This chart was originally published by ICAEW.

ICAEW chart of the week: Japan Budget 2021-22

5 February 2021: This week’s chart focuses on the Japanese economy as it seeks to return to relative fiscal normality in the year commencing 1 April 2021, following multiple supplementary budgets in its current financial year.

The #icaewchartoftheweek is full of anticipation for the UK Budget next month and so decided to take a look at how the Japanese central government plans to borrow ¥28.9tn (£205bn) in the year to 31 March 2022. Together with taxes and other income of ¥63.0tn (£450bn), this will be used to fund ¥86.9tn (£620bn) of spending and a ¥5.0tn (£35bn) COVID-19 contingency.

This follows a significant amount of borrowing in the current financial year, with the 2020-21 Budget amended by three supplementary Budgets in response to the coronavirus pandemic. If temporary and special measures are excluded, the 2021-22 Budget reflects a 0.7% increase in spending over the previous year’s ¥86.3tn (£615bn) pre-COVID budget.

Spending comprises ¥35.8tn (£255bn) on social security, central government spending of ¥26.1tn (£185bn), and other spending of ¥16.5tn (£120bn), with the latter principally relating to transfers and grants to local government. Interest of ¥8.5tn (£60bn) is only marginally higher than the previous year’s ¥8.3tn, despite a 9% increase in the level of government bonds outstanding to ¥990tn (£7tn) – equivalent to 177% of GDP – at March 2022.

Borrowing has increased over pre-pandemic levels, with net borrowing of ¥28.9tn (£205bn) in 2021-22 compared with the 2020-21 pre-pandemic budget of ¥18.0tn (£130bn, not shown in the chart). This is principally driven by a 10% decline in anticipated income, with taxes and other income of ¥63.0tn (£450bn) falling from the ¥70.1tn (£500bn) originally budgeted for the current year (but not actually received).

The chart does not include the substantial amounts of taxation raised and spent by its 47 regional prefectures and so does not provide a complete fiscal picture for Japan. However, it does provide an indication of how the Japanese public finances have been able to respond to the pandemic.

The Japanese government will be hoping that there will be no need for supplementary Budgets in the coming financial year, as no doubt will UK Chancellor Rishi Sunak as he prepares for his government’s Budget on 3 March.

This chart was originally published by ICAEW.