Our chart this week is on public sector employment, the cost of which is one of the largest components of the Spending Review in a few weeks’ time.
One of the key drivers for any budget or business plan is the number of full-time equivalent employees (FTEs) and it is no different in the public sector, where staff costs in the order of £150bn constitute just under 40% of departmental resource budgets of £385bn in 2021-22 (excluding depreciation and COVID-related spending).
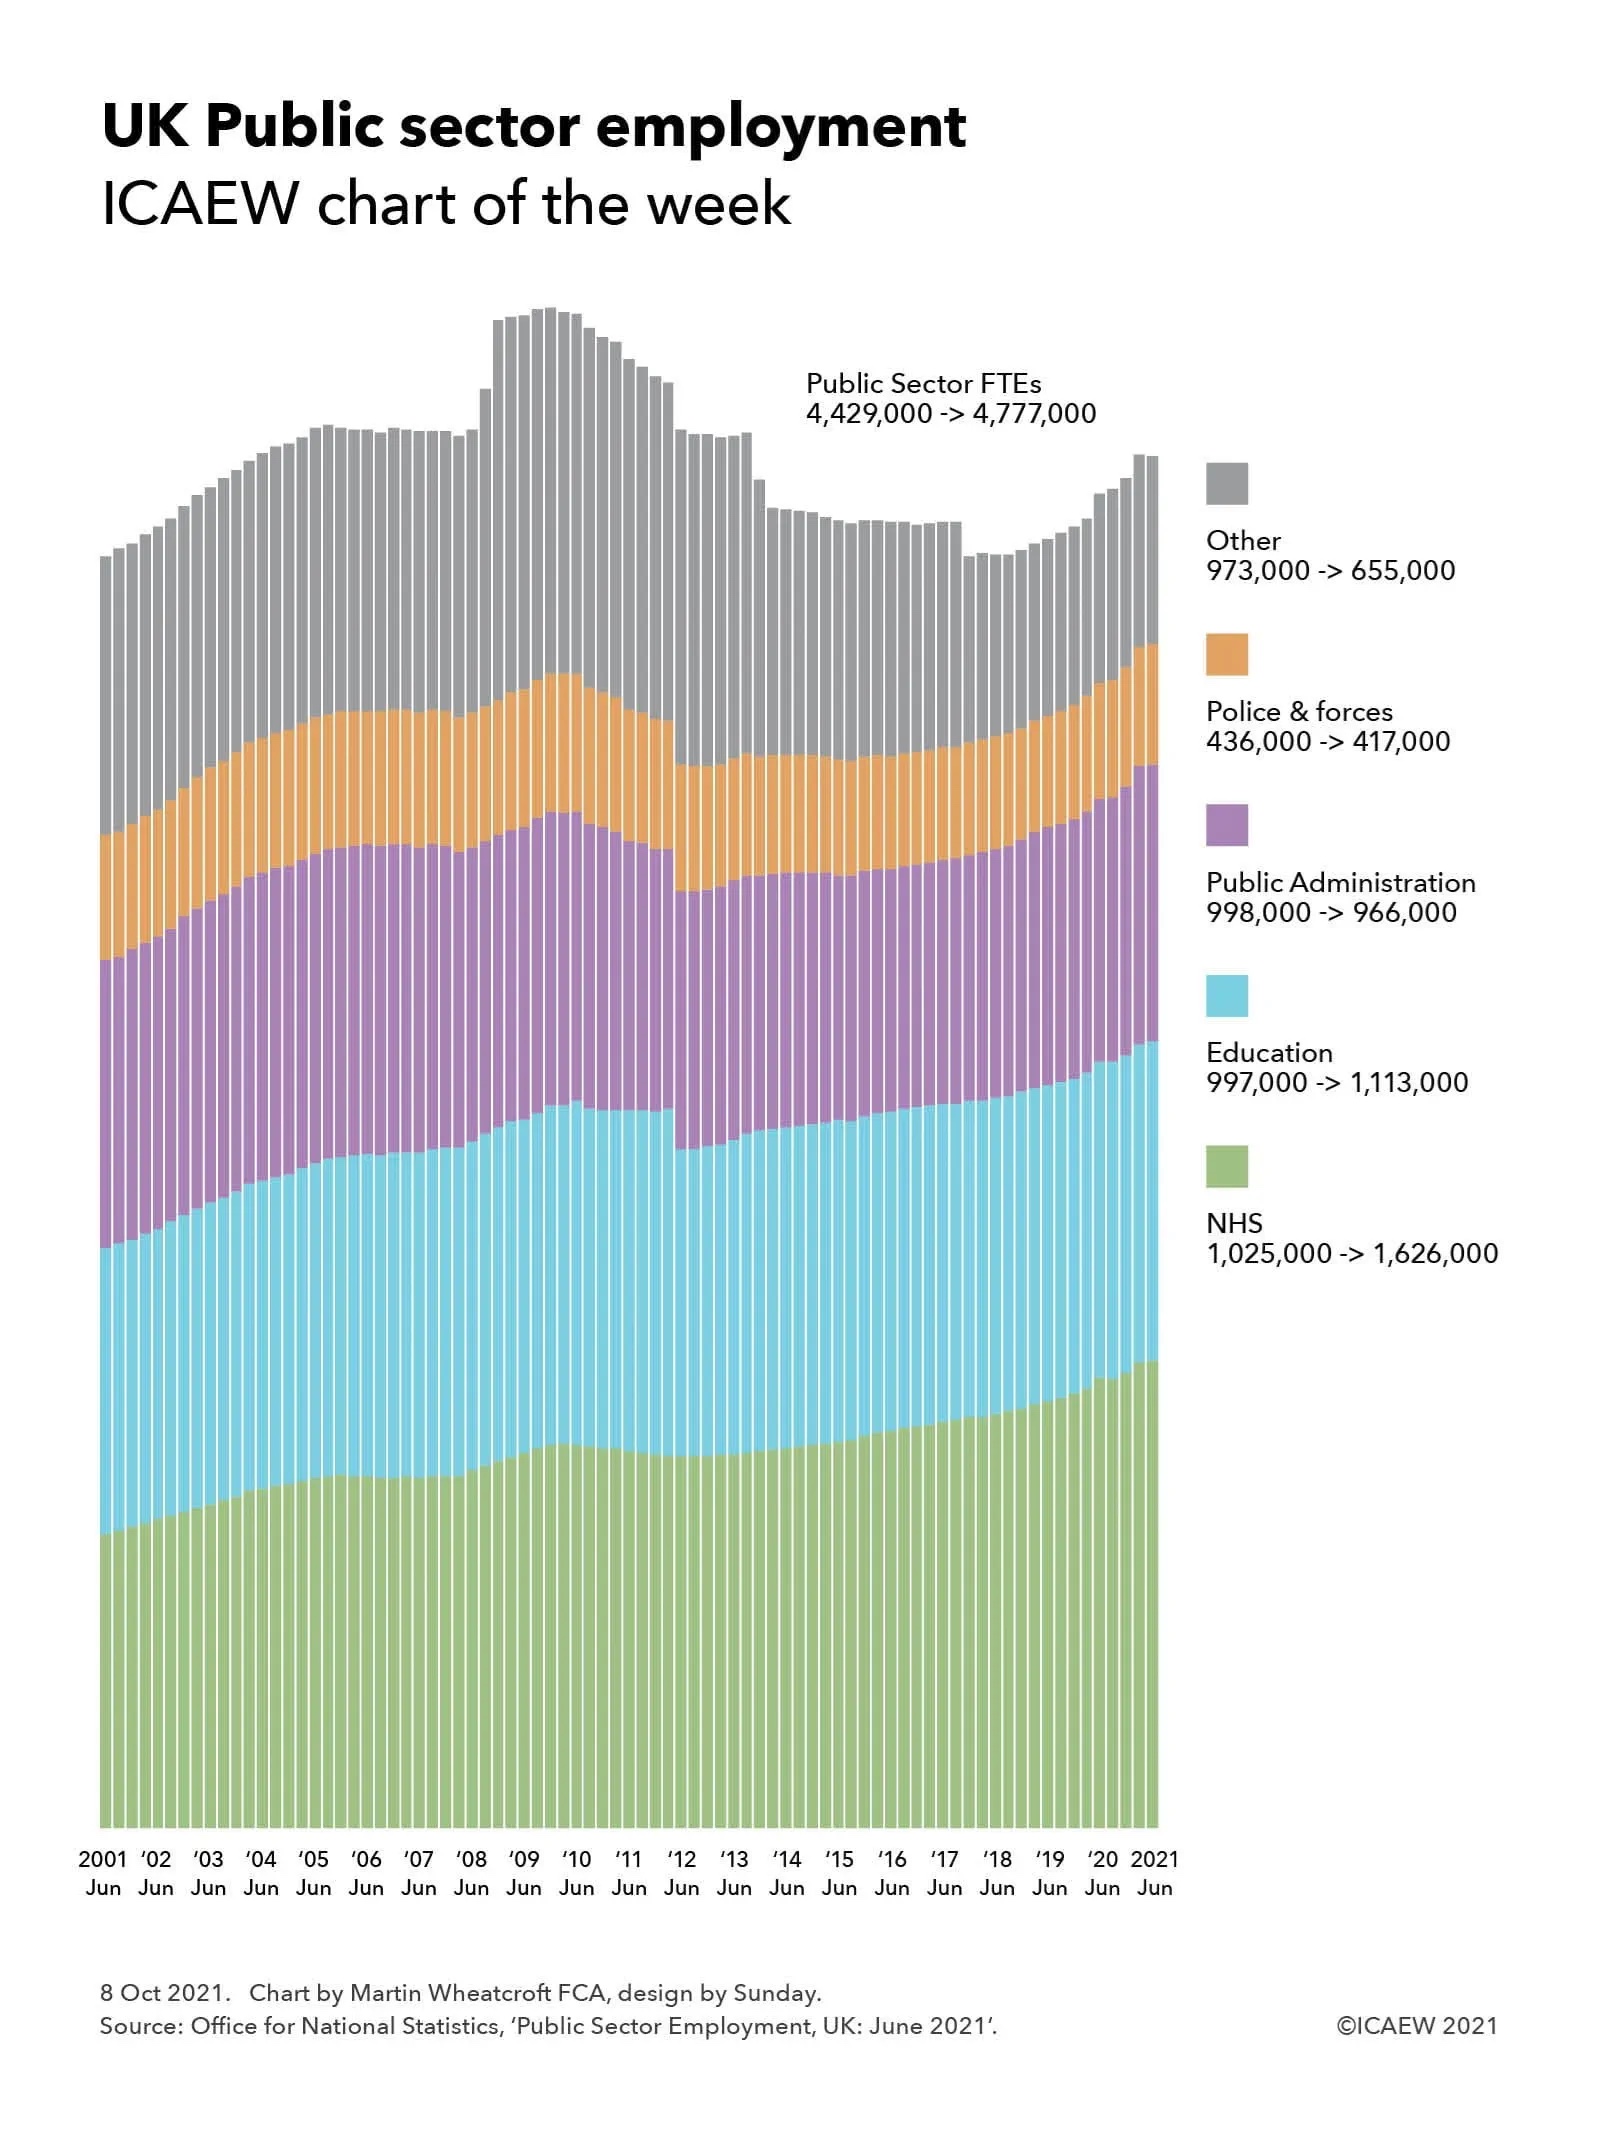
The chart illustrates how public sector employment has grown, fallen and grown again over the last 20 years. It starts with the largest employer in the country – the NHS – where the workforce has increased from 1,025,000 FTEs in June 2001 to 1,626,000 FTEs in 2021. This 59% increase in staffing is substantially greater than the 14% increase in the size of the UK population from 59m to 67m over the same period, reflecting how the combination of more people living longer but less healthy lives and more successful treatments for cancer (for example) have resulted in substantially more for the NHS and its workforce to do.
Education FTEs are up 16% from 997,000 twenty years ago to 1,113,000 this year, is more in line with the growth in the size of the population, although most of the increase happened before the financial crisis, with FTEs working in education still below the peak of 1,210,000 in March 2012.
Public administration is down from 20 years ago, with 966,000 FTEs in June 2021 compared with 998,000 two decades previously. FTEs increased to a peak of 1,081,000 in June 2005 before falling gradually to 1,010,000 in June 2010, followed by more significant falls following the financial crisis. Most of the net fall represents fewer public servants in local government since the financial crisis , with civil servants in central government only slightly below where they were 20 years ago at 465,000 FTEs in June 2021 compared with 492,000 in June 2001. The total would have been much lower but for a post-Brexit surge in the size of the civil service, which has grown by 20% from its nadir of 384,000 FTEs in June 2016.
Police and armed forces FTEs have fallen from 436,000 in June 2001 to 417,000 in June 2021, mainly due to a steady decline in the armed forces from 219,000 to 159,000 FTEs over that period. Police numbers (including civilian support staff) increased from 222,000 FTEs 20 years ago to a peak of 284,000 in September 2009, fell to 235,000 FTEs in December 2016, and then started to increase again over the course of the last two years to reach 258,000.
Other public sector workers, including community health and social workers and employees of public corporations such as the BBC, Channel 4, Crossrail and Ordnance Survey have fallen from 973,000 to 655,000 FTEs, having reached a peak of 1,322,000 in March 2008 following the nationalisation of a number of banks. Most of the fall since then is a consequence of transfers to the public sector, including housing associations, Royal Mail, Direct Line, Lloyds Banking Group and Northern Rock.
Overall, public sector employment grew from 4,429,000 FTEs in June 2001 to a peak of 5,292,000 FTEs in December 2009 before falling to 4,777,000 FTEs in June 2021, comprising net changes of +601,000 in the NHS, +116,000 in Education, -32,000 in public administration, -19,000 in the police and armed forces and -318,000 in other public sector employees.
Of course, staff numbers are only part of the equation as the 4,777,000 FTEs currently employed have to be multiplied by an average salary of around £34,000 a year to reach the more than £160bn estimate for total staff costs across the public sector. This is the average of total pay – the median full-time salary is lower than this at somewhere in the region of £26,000.
Pay is one of the key drivers, with a pay freeze for many public sector workers announced last year helping to constrain the growth in the wage bill. With the cost of living on the march upwards, it seems unlikely that the Chancellor will be able to justify as strict a pay freeze this year, although he will still be looking to constrain wage settlements as much as possible. Wage settlements in the private sector are also likely to be higher this year, another worry for the Treasury given the £230bn or so the public sector spends every year on external procurement.
The recent upward trend in public sector employment is a big challenge for the Spending Review, particularly the continual growth in NHS staff as more people live longer lives, in addition to commitments to recruit more police officers and to improve other public services. Higher wage settlements in both the public and private sectors could significantly affect the number of people the government can afford to employ to meet its policy objectives.