ICAEW chart of the week: before the emergency fiscal event

My chart this week looks at how the budgeted deficit was supposed to play out according to the Spring Statement back in March, ahead of an emergency fiscal event expected within the next few weeks.

Step chart:

(£144bn) 2021/22 provisional deficit

+£84bn COVID-19 measures not repeated

+£18bn Economic growth net of inflation

-£27bn Higher interest costs

-£30bn Tax and spending changes

=

(£99bn) 2022/23 budgeted deficit

The new Chancellor will be looking at a range of possible large scale interventions to support individuals and businesses as they face unprecedented cost-of-living and cost-of-doing-business crises this winter. Several commentators have suggested that the combination of tax cuts trailed by new Prime Minister Liz Truss and a massive emergency support package could add more than £100bn to the deficit, more than doubling the budgeted deficit of £99bn established back in March 2022 just before the start of the financial year.

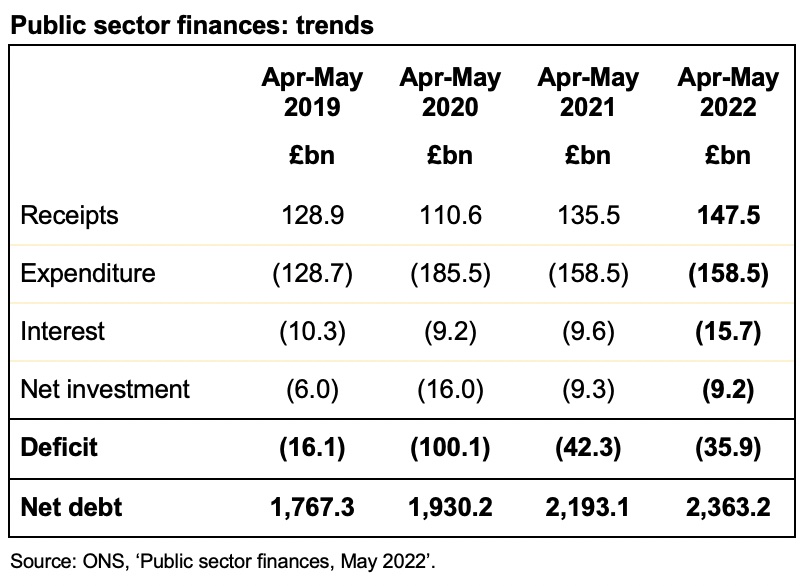
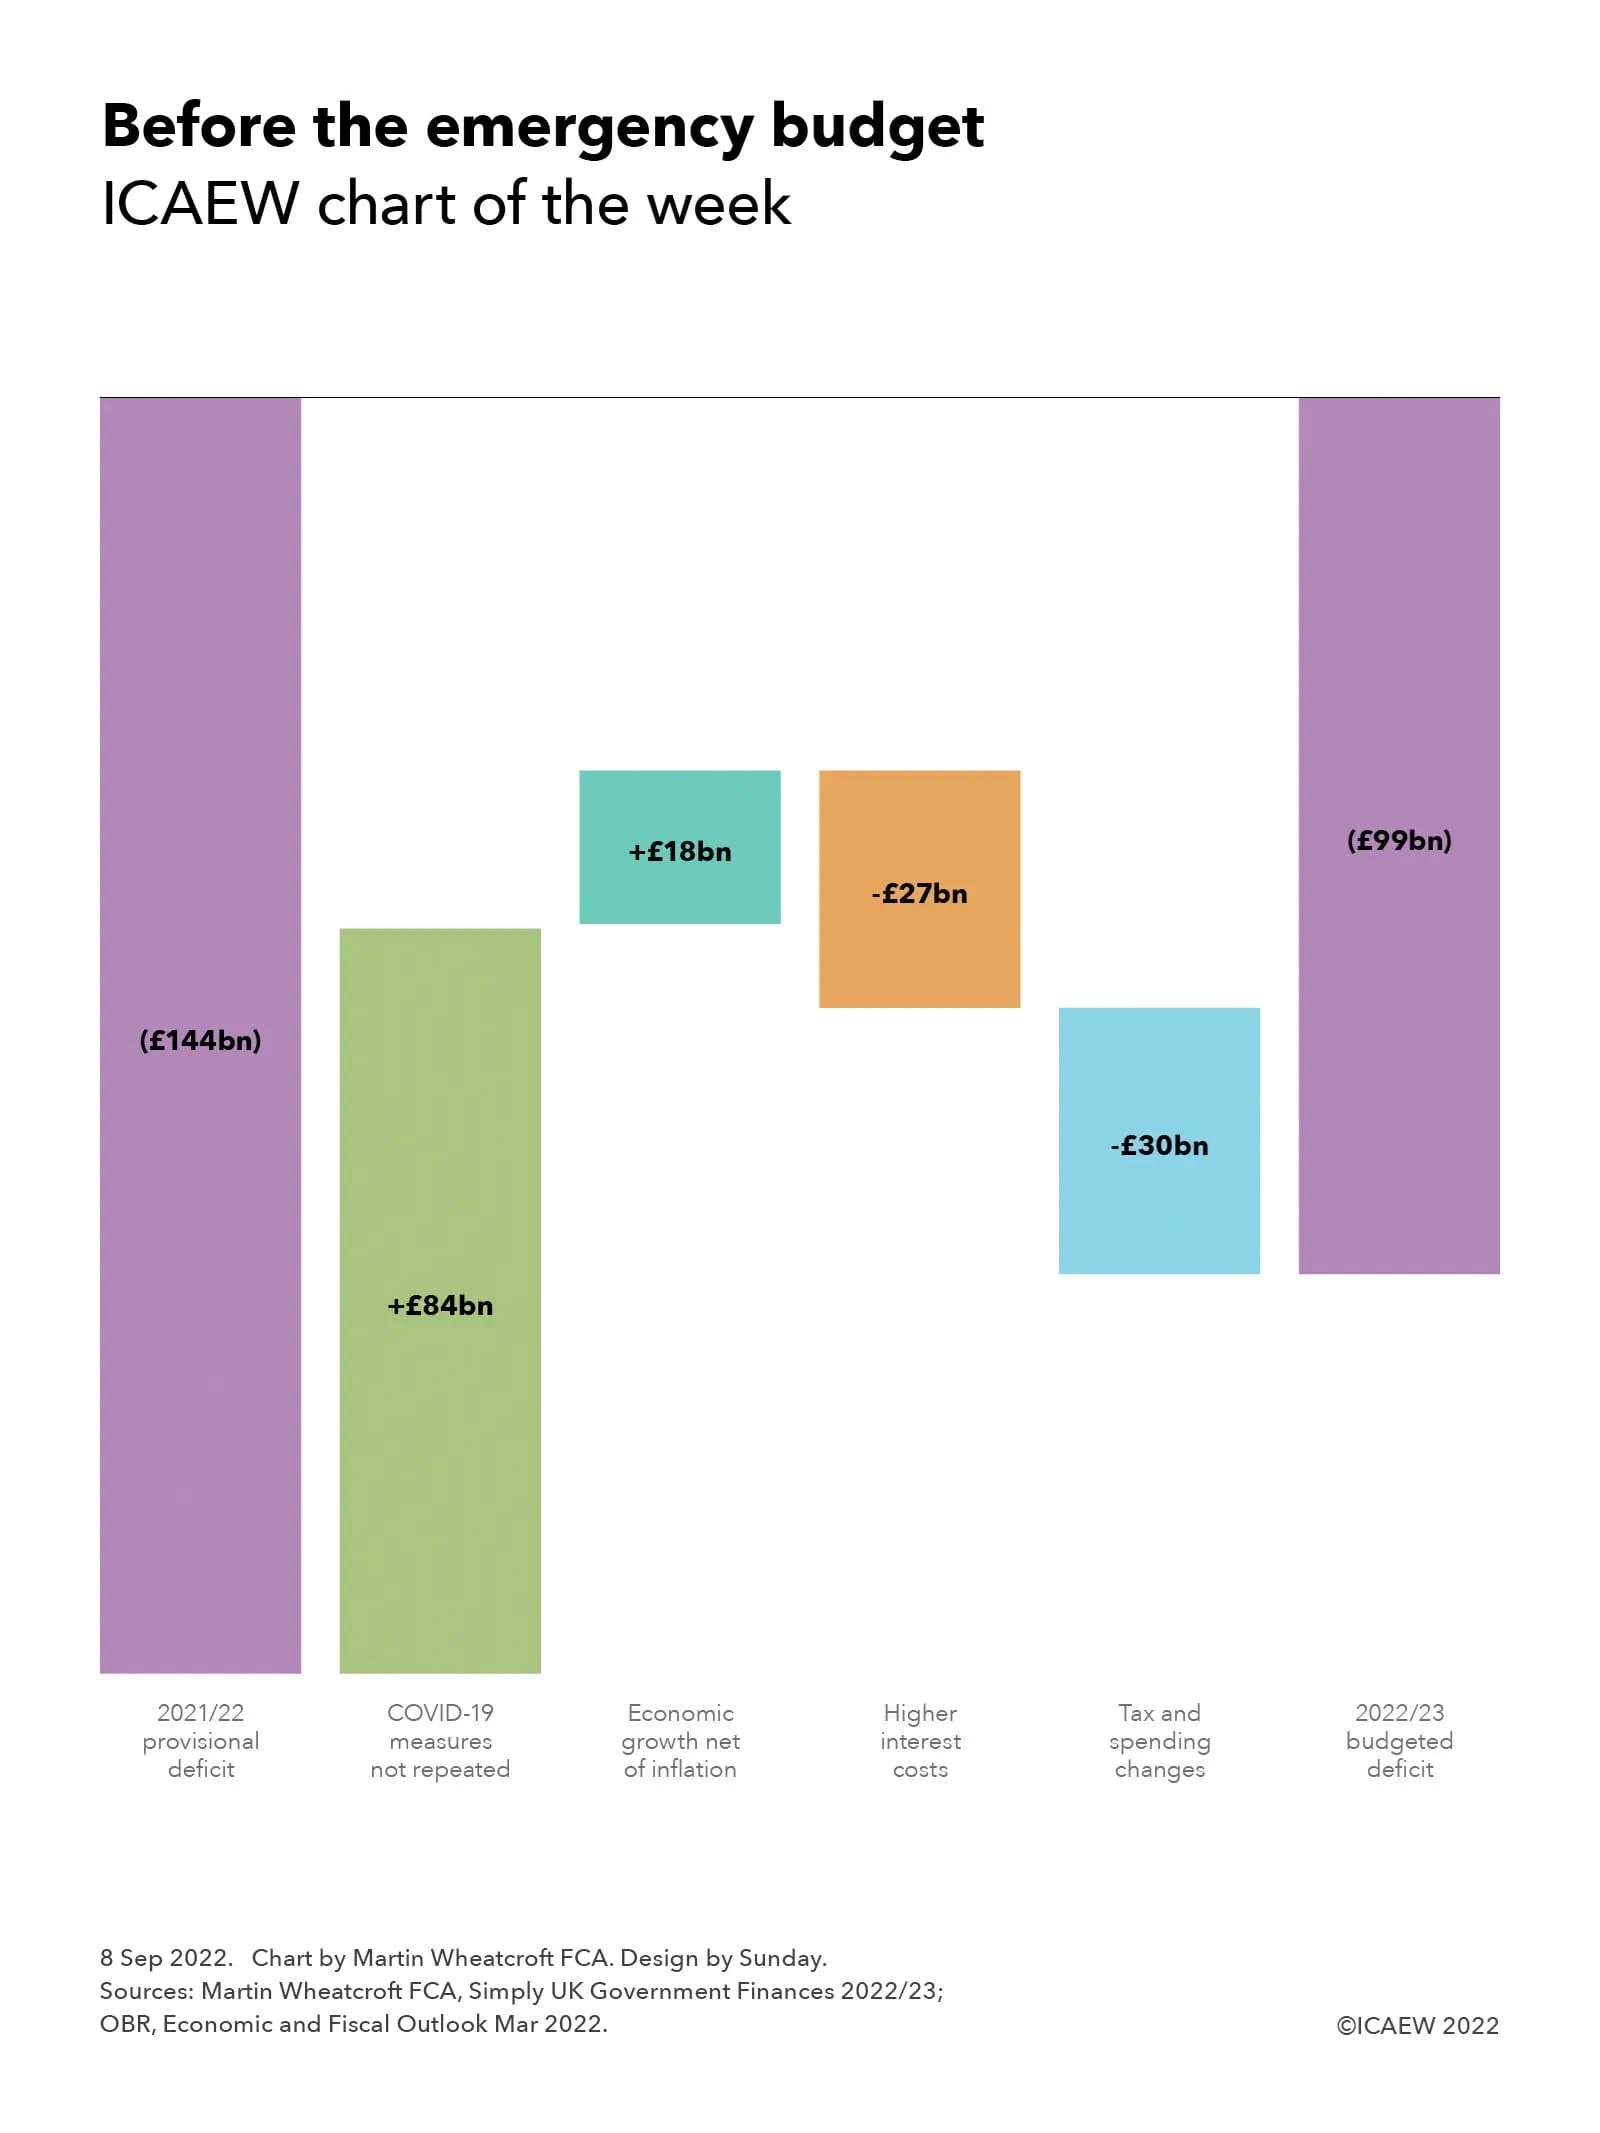
My chart illustrates how the deficit was expected to change from a provisional outturn of £144bn for the deficit in the year ended 31 March 2022, when taxes and other receipts were £914bn and total managed expenditure amounted to £1,058bn.

Last year’s totals included £84bn in COVID-19 related measures (£14bn of tax cuts and £70bn of spending measures) that are not repeated this year, with further spending this year – including continuing to treat COVID-19 patients and tackling NHS backlogs that stem from the pandemic – folded into departmental budgets set during the three-year Spending Review back in October 2021.

Economic growth net of inflation was expected to reduce the deficit by a further £18bn, comprising £21bn in extra receipts from forecast economic growth of 2.2% less £3bn (£41bn on spending, £38bn on receipts) from forecast inflation of 4.1%. The latter uses the GDP deflator measure for the ‘whole economy’ and was estimated at a point when consumer price inflation was expected to reach 8.0% this year.

Inflation also drove much of the jump in interest costs of £27bn in comparison with the previous year, principally because of interest accrued on inflation-linked gilts, but also as a consequence of higher interest rates.

Tax and spending changes amounted to £30bn, comprising £31bn in additional spending less a net £1bn in tax changes. The former comprises a £21bn or 2.0% increase in public spending principally stemming from the 2021 Spending Review, together with £10bn of support for household energy bills announced by former chancellor Rishi Sunak back in February and March 2022. Tax rises were expected to add £20bn to the top line, of which £18bn stems from the rise in national insurance rates from April pending the introduction of the health and social care levy next year. However, this was offset by £19bn in tax cuts and other movements, including a £6bn tax cut from increasing national insurance thresholds, £2bn from cutting fuel duty by 5p, and £1bn from freezing the business rates multiplier.

These changes result in a budgeted deficit of £99bn, being forecast tax and other receipts of £988bn less public spending of £1,087bn.

These amounts exclude £15bn in additional help for energy bills since the budget was finalised in March 2022, partially offset by £5bn from the windfall tax on energy companies announced at the same time. Adjusting for these two items, however, is relatively small beer compared with the large-scale fiscal announcements made by new Chancellor Kwasi Kwarteng. This is before the Office for Budget Responsibility works its magic in updating the fiscal forecasts for changes in the economic situation, taking account of higher inflation and interest rates, and lower economic growth or even an economic contraction.

The worsening economic outlook continues to overshadow the public finances, providing perhaps one of the worst foundations for any incoming Chancellor since the Second World War.

This chart was originally published by ICAEW.

July boost to public finances doesn’t stop red ink

Fiscal outlook worsens as mid-year self assessment receipts fail to outweigh higher debt interest and the cost of energy support packages.

The monthly public sector finances for July 2022 released on Friday 19 August 2022 reported a provisional deficit for the month of £5bn, compared with a deficit of £21bn in the previous month as self assessment receipts boosted the cash position, supplemented by growing VAT and PAYE receipts. The latter helped add £7bn to the top line compared with this time last year, bringing total receipts for the month to £84bn, while current expenditure excluding interest of £79bn and interest of £7bn were each £3bn higher. With net investment unchanged at £3bn, the net improvement in the deficit for July compared with the same month last year was £1bn.

The total deficit for the first four months of the 2022/23 financial year was £55bn following revisions to previous months. This was £12bn lower than this time last year and £99bn lower than the previous year during the first pandemic lockdown, but £33bn more than the deficit of £22bn for the first four months of 2019/20, the most recent pre-pandemic comparative period.

Public sector net debt was £2,388bn or 95.5% of GDP at the end of July, up £46bn from £2,342bn at the end of March 2022. This is £621bn higher than the £1,767bn equivalent on 31 March 2020, reflecting the huge sums borrowed over the course of the pandemic, although the increase in the debt-to-GDP ratio from 74.4% on 31 March 2020 is less than that reported in previous months as inflation has added to nominal GDP.

Tax and other receipts in the first four months to 31 July amounted to £313bn – £31bn, or 11%, higher than a year previously. This included higher income tax receipts from wage increases and bonuses as well as the new higher rate of national insurance, together with additional VAT receipts from inflation in retail prices.

Expenditure excluding interest and investment for these four months of £311bn was level with the same period last year, as reduced spending on the pandemic (including furlough programmes) was offset by the spending increases announced in last year’s Spending Review, together with support for households to help with energy bills.

Interest charges of £44bn were recorded for the four months – £21bn or 92% higher than the £23bn in the equivalent period in 2021 – with inflation driving up the cost of RPI-linked debt in addition to the effect of higher interest rates.

Cumulative net public sector investment was £14bn. This is £1bn or 9% lower than a year previously, potentially indicating a slowdown in capital programmes given that the Spending Review 2021 had pencilled in significant increases in capital expenditure budgets for the current year.

The increase in net debt of £46bn since the start of the financial year comprises the deficit for the four months of £55bn less £9bn in net cash inflows, as inflows from repayments of taxes owed and loans made to businesses during the pandemic exceeded outflows to fund student loans, other lending and working capital movements.

Alison Ring OBE FCA, Public Sector and Taxation Director at ICAEW, said: “The latest numbers highlight the extent to which the fiscal outlook is worsening as the cost of borrowing rises, with record high energy costs, rapidly increasing prices and an economy close to recession expected to further drive up public spending in this and the next financial year.

“The UK’s deteriorating fiscal situation will make it hard for the new prime minister to deliver on promised tax cuts, invest in energy resilience and support struggling families and businesses over the winter, without breaching fiscal rules intended to ensure the long-term health of the public finances.”

Table with cumulative receipts - expenditure - interest - net investment = deficit - other borrowing = debt movement for the first four months of the financial year, together with net debt and net debt / GDP.

Apr-Jul 2019 £bn: 268 - 257 - 23 - 10 = -22 deficit + 10 = -12 debt movement; 1,767 net debt, 78.3% net debt / GDP.

Apr-Jul 2020 £bn: 234 - 347 - 15 - 26 = -154 deficit - 40 = -194 debt movement; 1,987 net debt, 92.6% net debt / GDP.

Apr-Jul 2021 £bn: 281 - 310 - 23 - 15 = -67 deficit + 2 = -65 debt movement; 2,200 net debt, 94.1% net debt / GDP.

Apr-Jul 2022 £bn: 313 receipts - 310 expenditure - 44 interest - 14 net investment = -55 deficit + 9 = -46 debt movement; 2,388 net debt, 95.5% net debt / GDP.

Caution is needed with respect to the numbers published by the ONS, which are expected to be repeatedly revised as estimates are refined and gaps in the underlying data are filled.

The ONS made several revisions to prior period fiscal numbers to reflect revisions to estimates. These had the effect of reducing the reported fiscal deficit for the three months ended 30 June 2022 by £5bn from £55bn to £50bn and increasing the reported fiscal deficit for the 12 months to March 2022 by £2bn from £142bn to £144bn.

This article was originally published by ICAEW.

Inflation adds fuel to the deficit as cost of borrowing soars

Economic pressures mount as the public sector deficit reaches £55bn in the first three months of the fiscal year.

The monthly public sector finances for June 2022, released on Thursday 21 July 2022, reported a provisional deficit for the month of £23bn, bringing the total for the first quarter of the 2022/23 financial year to £55bn.

The first quarter deficit was £6bn below this time last year, but £32bn higher than the £23bn reported for the first three months of 2019/20, before the pandemic.

Public sector net debt increased to £2,388bn or 96.1% of GDP at the end of June, up £46bn from £2,342bn at the end of March 2022. This is £595bn higher than 31 March 2020, reflecting the huge sums borrowed over the course of the pandemic.

Tax and other receipts in the first quarter to 30 June amounted to £228bn, £24bn or 11% higher than a year previously. This included higher income tax receipts from wage increases and bonuses as well as the new higher rate of national insurance, plus higher VAT receipts driven by higher retail prices.

Expenditure excluding interest and investment for the quarter of £234bn was £1bn higher than the same period last year, as reduced spending on the pandemic (including furlough programmes) was offset by planned increases in spending announced in last year’s Spending Review and by additional support to households to help with their energy bills.

Interest charges of £36bn were recorded for the three months, £17bn or 39% higher than the £19bn in the equivalent period in 2021, driven by rising inflation increasing the cost of RPI-linked debt in addition to higher interest rates. This reflects how the government’s hedge against low inflation – which saw interest charges fall even as debt quadrupled over the last 15 years – went into reverse, with the benefit (to the government) of debt inflating away more quickly offset by a higher cost of borrowing.

Net public sector investment in the quarter was reported to be £13bn, which is £1bn or 7% higher than a year previously.

The increase in net debt of £46bn since the start of the financial year comprises the deficit for the quarter of £55bn less £9bn in net repayments. This reflects the recovery of loans to banks through the Bank of England’s Term Funding Scheme and of loans to businesses via the British Business Bank (including bounce-back and other coronavirus loans), offset by outflows to fund student loans and other government cash requirements.

Alison Ring OBE FCA, Public Sector and Taxation Director for ICAEW, said: “The latest inflation-fuelled numbers will provide little comfort for the new Prime Minister, as at £55bn for the quarter to June, the deficit is more than double what it was before the pandemic.

“With inflation at a 40-year high and record energy prices this winter, the question facing the next Prime Minister and Chancellor will not be about whether or not to write another cheque to struggling families, but how big it will be.

Meanwhile, rising supplier cost inflation and public sector pay demands that are unlikely to be satisfied by a proposed 5% increase will put severe pressure on both operating and capital budgets. Combined with long-term demographic trends that continue to drive public spending higher, the likelihood is that any tax cuts promised during the Conservative party leadership campaign will end up being reversed in the years ahead.”

Table with public sector finance numbers for receipts, expenditure, interest, net investment, the deficit, other borrowing, the net movement in debt and net debt at the end of the period.

Apr-Jun 2019: receipts £195bn - expenditure £192bn - interest £18bn - net investment £8bn = deficit -£23bn - other movements £1bn = net movement -£24bn; net debt £1,767bn or 78.9% of GDP.

Apr-Jun 2020: £170bn - £268bn - £12bn - £22bn = deficit -£132bn - £51bn = net movement -£183bn; net debt £1,976bn or 91.9% of GDP.

Apr-Jun 2021: £204bn - £234bn - £19bn - £12bn = deficit -£61bn - £9bn = net movement -£70bn; net debt £2,205bn pr 95.1%.

Apr-Jun 2022: £228bn - £234bn - £36bn - £13bn = deficit £55bn + £9bn = net movement -£46bn; net debt £2,388bn or 96.1% of GDP.

Caution is needed with respect to the numbers published by the ONS, which are expected to be repeatedly revised as estimates are refined and gaps in the underlying data are filled.

The ONS made several revisions to prior period fiscal numbers to reflect revisions to estimates. These had the effect of reducing the reported fiscal deficit for the two months ended 31 May 2022 by £3bn from £36bn to £33bn and the reported fiscal deficit for the twelve months to March 2022 by £2bn from £144bn to £142bn.

This article was originally published by ICAEW.

ICAEW chart of the week: Long-term fiscal forecast

The chart this week highlights the difficult fiscal background facing an incoming prime minister as the OBR reports how a “riskier world and ageing population ultimately leave the public finances on unsustainable path”.

Column chart showing public sector net debt as a percentage of GDP from 2021/22 to 2071/22 per the OBR long-term forecast. Starts at 96% in 2021/22, declining to 68% in the mid-2030s and then rising up to 267% by 2071/72.

The publication of the Office for Budget Responsibility (OBR) of its combined fiscal risks and sustainability report on Thursday 7 July 2022 was overshadowed by events in Westminster, which is unfortunate given just how important the state of the public finances is to the success of future government administrations and to the country as a whole.

Setting out long-term fiscal forecasts for the next 50 years, the OBR has analysed threats posed by rising geopolitical tensions, higher energy prices, the pressures of an ageing population and the loss of motoring taxes, as well as risks such as cyber attacks, future economic shocks, higher defence spending, and global protectionism adversely affecting international trade.

The chart illustrates the baseline projections prepared by the OBR, which show public sector net debt as a share of GDP rising from 96% of GDP to 267% in 50 years’ time in 2071/72. This primarily reflects more people living longer with the consequent effect that has on public spending, in particular pensions, health and social care, combined with a declining proportion of working age adults who pay the most in taxes. The report also highlights the fiscal gap created by the loss of fuel duty and vehicle excise duty as petrol and diesel cars are replaced with electric vehicles.

The OBR’s Chair, Richard Hughes, commented how 20 years ago, “Government debt stood at 28% of GDP, the deficit was about 0.5% of GDP, the economy was growing at an average rate of 2.75%, and inflation was running at 1.3% – and the Treasury’s pioneering 50-year fiscal projections predicted that government debt this year, 2022, would stay just below 40% of GDP – consistent with the fiscal rules in place at the time.

“As we now know, debt this year is expected to be more than twice that, at 96% of GDP,” Hughes continued, highlighting how over the past two decades the UK economy has been buffeted by an unprecedented series of global shocks including a financial crisis, a pandemic, a major war on the European continent, and an energy crisis. 

Hughes commented: “Working away in the background as this series of crises unfolded were a set of longer-term pressures on the public finances and the number of people aged 65 and over rose by 3.5 million from 9.5 to 13 million people; we learned that global temperatures had already risen by 1°C and were on track to rise by 4°C by the end of this century; and having fallen from over 5% in 2002 to less than 0.5% in 2020, interest rates on government debt are now back up to 2%.”

One of the key drivers of the projection is the old-age dependency ratio, the number of those aged 65 and over to those aged 16 to 64, which is expected to rise from 0.31 in 2022 to 0.52 in 2072, with a low birth rate and inward migration insufficient to offset the increasing number of people living longer in retirement.

The report has stress tested the projections with a range of potential events that could make the financial position much worse, with different unpalatable scenarios seeing the ratio of debt to GDP rising to 288%, 304%, 317% or 437% in 2071/72, depending on the assumptions made. In the other direction, the OBR notes that 76,000 additional net inward migrants a year over 50 years would reduce the baseline projection for debt to GDP of 267% to 217% in 2071/72.

The next prime minister will inevitably focus on the many short-term challenges facing the government and the country, but the OBR report makes clear just how much a long-term fiscal strategy is needed to put the public finances onto a sustainable path.

This chart was originally published by ICAEW.

Economic storm clouds darken outlook for public finances

A slightly higher fiscal deficit for May and rising interest rates provide no comfort for the Chancellor as he considers how to respond to public sector wage demands.

The monthly public sector finances released on Thursday 23 June 2022 reported a provisional deficit for the month of May 2022 of £14.0bn, an improvement from this time last year, but still £8.5bn higher than May 2019, the year before the pandemic.

Public sector net debt increased by £21bn from £2,342bn at the end of March 2022 to £2,363bn or 95.8% of GDP at the end of May. This is £570bn higher than 31 March 2020, reflecting the huge sums borrowed over the course of the pandemic.

The deficit reported for the two months to May 2022 of £35.9bn was an improvement of £6.4bn from the deficit of £42.3bn reported for the months of April and May 2021, and £64.2bn better than the £100.1bn reported for April and May 2020. However, it was £19.8bn worse than the pre-pandemic deficit of £16.1bn for the two months to May 2019.

Tax and other receipts in the two months amounted to £147.5bn, £12.4bn or 9% higher than a year previously. This included higher income tax receipts from wage increases and bonuses as well as the new higher rate of national insurance, as well as higher VAT receipts driven by higher retail prices.

Expenditure excluding interest and investment for the year to date of £158.5bn was unchanged from the same period last year, as reduced spending on the pandemic including furlough programmes was offset by planned increases in spending announced in last year’s Spending Review and by additional support to households to help with their energy bills.

Interest amounted to £15.7bn in April and May, £6.1bn or 64% higher than the £9.6bn in the two months ended 31 May 2021, reflecting how higher interest rates and higher inflation are increasing the government’s cost of borrowing.

Net public sector investment in April and May 2022 was reported to be £9.2bn, which is £0.1bn lower than a year previously. This is slightly surprising given planned increases in capital expenditure as well as the subsidies given in the past two months to Bulb Energy, a failed energy supplier taken over by the government.

The increase in net debt of £21.2bn since the start of the financial year comprises the deficit for the month of £35.9bn less £14.7bn in net borrowing repayments. This reflects the recovery of loans to banks through the Bank of England’s Term Funding Scheme and of loans to businesses via the British Business Bank (including bounce-back and other coronavirus loans), offset by funding for student loans and other government cash requirements.

Alison Ring OBE FCA, Public Sector and Taxation Director for ICAEW, said: “A slightly higher deficit than expected in this month’s numbers and a rising interest bill will not provide any comfort for the Chancellor as he considers how to respond to public sector wage demands at the same time as attempting to build capacity for pre-election tax cuts next year.

The economic storm clouds hovering over the fiscal outlook, as living standards go into reverse and inflation erodes the extent of planned investment in local communities, are likely to make the government’s ambition to level up the country even more difficult to achieve.”

Table showing cumulative numbers for April and May 2022 and variances against the same period a year ago:

Receipts £147.5bn: £12.4bn or +8%
Expenditure (£158.5bn): £0.0bn
Interest (£15.7bn): (£6.1bn) or +39%
Net investment: (£9.2bn): £0.1bn or -1%
Deficit (£35.9bn): £6.4bn or -18%
Other borrowing: £14.7bn: £31.1bn or -212%
(Increase) in net debt: (£21.2bn): £37.5bn or -177%

Public sector net debt: £2,363.2bn: £170.1bn or +8%
Public sector net debt / GDP 95.8%: 0.5% or +0.5%

Caution is needed with respect to the numbers published by the ONS, which are expected to be repeatedly revised as estimates are refined and gaps in the underlying data are filled.

The ONS made several revisions to the prior period fiscal numbers to reflect revisions to estimates. These had the effect of increasing the reported fiscal deficit for the month of April 2022 by £3.3bn from £18.6bn to £21.9bn and decreasing the reported fiscal deficits for the 12 months to March 2022 by £0.9bn from £144.6bn to £143.7bn and for the year ended 31 March 2021 by £7.7bn from £317.3bn to £309.6bn.

Table showing receipts, expenditure, interest, net investment, deficit and net debt for April and May combined in 2019, 2020, 2021 and 2022 respectively.

For details, click on the link to the original article on the ICAEW website.

This article was originally published by ICAEW.

ICAEW chart of the week: Whole of Government Accounts 2019/20

We take a look at the government balance sheet at 31 March 2020 this week, following publication by HM Treasury of the long-delayed 2019/20 audited financial statements for the UK public sector.

Step chart showing public assets £2,129bn, liabilities of (£4,973bn) and net liabilities of (£2,834bn).

Fixed assets £1,353bn, receivables & other £195bn, investments £323bn, financial assets £268bn.

Financial liabilities (£2,207bn), payables (£201bn), pensions (£2,190bn).

Taxpayer equity (£2,834bn).

HM Treasury was up in front of the Public Accounts Committee (PAC) this week to be grilled on the Whole of Government Accounts (WGA) for the year ended 31 March 2020. The first question posed by MPs was why it had taken more than 26 months to publish the audited financial statements for the UK public sector, unlocking a tale of woe regarding the pandemic, delays in central government reporting, even greater delays in local government, and problems in implementing a new consolidation system. 

For all that, the PAC expressed their appreciation for the contents of the WGA, which comprises a performance report, governance statements, financial statements prepared in accordance with International Financial Reporting Standards, an audit report and a reconciliation to the fiscal numbers reported by the Office for National Statistics. The UK is one of the leading governments around the world in preparing comprehensive financial reports similar to those seen in the private sector, and is the only one to attempt to incorporate local government as well as central government and public corporations.

Our chart summarises the balance sheet reported in the consolidated financial statements at 31 March 2020, when there were total assets of £2,139bn, total liabilities of £4.973bn and negative taxpayer equity of £2,834bn. These numbers do not reflect the more than half a trillion pounds borrowed since then which are likely to see the 2020/21 and 2021/22 WGA move even further into negative territory. 

On the positive side of the balance sheet were:

  • £195bn of receivable and other assets, comprising £160bn of trade and other receivables due within one year, £22bn of receivables due in more than year, £11bn of inventories and £2bn of assets held for sale;
  • £1,353bn of fixed assets, consisting of £676bn for infrastructure, £459bn of land and buildings, £77bn of assets under construction, £41bn of military equipment, £60bn of other tangible fixed assets, and £40bn of intangibles;
  • £323bn of investments, including £126bn of non-current loans and deposits, £77bn in student loans, £36bn in equity investments, £22bn invested in the IMF, £38bn in derivatives and other, and £24bn in investment property; and 
  • £268bn of current financial assets, of which £118bn were in debt securities, £74bn in loan balances due within one year, £38bn in cash and cash equivalents, £13bn in gold holdings, £13bn in IMF special drawing rights and £12bn in derivatives and other.

On the negative side, there were:

  • £2,207bn in financial liabilities, comprising £1,266bn in government securities (gilts and Treasury bills), £560bn of deposits owed to banks, £179bn owed to investors in National Savings & Investments, £78bn in bank and other borrowings, £74bn in banknotes and £50bn in derivatives and other financial liabilities;
  • £201bn of payables, including £66bn of accruals and deferred income, £55bn of trade and other payables, £42bn in lease obligations, £34bn in tax and duty refunds payable and £4bn in contract liabilities;
  • £2,190bn in net pension obligations, of which £2,062bn were for unfunded pension schemes (NHS £760bn, teachers £490bn, civil service £309bn, armed forces £233bn, police & fire £197bn, other £73bn) and £128bn for funded schemes (local government £359bn less £253bn = £106bn, and other funded schemes £106bn less £84bn = £22bn). This balance does not include the state pension, which is treated as a welfare benefit and not a liability for accounting purposes; and
  • £375bn in provisions for liabilities and charges, including £157bn for nuclear decommissioning, £86bn for clinical negligence, £39bn for EU liabilities, £31bn for the pension protection fund and £62bn in other provisions.

Net liabilities therefore amounted to £2,834bn, reflecting the general policy decision taken by successive governments not to fund liabilities in advance, but instead to rely on future tax revenues and borrowing to provide cash as needed to settle liabilities and other financial obligations and commitments. As Sir Tom Scholar, Permanent Secretary at HM Treasury, informed the PAC, this minimises the investment risks the government might otherwise be exposed to if it were to invest in (say) the stock market.

Cat Little, Head of the Government Finance Function, set out plans to bring down the time to prepare the WGA, to within 24 months for the 2020/21 WGA and to within 20 months for the 2021/22 WGA. This remains a long way off the long-term objective of producing the WGA within nine months of the balance sheet date.

While the numbers in these financial statements are now more than two years old, they are still extremely valuable in providing a baseline for the financial position of the UK public sector as the country headed into the pandemic. It is well worth a read if you have the time.

The Whole of Government Accounts 2019/20 is available online.

This chart was originally published by ICAEW.

ICAEW chart of the week: Public finances by region 2020/21

The ICAEW chart this week highlights how every single region and nation in the UK was in deficit in the first fiscal year of the pandemic.

Our chart this week highlights how every single region and nation in the UK was in deficit in the first fiscal year of the pandemic.

The Office for National Statistics (ONS) recently released an analysis of government revenue and expenditure by region and nation of the UK for the financial year ended 31 March 2021 – the first year of the pandemic. 

This was a year that saw public spending balloon to £1,112bn from £884bn in 2019/20 as the government splurged cash in response to the arrival of the coronavirus. At the same time, taxes and other income fell to £794bn in 2020/21 from £829bn the year before, while unprecedented levels of support to businesses and individuals prevented a much greater collapse in tax receipts. The resulting deficit of £318bn was the largest ever in peacetime.

The chart illustrates how every region incurred a deficit in 2020/21, with a deficit per head of approximately £800 in Greater London (revenue per head £18,440/expenditure per head £19,240), followed by £1,640 in the South East (£14,020/£15,660), £3,360 in the East of England (£11,940/£15,300), £5,000 in the South West (£10,940/£15,940), £5,140 in the East Midlands (£9,860/£15,000), £5,920 in Yorkshire and The Humber (£9,620/£15,540), £6,220 in the West Midlands Region (£9,380/£15,600), £6,580 in Scotland (£11,780/£18,360), £6,780 in the North West (£9,800/£16,580), £7,960 in the North East (£8,700/£16,660), £8,180 in Wales (£9,060/£17,240) and £9,500 in Northern Ireland (£8,740/£18,240). These numbers compare with an overall UK average deficit of approximately £4,740 per person, comprising per capita revenue of £11,840 less per capita spending of £16,580 based on a population of 67.1m.

The deficit in 2020/21 was so large that even London and the South East, which normally supply substantially more revenue to the government than they receive back in expenditure, saw the reverse this time. (In contrast, for example, with the surpluses of £4,520 and £2,180 per head respectively in 2019/20.)

Inclusive of pandemic spending, most regions ended up benefiting from government expenditure and welfare support of between £15,000 and £17,000 per person in the year, the outliers being Scotland and Northern Ireland, where spending exceeded £18,000 and London where it exceeded £19,000 per head. There is much wider range in the average for taxes and other income, from less than £9,000 per person in in the North East and Northern Ireland (more than 25% lower than the UK-wide average) up to more than £14,000 per head in the South East and more than £18,000 per head in London (more than 50% higher than the UK average).

For the public finances 2020/21 was a landmark year, in which exceptional levels of expenditure and an extraordinarily large deficit led to a significant increase in public debt. Despite that – as our chart illustrates – there continue to be significant economic and fiscal disparities across the regions and nations of the UK.

This chart was originally published by ICAEW.

ICAEW chart of the week: VAT receipts by quarter

This week’s chart highlights how the VAT deferral scheme is almost entirely behind higher VAT receipts in recent quarters, providing a note of caution to recent media headlines welcoming bumper tax revenues.

Horizontal bar chart showing VAT receipts by quarter from Jan-Mar 2017 through to Jan-Mar 2022.

2017: £31.7bn, £30.3bn, £31.1bn,  £31.8bn (Oct-Dec)
2018: £33.2bn, £30.8bn, £33.5bn, £32.9bn
2019: £35.4bn, £32.2bn, £34.3bn, £34.2bn
2020: £29.2bn, -£0.4bn, £28.4bn, £34.2bn
2021: £39.4bn, £35.2bn, £40.2bn, £41.4bn
2022 Jan-Mar: £40.6bn

The ICAEW chart of the week is on the topic of VAT, illustrating the quarterly pattern of VAT receipts since 2017 according to the HMRC tax receipts and national insurance contributions monthly bulletin published on 26 April.

The chart highlights how VAT receipts have grown steadily since 2017 up until the start of the pandemic, with receipts in calendar quarters of £31.7bn (Jan-Mar), £30.3bn (Apr-Jun), £31.1bn (Jul-Sep) and £31.8bn (Oct-Dec) in 2017; £33.2bn, £30.8bn, £33.5bn and £32.9bn in 2018; and £35.4bn, £32.2bn, £34.3bn and £34.2bn in 2019. This was followed by a big dip in 2020, with £29.2bn in Jan-Mar 2020, a net negative outflow of -£0.4bn in Apr-Jun, £28.4bn in Jul-Sep and £34.2bn in Oct-Dec 2020. In 2021, VAT receipts strengthened, with £39.4bn, £35.2bn, £40.2bn and £41.4bn by quarter, followed by £40.6bn in Jan-Mar 2022, the last quarter of the 2021/22 fiscal year.

The significant drop in VAT receipts in 2020 was driven by a combination of the economic contraction caused by the pandemic, cuts in VAT rates for hospitality, and – most significantly – £33.5bn in deferrals under the VAT payments deferral scheme implemented at the time of the first lockdown in 2020. This is the primary driver of the negative VAT receipts in the Apr-Jun quarter 2020 highlighted in the chart.

The original intention was that VAT deferred from 2020 would be due by no later than 30 June 2021, however, further relief in the form of a monthly instalment plan allowed VAT-registered businesses to spread the payment of the deferred VAT over the rest of the 2021/22 fiscal year. This has boosted the last three quarters of VAT receipts shown in the chart.

HMRC reports that £31.3bn of the VAT deferred was carried forward in 2021/22, which would imply a swing between financial years in the order of £60bn. This is greater than the £56bn increase in VAT receipts seen between the £101bn recorded for the four quarters to March 2021 and the £157bn in the following four quarters constituting the 2021/22 fiscal year.

VAT receipts excluding the effect of the deferral scheme may therefore have decreased in the last four quarters, which is surprising in the context of rising prices and the end of the discounted VAT rate for hospitality.

Recent media headlines reporting a bumper tax windfall for the Chancellor should therefore be treated with some caution. While tax receipts in 2021/22 have been much stronger than expected, a significant element of the increase relates to the collection of VAT held over from the previous year and not to any genuine increase in underlying tax revenues.

This chart was originally published by ICAEW.

ICAEW chart of the week: UK International Reserves

We take a look at the UK’s official international reserves that are held to safeguard sterling and support monetary policy.

Step chart showing components of the UK International Reserves.

Gross reserves: £101bn foreign currency securities and deposits, £36bn IMF, £15bn gold, £23bn other instruments.

Liabilities: (£109bn) other instruments

Net reserves: £66bn

Our chart this week is on the UK International Reserves, which comprise foreign currency securities and deposits, gold, investments in the International Monetary Fund (IMF), and other financial instruments primarily used to manage sterling as a national currency and support monetary policy.

As illustrated by the chart, the combined total of UK government and Bank of England international gross reserves was £175bn at 31 March 2022, comprising £101bn in foreign currency securities and deposits, £36bn invested in the IMF, £15bn in gold and £23bn in other financial instruments. This was offset by £109bn in liabilities to arrive at net reserves of £66bn.

According to the Bank of England, the £101bn in foreign currency securities consisted of £75bn in bonds and notes issued by foreign governments, £15bn in foreign government money market investments, £6bn in foreign central bank deposits and £5bn in private sector securities. The £36bn invested the IMF comprises £6bn in IMF reserves (effectively the IMF’s share capital) and £31bn in Special Drawing Rights (SDRs), a government-specific financial asset underpinned by a basket of currencies (US dollar, Euro, Chinese Yuan, Japanese Yen and sterling). The UK government also owned or had rights to 9,976,041 fine troy ounces of gold worth £15bn on 31 March 2022, while other financial instruments of £23bn included £20bn of claims against counterparties on account of reverse repo transactions.

Reserve assets were offset by £109bn in liabilities, comprising loans and securities used to finance reserve assets, repo obligations, and derivative financial instruments including foreign currency forwards, cross currency interest rate swaps and sterling interest rate swaps.

Not shown in the chart is the split between the UK government’s net reserves of £66bn, consisting of £151bn in gross assets less £85bn in liabilities, and the Bank of England’s approximately zero net reserve position, consisting of £24bn in gross assets (£12bn in foreign currency securities and bonds plus £12bn in other financial instruments) less £24bn in liabilities.

The Bank of England manages both its own foreign currency reserves, used to support its monetary policy objectives of controlling inflation, and the UK government’s international reserves, most of which sit in the Exchange Equalisation Account established in 1932 to provide a fund that can be used, when necessary, to regulate the exchange value of sterling. In normal circumstances the Bank of England’s main objectives in managing the reserves are to ensure the liquidity of sterling, the liquidity and security of the reserve assets themselves, and to ensure the reserves are managed in a cost-effective way.

In normal circumstances, the reserves are not used to actively intervene in foreign exchange markets, but are kept ‘in reserve’ on a precautionary basis in case there is any change in exchange rate policy in the future or in the event of any unexpected shocks. More prosaically, they are used to provide foreign currency services for government departments and agencies needing to transact in foreign currencies, as well as to buy, hold and sell SDRs as required by the UK’s membership of the IMF.

Although relatively small in the context of over £1trn a year in UK public spending and £2.3trn in public sector net debt, the UK’s international reserves provide HM Treasury and the Bank of England with a substantial amount of firepower in the foreign exchange markets should there ever be a need to intervene to support sterling. Fortunately, almost all of the foreign currency securities and deposits held in the reserves are invested in governments and central banks of allied countries, a contrast to the position of Russia, which has seen a substantial proportion of its international reserves frozen following its invasion of Ukraine.

One piece of good news amid all the economic gloom at the moment is that the UK International Reserves aren’t hitting the headlines. Because when they do, you really will know that all is not well.

This chart was originally published by ICAEW.

ICAEW chart of the week: US proposed federal budget 2023

Our chart this week illustrates the $5.8tn federal budget for the 2023 fiscal year proposed by President Biden to Congress for approval – a process that will not be straightforward.

Chart illustrating the 2023 US federal budget proposal.

Receipts $4.6tn + Deficit $1.2tn = Outlays $5.8tn.

Receipts comprise social security $1.5tn, income taxes $2.3tn, corporate taxes $0.5tn and other $0.3tn.

Outlays comprise welfare $3.7tn (social security $1.3tn, healthcare $1.4tn, veterans $0.2tn, income security $0.8tn), net interest of $0.4tn and federal government spending of $1.77tn (defence $0.8tn, non-defence $0.9tn).

The US Office for Management and Budget (OMB) has just published President Biden’s proposal for the Budget of the United States Government, Fiscal Year 2023, which commences on 1 October 2022.

Federal spending proposed of $5.8tn comprises $3.7bn of ‘mandatory’ spending, primarily on welfare programmes, $0.4tn on debt interest, and $1.7tn of ‘discretionary’ spending. Welfare spending includes $1.3tn on social security, $1.4tn on healthcare (Medicare and Medicaid), $0.2tn on support to veterans, and $0.8tn on income security and other programmes.

This is a $60bn reduction from the $5.9tn forecast for the current financial year ending on 30 September 2022, with increases in social security ($99bn), Medicare and Medicaid ($67bn), interest ($39bn) and defence ($29bn), offset by a reduction of $280bn in income security (primarily pandemic support) and $14bn in non-defence departmental spending. This compares with the $6.8trn spent in the fiscal year ended 30 September 2021 at the height of the pandemic.

Receipts are forecast at $4.6tn, comprising social security payroll taxes of $1.5tn, federal income taxes of $2.3tn, corporate taxes of $0.5tn, and other taxes $0.3tn, resulting in a deficit of $1.2tn to be funded by borrowing.

Receipts are forecast to be $201bn higher than the $4.4tn forecast for the current financial year, with social security receipts up $64bn, income taxes up $82bn and corporate taxes up $118bn, offset by a fall of $63bn in other receipts. This primarily relates to economic factors as the US emerges from the pandemic but, as has been publicly reported, also involves higher taxes on ‘billionaires’, among other tax measures.

With pandemic income security and furlough programmes no longer required, the deficit has fallen from $2.8tn in 2021 to $1.4tn in the current year and a proposed $1.2tn in the next, before increasing to $1.8tn in 2032, reflecting increases in both receipts and spending over the coming decade.

The budget documents prepared by the OMB focus in particular on the major plans to improve infrastructure embodied in the bipartisan Infrastructure Investment and Jobs Act 2021, as well as further investment in defence, in lowering health and social care costs for individuals, in improving housing, pre-school and college education, and in reducing energy costs by combating climate change. The OMB suggests that there is some prudence in the budget given the uncertainties about whether proposed tax rises will obtain political support from within Congress, with an indication that this will be used to reduce the federal deficit even further if all the proposed tax rises are enacted into law.

For President Biden, this is his last budget proposal before the mid-term elections in November, when there is a possibility that the Democrats might lose control of one, or even both, houses of Congress. This makes it particularly important to his ability to deliver his domestic agenda.

This chart was originally published by ICAEW.