ICAEW chart of the week: Eurozone government bond yields

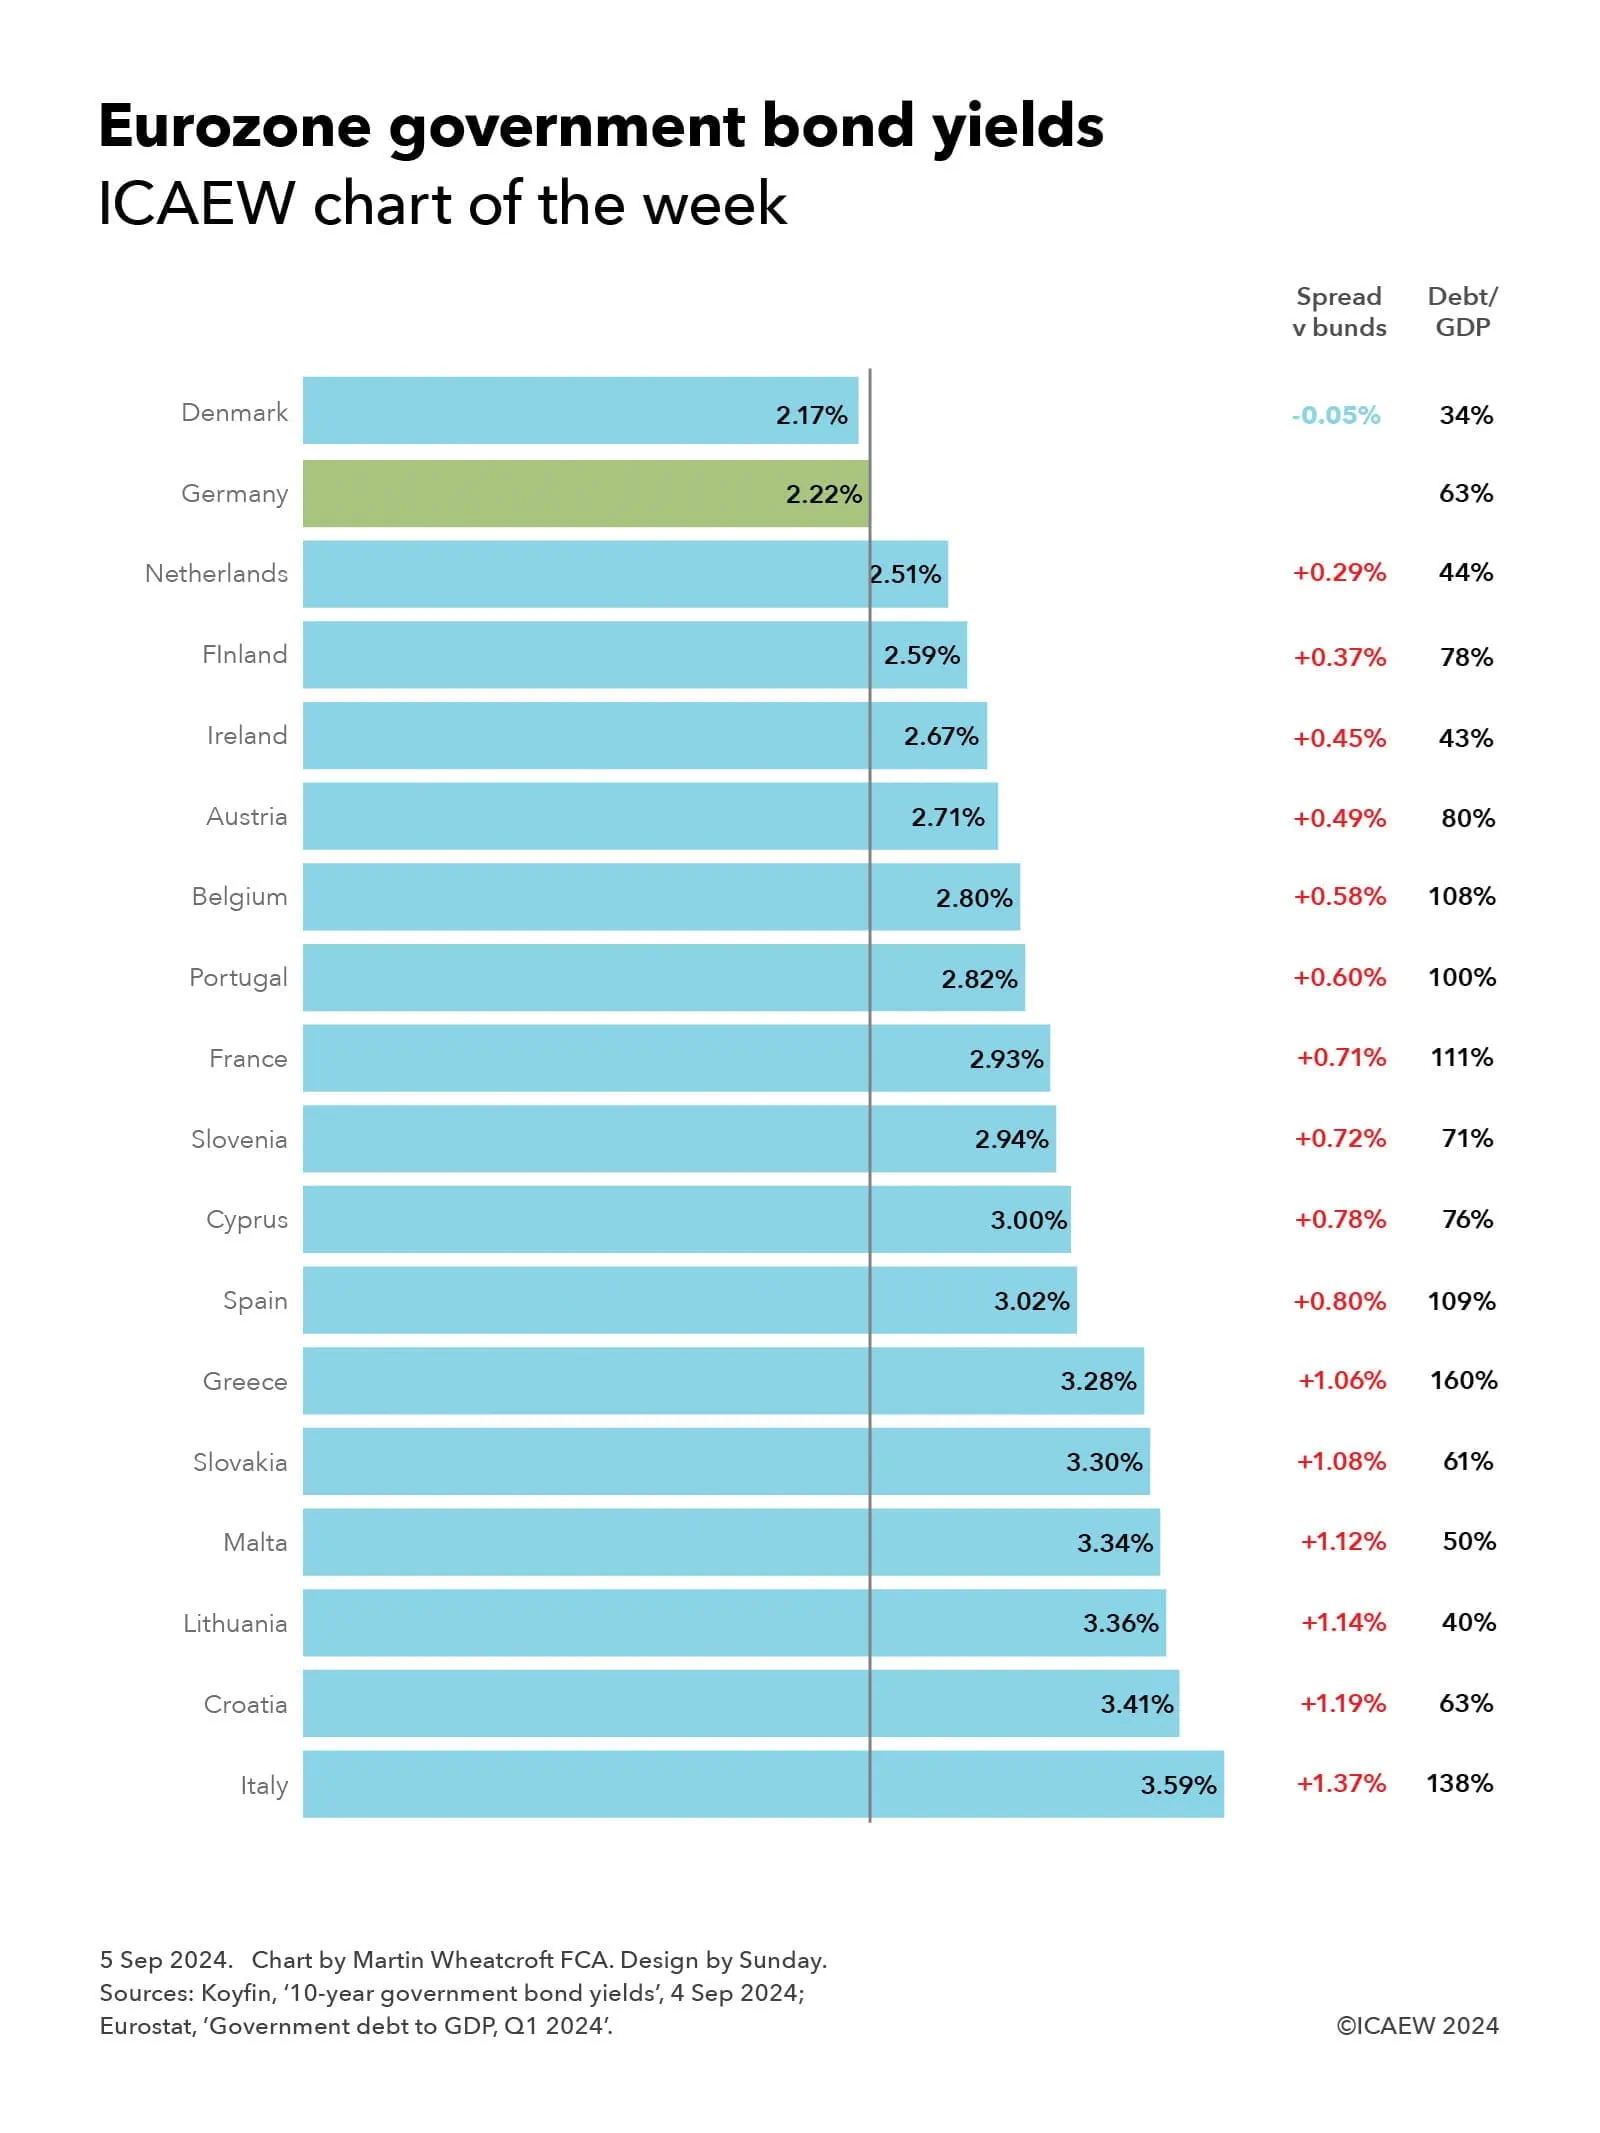
My chart for ICAEW this week is on the cost of government borrowing in the Eurozone, which on 4 September ranged from 2.17% for Danish 10-year bonds up to 3.59% for their Italian equivalents.

ICAEW chart of the week: Eurozone government bond yields. 
 
Bar chart showing the yields on 10-year government bonds on 4 September 2024, the spread versus German bunds, and each countries’ debt to GDP at the end of the first quarter of 2024. 

Denmark: 2.17% yield, -0.05% spread, 34% debt/GDP. 
Germany: 2.22%, -, 63%. 
Netherlands: 2.51%, +0.29%, 44%. 
Finland: 2.59%, +0.37%, 78%. 
Ireland: 2.67%, +0.45%, 43%. 
Austria: 2.71%, +0.49%, 80%. 
Belgium: 2.90%, +0.58%, 108%. 
Portugal: 2.82%, +0.60%, 100%. 
France: 2.93%, +0.71%, 111%. 
Slovenia: 2.94%, +0.72%, 71%. 
Cyprus: 3.00%, +0.78%, 76%. 
Spain: 3.02%, +0.80%, 109%. 
Greece: 3.28%, +1.06%, 160%. 
Slovakia: 3.30%, +1.08%, 61%. 
Malta: 3.34%, +1.12%, 50%. 
Lithuania: 3.36%, +1.14%, 40%. 
Croatia: 3.41%, +1.19%, 63%. 
Italy: 3.59%, +1.37%, 138%. 

5 Sep 2024.   Chart by Martin Wheatcroft FCA. Design by Sunday. 

Source: Koyfin, ’10-year government bond yields’, 4 Sep 2024; Eurostat, ‘Government debt to GDP, Q1 2024’.  

© ICAEW 2024.

My chart this week is on the range of yields payable on 10-year government bonds by 18 out of the 20 countries in the Eurozone for which data is available.

The chart illustrates how investors in German 10-year government bonds (known as ‘bunds’) would have received a yield to maturity of 2.22% – or conversely the German government could have borrowed at an effective interest rate of 2.22% if issuing fresh debt at that point in time. Yields on German bunds are used as benchmark rates for government debt not just in the Eurozone, but globally.

Just one country in the Eurozone has a lower 10-year bond yield than Germany, which is Denmark at 2.17% on 4 September, which is a 0.05 percentage points or 5 basis points (bp) ‘spread’ below the benchmark bund rate. 

While quoted yields move up and down all the time, sometimes by quite large amounts, spreads are much less volatile, providing an insight into how debt investors perceive the relative risks of investing in different countries’ sovereign debt.

The next lowest yields were the Netherlands at 2.51%, with a spread of 0.29 percentage points above bunds, and Finland at 2.59% (+0.37%). This is then followed by Ireland on 2.67% (+0.45%), Austria on 2.71% (+0.49%), Belgium on 2.80% (+0.58%), Portugal on 2.82% (+0.60%), France on 2.93% (+0.71%), Slovenia on 2.94% (+0.72%), Cyprus on 3.00% (0.78%) and Spain on 3.02% (+0.80%). There is then a small jump to Greece on 3.28% (+1.06%), Slovakia on 3.30% (+1.08%), Malta on 3.34% (+1.12%), Lithuania on 3.36% (+1.14%) and Croatia on 3.41% (+1.19%). 

The highest yield for investors among Eurozone countries – and hence the highest borrowing cost for its government – is Italy with 3.59%, which is 1.37 percentage points above the effective interest rate at which Germany could in theory borrow.

Comparing the bond yields in the Eurozone provides an insight into the relative strengths and weaknesses of these countries’ public finances and economies given that they all share a currency, a central bank base interest rate (currently 3.75%), and are all in the EU Single Market and Customs Union. Comparing yields with other currencies, such as the UK’s 3.95% for example (not shown in the chart), needs to take other factors into account, such as the UK’s much higher central bank base rate of 5%.

The chart also reports the government debt to GDP levels of each country for the second quarter of 2024 according to Eurostat, which may help explain why Denmark (with debt/GDP of 34%) pays a significantly lower borrowing cost than Spain (109%). 

However, debt/GDP doesn’t explain all of the differences, with the 10-year yield on Greek government debt (debt/GDP 160%) of 3.28% for example being significantly lower than the 10-year yield on Italian government debt (debt/GDP 138%) of 3.59%. 

Not shown in the chart are Estonia (debt/GDP 24%) and Latvia (45%), both of which tend to borrow at shorter maturities.

The lack of a firm correlation between debt/GDP and bond spreads should not be surprising as debt/GDP is a relatively crude measure of public finance strength or weakness. It excludes most government assets and non-debt liabilities, the funded or unfunded nature of their social security systems, as well as a country’s medium- and longer-term economic prospects and the perceived stability of that country’s government. These are all factors debt investors take into account when deciding the level of risk that they are willing to accept when investing.

This chart was originally published by ICAEW.

Government enters crisis control mode to curb public spending

Boost from self assessment tax receipts not enough to prevent a deficit in July as Chancellor searches for cost savings in the run up to the Autumn Budget.

The monthly public sector finances for July 2024 released by the Office for National Statistics (ONS) on Wednesday reported a provisional deficit for the first four months of the 2024/25 financial year of £51.4bn, £4.7bn worse than budgeted.

Alison Ring OBE FCA, ICAEW Director of Public Sector and Taxation, says: “Today’s data shows that the customary boost from self assessed tax receipts in July was not enough to prevent a deficit of £3.1bn, higher than budgeted, as cost pressures drove up public spending. Debt increased to £2,746bn or 99.4% of GDP at the end of July, up £5.9bn from the end of June 2024.

“The government is now in crisis control mode as it searches for savings to offset significant unbudgeted cost overruns in this financial year, with the cumulative deficit to July 2024 standing at £51.4bn, £4.7bn more than budgeted.

“Rumours that the government is looking at significant cuts in public investment programmes this year to keep within budget are concerning, given the importance to economic growth of infrastructure and the urgent need for upfront investment in technology to fix poorly performing public services. Our hope is that the Chancellor will be able to take a more strategic view in her Autumn Budget in October and in the Spending Review in the spring.”

Month of July 2024

There was a shortfall between receipts and spending of £3.1bn in the month of July 2024, £1.8bn higher than in July 2023 and £3.0bn worse than the budgeted deficit of £0.1bn.

Taxes and other receipts amounted to £99.4bn in July 2024, up £10.3bn or 12% from the previous month driven by self assessment income tax receipts in July, in line with the trend last year. Receipts were £2.0bn or 2% higher than in the same month last year, in contrast with total managed expenditure of £102.5bn, which was £3.8bn or 4% higher than in July 2023. 

Financial year to date

The shortfall between receipts and spending of £51.4bn for the four months to July 2024 was £0.5bn better than in the same period last year, but £4.7bn over budget.

Cumulative taxes and other receipts amounted to £359.3bn in the first third of the financial year, up 2% compared with the same period last year, while total managed expenditure was 2% higher at £410.7bn. This is illustrated by Table 1, which highlights how cuts to employee national insurance rates have been offset by higher income tax, VAT, corporation tax, and non-tax receipts. 

Total managed expenditure for the first four months of £410.7bn was also up by 2% compared with April to July 2023, but this reflected spending on public services up 4%, welfare spending up 6% and gross investment up 10% driven by overruns and construction cost inflation being offset by lower energy-support subsidies and lower debt interest.

The reduction in debt interest of £6.1bn compared with the first four months of last year was driven by a £26.5bn swing in indexation on inflation-linked debt that more than offset a £20.4bn increase in interest on variable and fixed-rate debt.

Table 1: Summary receipts and spending

  Apr-Jul 2024
£bn
 Apr-Jul 2023
£bn
 Change
%
Income tax89.986.4+4%
VAT67.966.0+3%
National insurance53.558.3-8%
Corporation tax34.031.6+8%
Other taxes73.572.1+2%
Other receipts40.537.5+8%
Total receipts359.3351.9+2%
    
Public services(212.2)(204.8)+4%
Welfare(103.1)(97.5)+6%
Subsidies(10.6)(14.0)-24%
Debt interest(46.6)(52.7)-12%
Gross investment(38.2)(34.8)+10%
Total spending(410.7)(403.8)+2%
    
Deficit(51.4)(51.9)-1%

Table 2 summarises how public sector net borrowing (PSNB) to fund the deficit of £51.4bn combined with borrowing of £4.4bn to fund working capital movements, student loans and other financing requirements increased debt by £55.8bn during the first four months of the financial year. As a result, public sector net debt grew to £2,745.9bn on 31 July 2024, which is £931bn or 51% more than the £1,815bn reported for 31 March 2020 at the start of the pandemic.

The ratio of net debt to GDP ratio is at the highest it has been since the 1960s, having increased by 1.3 percentage points from 98.1% on 1 April 2024 to 99.4% on 31 July 2024. Borrowing to fund the deficit was equivalent to 1.9% of GDP and other borrowing was equivalent to 0.2%, an increase of 2.1% before being offset by 0.8% from the effect of inflation and economic growth on GDP (usually referred to as ‘inflating away’). Lower inflation this year means this effect is less pronounced than in the same period last year.

Table 2: Public sector net debt and net debt/GDP

 Apr-Jul 2024
£bn
Apr-Jul 2023
£bn
PSNB51.452.3
Other borrowing4.4(11.4)
Net change55.840.9
Opening net debt2,694.12,539.7
Closing net debt2,745.92,580.6
PSNB/GDP1.9%2.0%
Other/GDP0.2%(0.4%)
Inflating away(0.8%)(1.5%)
Net change1.3%0.1%
Opening net debt98.1%95.7%
Closing net debt99.4%95.6%

Public sector net worth, the new balance sheet metric launched by the ONS last year, was -£740bn on 31 May 2024, comprising £1,613bn in non-financial assets and £1,062bn in non-liquid financial assets minus £2,746bn of net debt (£343bn liquid financial assets – £3,089bn public sector gross debt) and other liabilities of £669bn. This is a £67bn deterioration from the start of the financial year and is £123bn more negative than in July 2023.

Revisions and other matters

Caution is needed with respect to the numbers published by the ONS, which are expected to be repeatedly revised as estimates are refined and gaps in the underlying data are filled. This includes local government, where monthly data is based on budget or high level estimates in the absence of monthly data collection.

The latest release saw the ONS reduce the reported deficit for the first three months of the financial year by £1.5bn from £49.8bn to £48.3bn as estimates were revised for new data.

Q1 public finances confirm challenging position for new government

First quarter shortfall between receipts and spending of almost £50bn emphasises the significant challenges facing the Chancellor as she puts together her first Budget.

The monthly public sector finances for June 2024 released by the Office for National Statistics (ONS) on Friday 19 July 2024 reported a provisional deficit for the first three months of the 2024/25 financial year of £49.8bn, £1.1bn better than a year previously but £3.2bn worse than budgeted.

Alison Ring OBE FCA, ICAEW Director of Public Sector and Taxation, says: “This is the first set of public sector finance data since the new government was elected, and today’s numbers set out the size of the obstacle the UK’s leaders face. 

“£14.5bn was borrowed to finance the deficit in June, which although £3.2bn less than in June 2023, brought the total for the first three months of the financial year to £49.8bn, slightly worse than expectations. The latest numbers also highlighted the growing amount of public debt, which stood at 99.5% of GDP or £2,740bn on 30 June 2024. Although total debt interest was lower than last year because of the effect of lower inflation on inflation-linked debt, interest on the bulk of debt continues to rise.

“The high level of debt – and the associated interest bill – means that the new Prime Minister and Chancellor will be faced with some very difficult decisions over the coming months as they decide which elements of their programme to prioritise, and which will have to wait.”

Month of June 2024

Taxes and other receipts amounted to £88.2bn in June 2024, up 2% compared with the same month last year, while total managed expenditure was 2% lower at £102.7bn. This resulted in a reduction of £3.2bn from a fiscal deficit of £17.7bn in June 2023 to £14.5bn in June 2024.

Financial year to date

Taxes and other receipts amounted to £258.0bn in the three months to June 2024, up 1% compared with the same month last year, while total managed expenditure was 1% higher at £307.8bn. This resulted in a reduction of £1.1bn from a fiscal deficit of £50.9bn for the first quarter of 2023/24 to £49.8bn for the first quarter of 2024/25. However, this is £3.2bn more than the £46.6bn for the first quarter included in the Spring Budget 2024.

Table 1 analyses receipts for the first quarter of the financial year, highlighting how cuts to employee national insurance rates have been offset by higher income tax, corporation tax, and non-tax receipts.

Table 1: Summary receipts and spending

Three months to Jun 2024 (£bn) Jun 2023 (£bn)Change (%) 
Income tax 58.1 56.1 +4%
VAT 49.9 49.6 +1%
National insurance 39.7 43.4 -9%
Corporation tax 25.3 23.4 +8%
Other taxes 54.9 54.1 +1%
Other receipts 30.1 27.7 +9%
Total receipts 258.0 254.3 +1%
Public services (158.8) (152.6) +4%
Welfare (76.9) (73.7) +4%
Subsidies (7.8) (11.3) -31%
Debt interest (35.2) (41.1) -14%
Gross investment (29.1) (26.5) +10%
Total spending (307.8) (305.2) +1%
Deficit (49.8) (50.9) -2%

Table 1 also shows how total managed expenditure for the first quarter of £307.8bn was up by 1% compared with April to June 2023, with higher spending on public services and welfare offset by lower energy-support subsidies and lower debt interest. The reduction in the latter of £5.9bn was driven by a £9.2bn reduction in indexation on inflation-linked debt that more than offset a £3.3bn or 44% increase in interest on variable and fixed-rate debt.

Table 2: Public sector net debt

Three months toJun 2024 (£bn)Jun 2023 (£bn)
Deficit (49.8) (50.9)
Other borrowing 3.9 (7.7)
Debt movement (45.9) (58.6)
Opening net debt (2,694.1) (2,539.7)
Closing net debt (2,740.0) (2,598.3)
Net debt/GDP 99.5% 96.7%

Public sector net debt was £2,740bn or 99.5% of GDP on 30 June 2024, just under £46bn higher than at the start of the financial year. At 99.5%, the debt to GDP ratio is the highest it has been since the 1960s.

The increase in the first quarter reflects borrowing to fund the deficit of just under £50bn minus close to £4bn in net cash inflows from loan recoveries and working capital movements in excess of lending by government.

Public sector net debt is £142bn or 5% higher than a year previously, equivalent to an increase of 2.8 percentage points in relation to the size of the economy. It is £925bn or 51% more than the £1,815bn reported for 31 March 2020 at the start of the pandemic and £1,712bn or 167% more than the £1,028bn net debt amount as of 31 March 2007 before the financial crisis, reflecting the huge sums borrowed over the last two decades. 

Public sector net worth, the new balance sheet metric launched by the ONS in 2023, was -£726bn on 31 May 2024, comprising £1,613bn in non-financial assets and £1,070bn in non-liquid financial assets minus £2,740bn of net debt (£340bn liquid financial assets – £3,080bn public sector gross debt) and other liabilities of £669bn. This is a £53bn deterioration from the start of the financial year and is £77bn more negative than the -£649bn net worth number for June 2023.

Revisions and other matters

Caution is needed with respect to the numbers published by the ONS, which are expected to be repeatedly revised as estimates are refined and gaps in the underlying data are filled. 

The latest release saw the ONS increase the reported deficit for the first two months of the financial year by £1.8bn from £33.5bn to £35.3bn as estimates were revised for new data. More significantly, public sector net debt at the end of May 2024 was reduced by £16.3bn to £2,726.6bn to correct for omitted data on Bank of England repo transactions during the current financial year. This reduced the reported debt to GDP ratio for May 2024 by 0.7 percentage points from 99.8% of GDP to 99.1%.

This article was originally published by ICAEW.