ICAEW chart of the week: Global GDP

My chart for ICAEW this week looks at the relationship between population and GDP around the world.
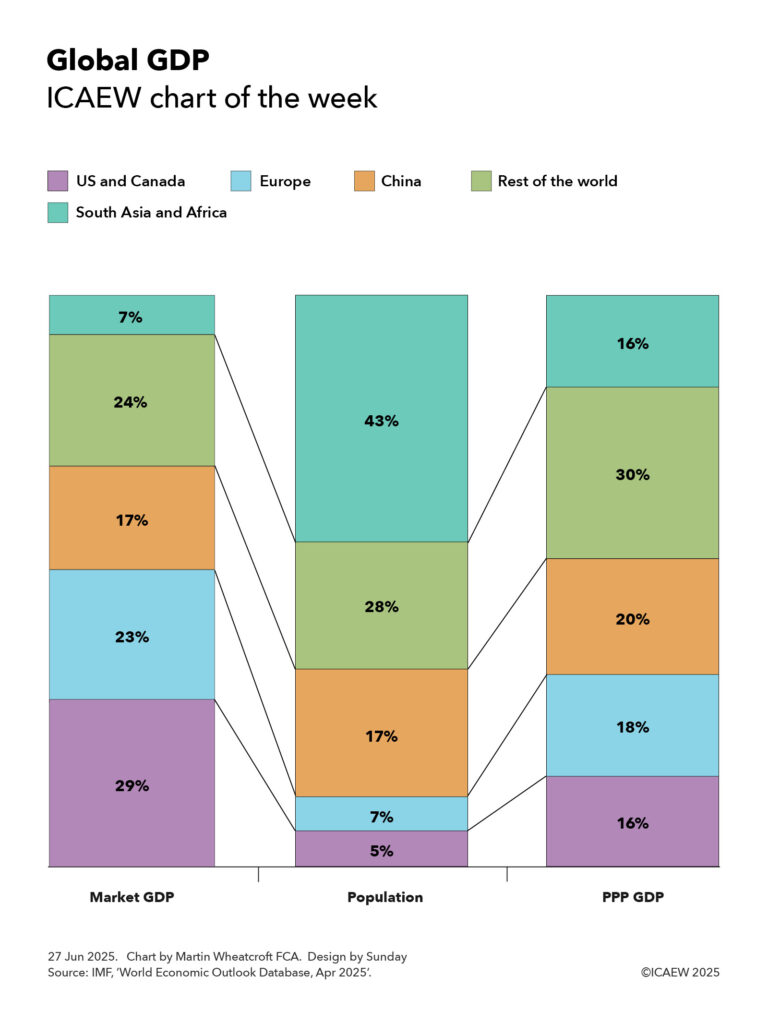
A three column chart each adding up to 100% with the central bar showing percentages of the global population, the left-hand bar showing percentages of market GDP. and the right-hand bar showing percentage of power-purchasing-parity (PPP) GDP. The bars are linked with lines to emphasise the relative proportions. 

US & Canada: Market GDP 29% - Population 5% - PPP GDP 16%. 
Europe: Market GDP 23% - Population 7% - PPP GDP 18%. 
China: Market GDP 17% - Population 17% - PPP GDP 20%.  
Rest of the world: Market GDP 24% - Population 28% - PPP GDP 30%. 
South Asia & China: Market GDP 7% - Population 43% - PPP GDP 16%. 

27 Jun 2025. Chart by Martin Wheatcroft. Design by Sunday. Source: IMF, 'World Economic Outlook Database, Apr 2025'.

According to the latest World Economic Outlook Database published by the International Monetary Fund in April 2025, the 387m people that live in the US and Canada, some 5% of the global population of 8.1bn, are together expected to generate about 29% of global economic activity as measured by GDP converted at market exchange rates in 2025. 

The US – the largest economy in the world – is expected to generate 27% with 4.3% of the global population, while Canada with 0.5% of the world’s people represents 2% of the global economy.

My chart this week also shows how the US and Canada together constitute 16% of the global economy using GDP converted on a Purchasing-Power-Parity (PPP) basis that adjusts for the relative cost of living between countries. The US is the world’s second largest economy on this basis with 15% of total economic output, while Canada represents 1.3% of the total.

Europe’s 602m people are 7% of the global population (excluding Russia, but including Georgia) and are expected to generate around 23% of global economic output at market exchange rates in 2025 or around 18% on a PPP basis. 

This includes the 452m people or 5.6% of the total living in the EU that generate 18% of global output or 14% on a PPP basis, the second largest economy on a market exchange rate basis and the third largest after adjusting for purchasing power. Germany with 1% population generates 4.3% and 3% of market GDP and PPP GDP respectively, followed by France (0.8% generating 2.9% and 2.2%), Italy (0.7% generating 2.2% and 1.8%), Spain (0.6% generating 1.6% and 1.4%), the Netherlands (0.2% generating 1.2% and 0.7%) and Poland (0.5% generating 0.9% and 1%). 

Outside the EU, the 70m people in the UK, 0.9% of the world’s total, generate 3.4% of global economic activity on a market exchange rate basis and 2.2% on a purchasing power basis.

China’s 1.4bn people constitute 17% of the world’s population and generate 17% of market GDP, in effect the average level of global economic activity on a per capita basis at current exchange rates. However, on a cost-of-living adjusted basis, they are the world’s biggest economy at 20% of PPP GDP and above average on a per capita basis.

The chart groups the rest of East Asia, South East Asia, Oceania, the Middle East, Russia, Central Asia, Latin America and the Caribbean into a ‘rest of the world’ category with 2.3bn people or 28% of the world’s population. They generate 24% of the global economy on a market exchange rate basis and 30% on a purchasing power basis.

This category includes the 10 ASEAN countries in South East Asia that together make up 8.5% of the world’s population, 3.6% of market GDP and 6.4% of PPP GDP led by Indonesia (3.5%, 1.2% and 1.4%). Others include Japan (1.5% population, 3.6% market GDP and 3.3% PPP GDP), Russia (1.5%, 2.3% and 3.5%), Türkiye (1.3%, 1.1% and 1.8%), Mexico (1.6%, 1.6% and 1.6%), South Korea (0.6%, 1.6% and 1.6%), Australia (0.3%, 1.5% and 1%), Brazil (2.6%, 1.0% and 2.4%), Taiwan POC (0.3%, 1% and 0.8%) and Saudi Arabia (0.4%, 0.8% and 1%).

The final category is South Asia and Africa, which together include many of the poorest countries on Earth, with 43% of the global population but just 7% of the global economy based on market exchange rates and 16% on a cost-of-living adjusted basis.

South Asia’s 2bn people are 24.3% of the world’s population, generating 4.4% of market GDP and 10.3% of PPP GDP. This includes India’s 1.5bn people (17.9% of the global population generating 3.6% and 8.5% respectively), the world’s fifth largest national economy at market exchange rates behind the US, China, Germany and Japan, and the third largest on a PPP basis behind China and the US. It also includes Pakistan (3% of the world’s people generating 0.3% and 0.8% of economic activity) and Bangladesh (2.1% generating 0.4% and 0.9%).

Africa’s 1.5bn people constitute 18.3% of the world’s total, generating just 2.7% of market GDP and only 5.3% of PPP GDP. This includes South Africa (0.8%, 0.4% and 0.5%), Egypt (1.3%, 0.3% and 1.1%), Nigeria (2.9%, 0.2% and 0.8%), Ethiopia (1.4%, 0.1% and 0.2%) and the Democratic Republic of the Congo (1.3%, 0.1% and 0.1%).

The chart illustrates how economic activity, both before and after adjusting for purchasing power, is weighted towards the US and Europe, while South Asia and Africa have a long way to go to become as prosperous.

While this may seem a stiff mountain to climb economically, China’s transformation over the last 30 years provides an example of what is possible, especially as ageing populations in many developed countries reduce their ability to grow as quickly as those countries with much younger demographics such as in South Asia and Africa.

As they say, watch this space.
This chart was originally published by ICAEW.

ICAEW chart of the week: BRICS+

The ICAEW chart of the week returns from its summer holidays to look at the planned expansion of BRICS from five to 11 countries.

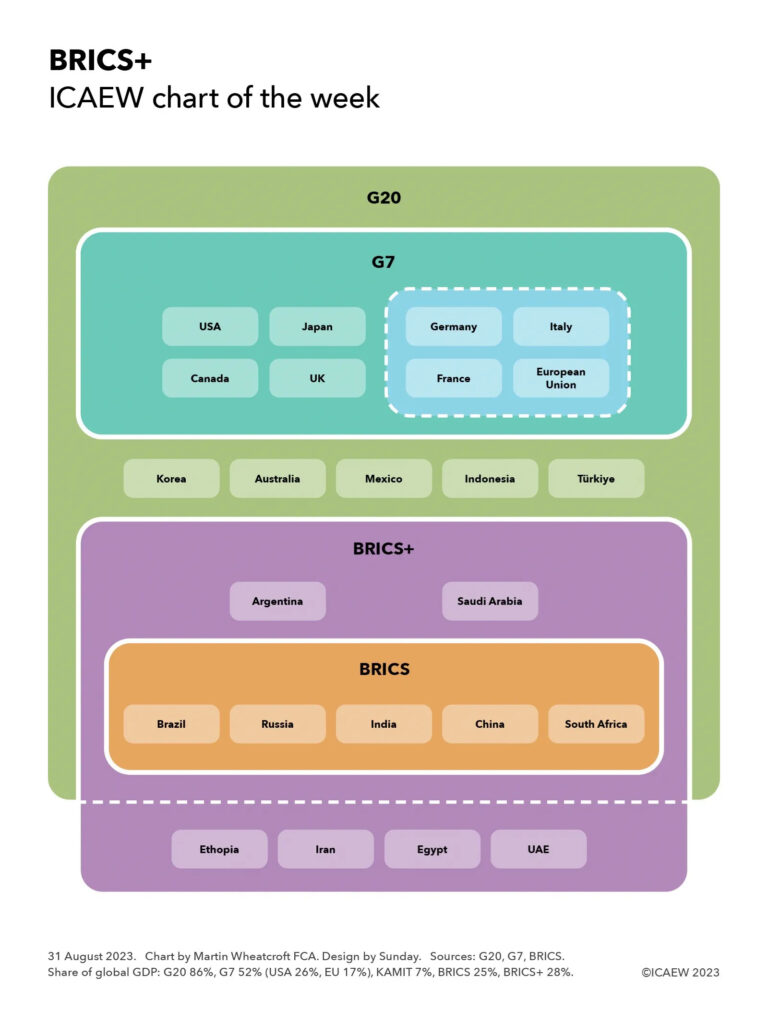
Venn diagram showing the G20, G7, BRICS, and BRICS+:

G20 in green, encompassing G7 in teal with USA, Japan, Canada and UK plus in blue with dotted line around Germany, France, Italy and the European Union (the EU members of the G7).

Then five countries in G20, but not in the G7, BRICS or BRICS+, being Korea, Australia, Mexico, Indonesia and Türkiye.

Tne BRICS+ in purple with Argentina and Saudi Arabia followed by BRICS in orange with Brazil, Russia, India, China and South Africa. Still in the BRICS+ purple, but outside the G20 green are Ethiopia, Iran, Egypt and UAE.

Sources: G20, G7, BRICS.

Footnote gives share of global GDP: G20 86%. G7 52% (USA 26%, EU 17%), KAMIT 7%, BRICS 25%, BRICS+ 28%.

“The BRICs” was originally coined by Jim O’Neill in 2001 as an abbreviation for Brazil, Russia, India and China, four fast-growing economies that he predicted would come to dominate the world economy.

This investment shorthand evolved into something more substantive in 2006 when ministers from the four countries got together on the sidelines of a meeting at the UN. Leader summits started in 2009, followed by the addition of South Africa in 2011, which resulted in the capitalisation of the final ‘s’ to form BRICS. 

BRICS has developed over time to become a counterweight to the G7, providing an alternative forum for leaders of these five major nations to discuss common concerns such as economic development, currency stability, climate change, and tackling drug trafficking and organised crime. BRICS has been increasingly important to Russia since its ejection from the G7 (then the G8) following its invasion of Crimea in 2014 and to China as relations with the G7 have deteriorated over the last decade.

The most recent summit (the 15th) was on 22-24 August 2023, at which it was announced that six additional countries would be joining on 1 January 2024 to bring the number of members to 11.

Our chart this week takes the form a Venn diagram to illustrate how BRICS, and the expanded “BRICS+” grouping (pending a new official name), fit with two other major intergovernmental organisations where leaders meet on a regular basis – the G7 and the G20.

It starts with the G20, a grouping of 19 nations and the European Union that together represent 86% of the global economy. Within this sit the eight members of the G7 group of advanced economies, representing 52% of the global economy: the USA (26%), Japan (4%), the UK (3%), Canada (2%), Germany (4%), France (3%), Italy (2%) and the European Union (17% including Germany, France and Italy). The five BRICS nations represent 25% of the global economy comprising: Brazil (2%), Russia (1.7%), India (4%), China (17%) and South Africa (0.4%).

The diagram is complicated by the expanded BRICS+ as although invitees Argentina (0.6%) and Saudi Arabia (1.0%) are also members of the G20, the other four new members – Ethiopia (0.2%), Iran (0.3%), Egypt (0.3%) and the United Arab Emirates (0.5%) – are outside the G20. These new members together represent 3% of the global economy, taking the expanded BRICS+ to 28%.

Squeezed between the G7 and BRICS+ are five G20 members that together make up around 7% of the global economy that are not in either grouping, being (South) Korea (1.6%), Australia (1.6%), Mexico (1.8%), Indonesia (1.4%) and Türkiye (0.8%). As yet there is no sign of an intergovernmental organisation for these “KAMIT” nations to complement the G7 and BRICS, although in practice they are often invited as guests to G7 summits in addition to their participation in meetings of the G20.

The attraction of intergovernmental forums such as the G7, BRICS and the G20 is that they enable national leaders to engage directly with their counterparts on a wide range of topics, in contrast to the often narrower focus and more formal diplomatic structures of treaty-based international organisations such as the Organisation for Economic and Co-operation Development (OECD), the World Bank or the Organisation of American States (OAS) for example.

Their informal nature gives national leaders more flexibility to (for example) change their memberships without lengthy treaty negotiations or to work together on pressing issues of mutual concern. However, that informality also makes it difficult to create binding resolutions, which is perhaps why the global alternative reserve currency proposed at the first BRICS summit in 2009 had still not been implemented by the time of the 15th summit this August. 

Read more: G20G7BRICS.