Our chart this week takes a look at the balance sheet of the European Central Bank, the central bank for the Eurozone.
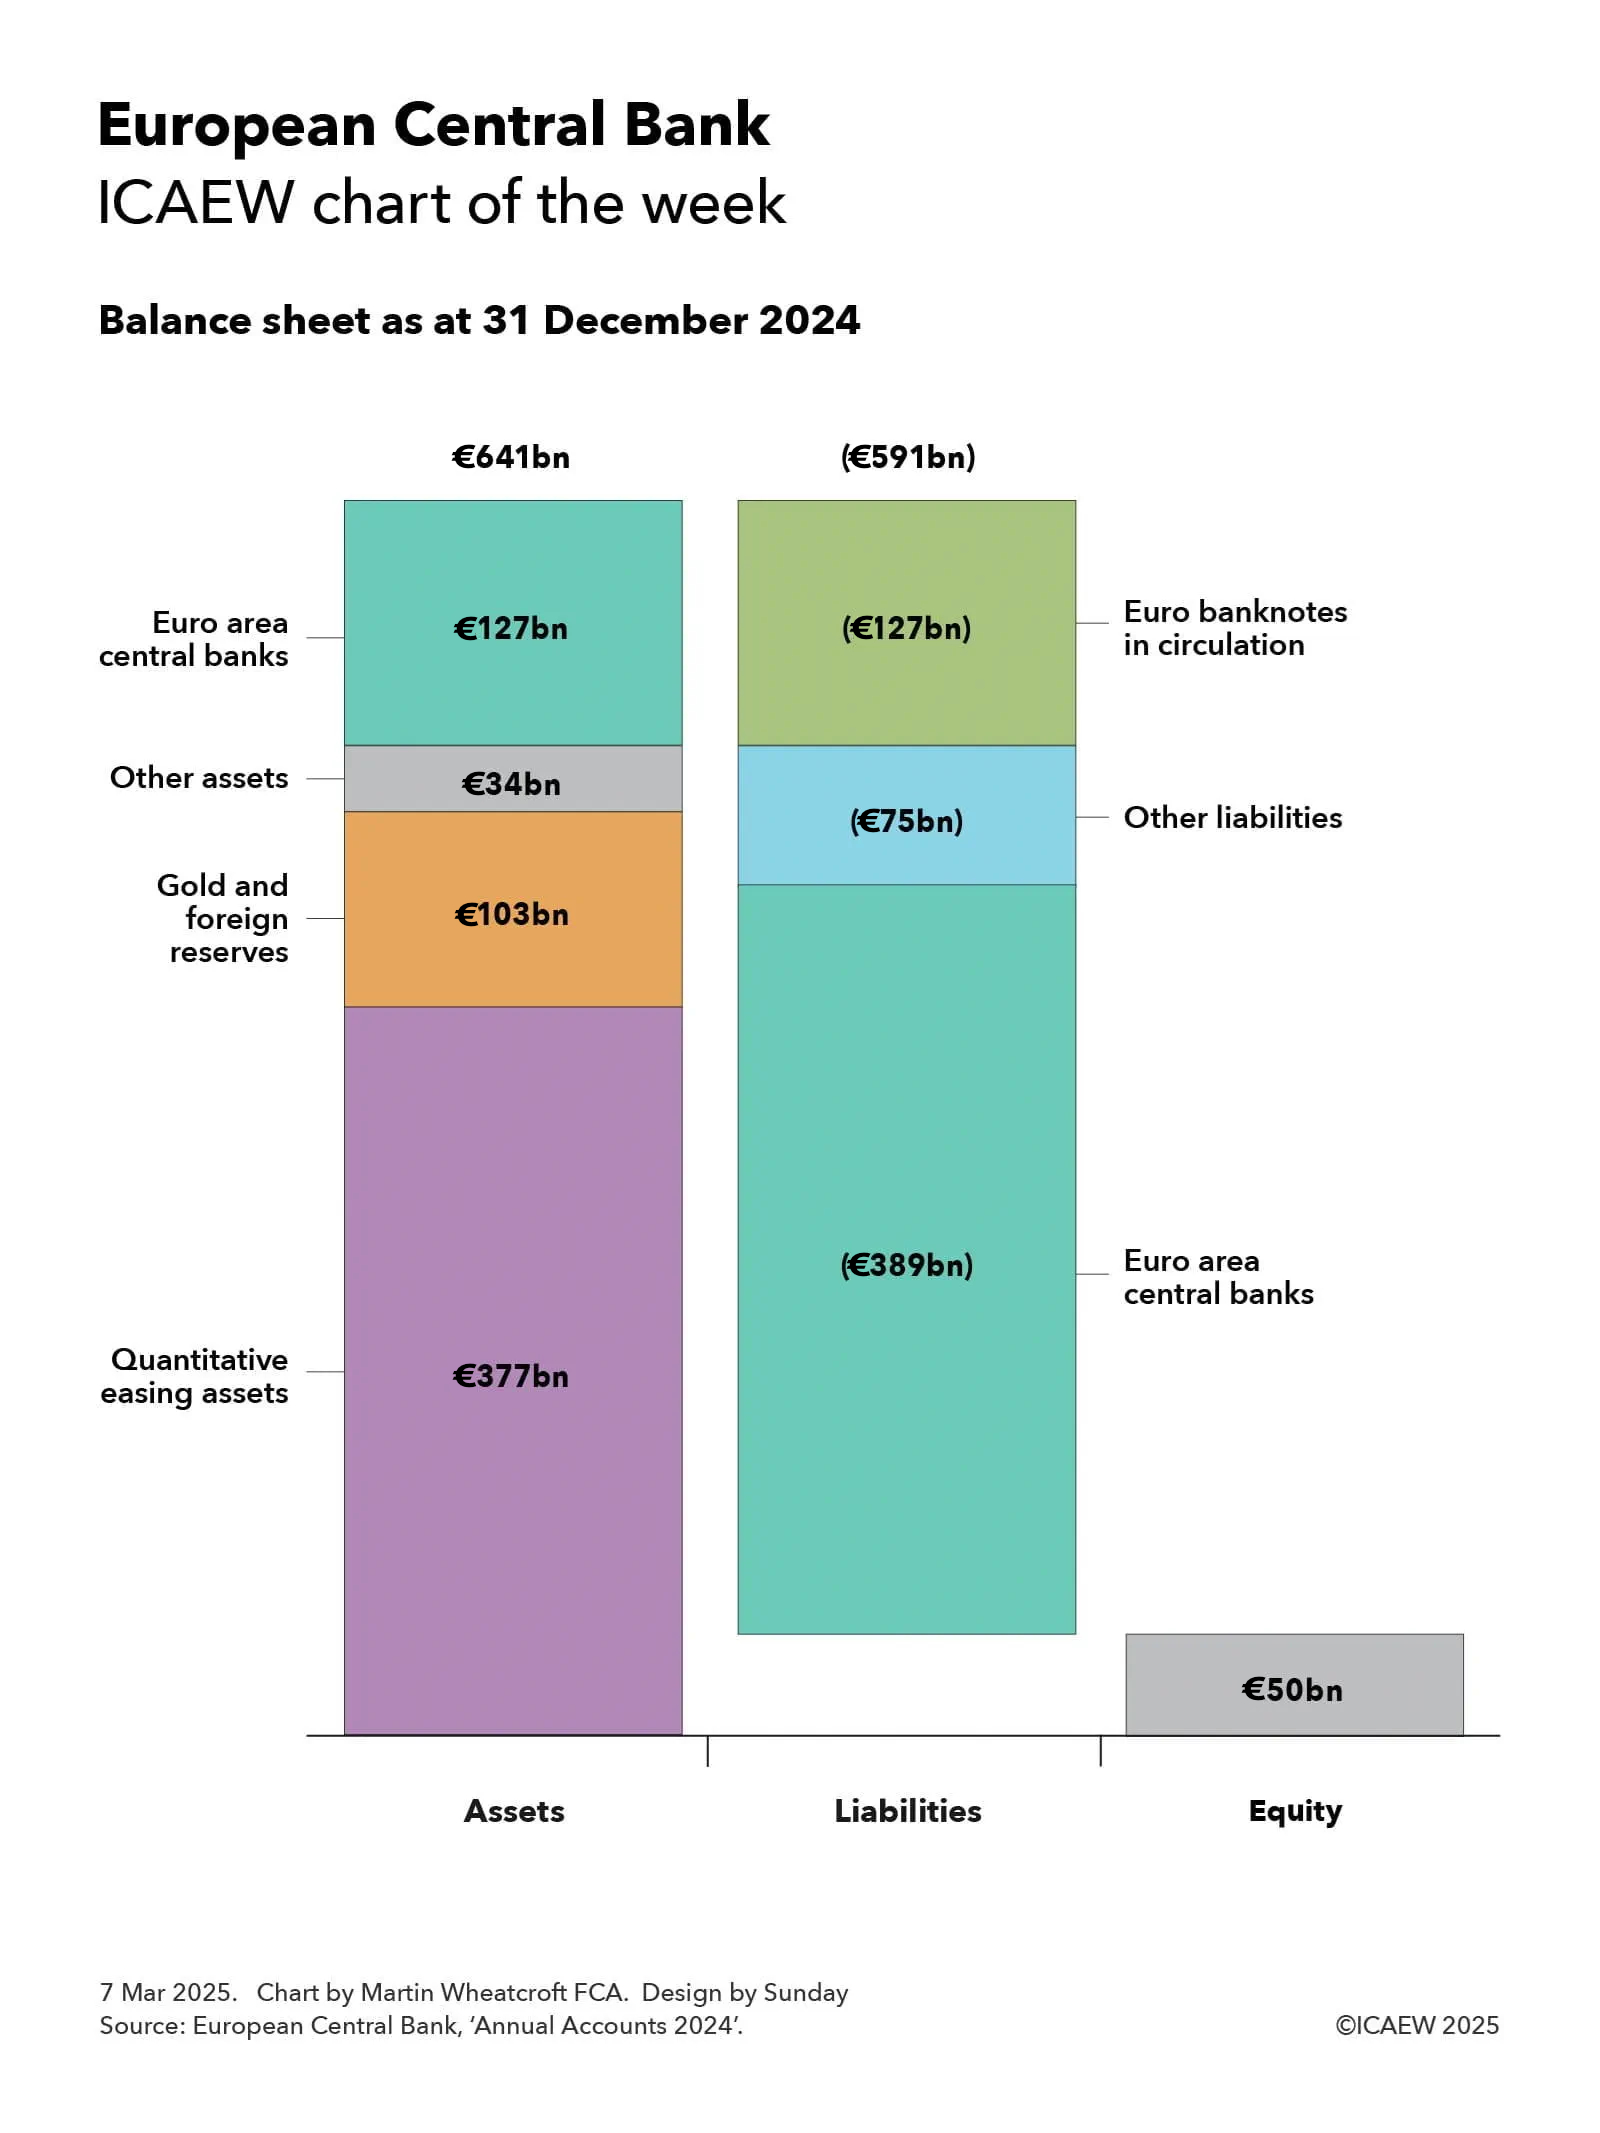
The latest annual report for the European Central Bank (ECB) presents a balance sheet with €641bn in assets, €591bn in liabilities and €50bn in equity.
As our chart illustrates, the ECB’s assets on 31 December 2024 comprised €377bn in quantitative easing assets, €103bn in gold and foreign reserves, €34bn in other assets, and €127bn in amounts owed by central banks in exchange for euro banknotes in circulation.
Liabilities comprised €127bn in euro banknotes in circulation, €75bn in other liabilities, and €389bn in net amounts owed to central banks.
Quantitative easing (QE) assets of €377bn comprise €349bn in government securities and €28bn in private sector securities purchased as part of the ECB’s QE programme to support the European economy during and following the financial crisis (of which €221bn remains on the ECB balance sheet) and during the pandemic (€156bn). These are recorded at amortised cost and so do not reflect mark-to-market losses of €35bn at the balance sheet date. This is just a small part of the overall QE programme involving euro area national central banks that amounted to €4.3tn at the end of 2024.
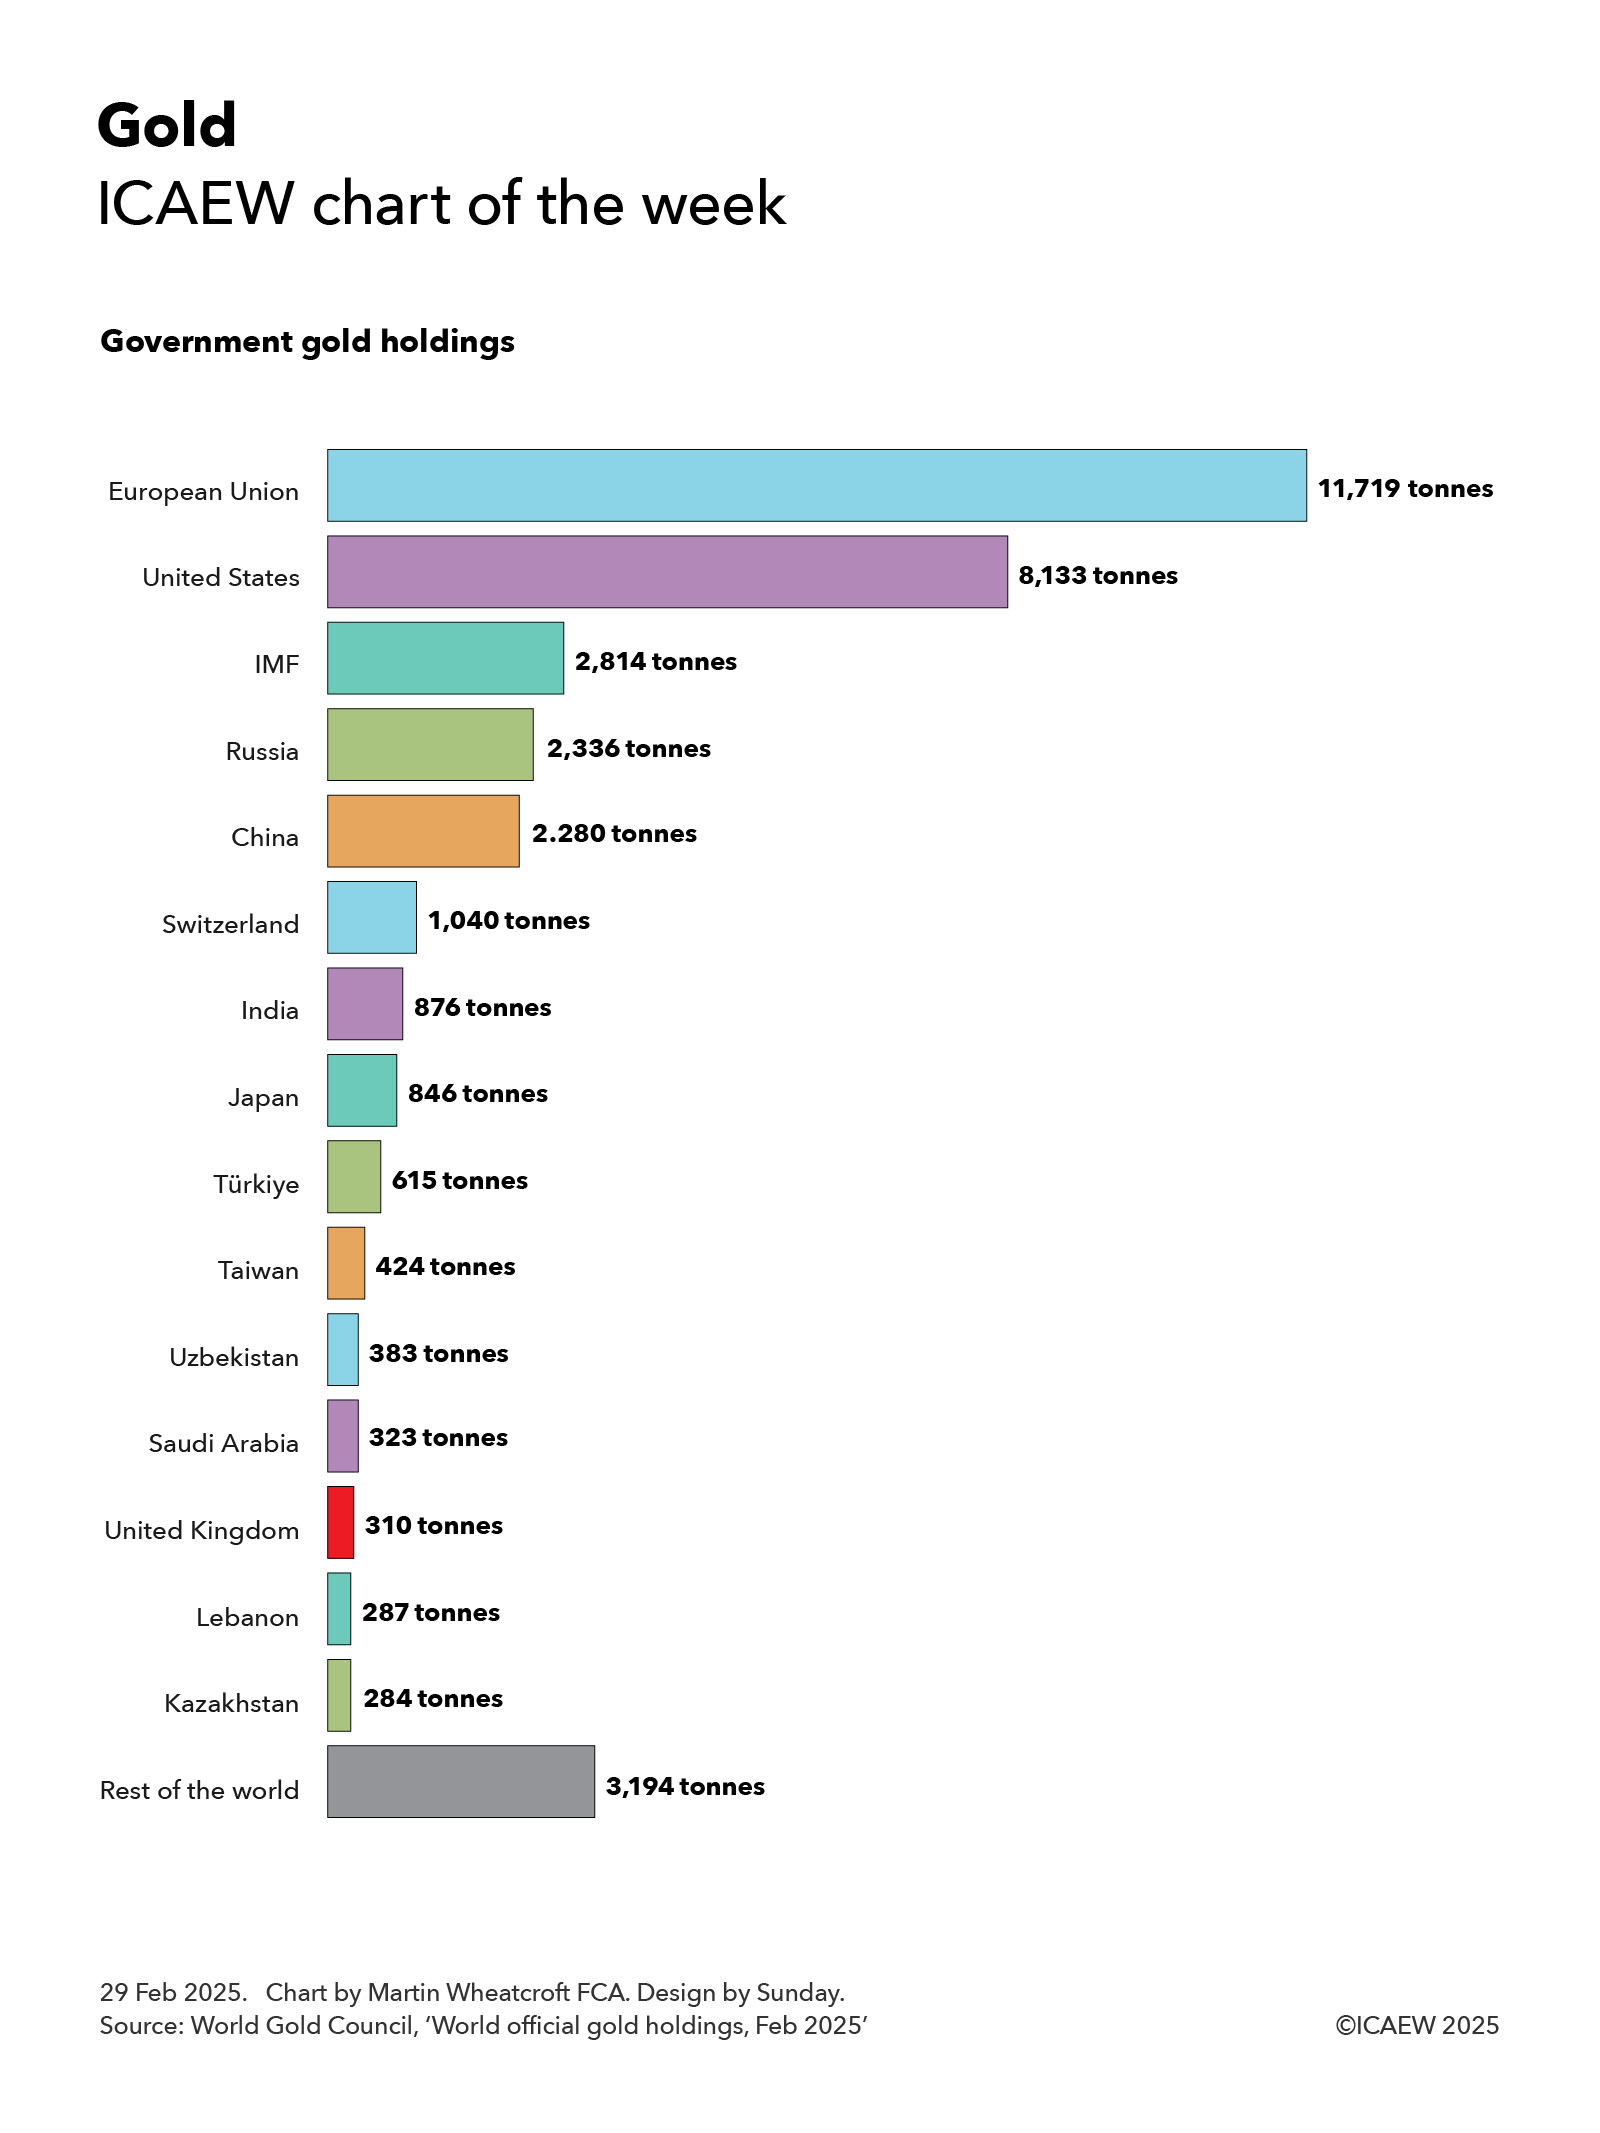
Gold and foreign reserve assets of €103bn comprised 506.5 tonnes of gold valued at €41bn, €56bn in foreign currency deposits and securities, a €2bn receivable from the IMF, and €4bn in foreign currency deposits with commercial banks in the euro area.
Other assets of £34bn comprised €23bn in ‘own fund’ investments, €9bn in accrued interest, €1bn in net derivative and collateral balances, and €1bn in tangible fixed assets.
The ECB’s €127bn in banknotes in circulation represents the ECB’s 8% share of the €1,588bn total that was in circulation on 31 December 2024, with the balance recorded in national central bank balance sheets. According to the ECB, the overall total comprised 238m €500 notes in circulation worth €119bn, 850m €200 notes worth €170bn, 4.1bn €100 notes worth €408bn, 15bn x €50 euro notes worth €750bn, 4.9bn €20 notes worth €99bn, 3.2bn €10 notes worth €32bn, and 2.3bn €5 notes worth €11bn (numbers don’t add due to rounding).
Other liabilities of €75bn comprised €34bn in European Commission deposits, €25bn in commercial bank and other non-central bank deposits, €3bn owed to non-euro area national central banks, €5bn relating to monetary operations, and €8bn in accruals, deferred income, pension obligations and sundry liabilities.
Amounts owed to euro area central banks of €389bn consisted of €41bn owed for foreign reserve assets transferred to the ECB from when countries joined the euro, and €348bn in net deposits held by national central banks (€1,593bn in deposits offset by €1,245bn in negative balances).
Equity of €50bn comprised paid-in capital of €9bn, mainly from eurozone central banks, but with a small amount from non-euro area central banks too, €37bn in revaluation gains on the ECB’s gold holdings, and €13bn in translation gains on foreign currency assets (principally the US dollar), less accumulated losses of €9bn.
The balance sheet has shrunk since the previous year, with assets lower by €32bn and liabilities down €37bn, a net gain of €5bn to equity during 2024 that consisted of revaluation gains of €13bn less a loss of €8bn. The shrinkage primarily relates to the winding down of quantitative easing holdings, principally through a ‘passive’ strategy of not reinvesting the principal as each security matures.
The ECB lost money in 2023 and 2024 as a consequence of rising interest rates on deposit liabilities, following many years of profitability during which member central banks received dividends. These losses are expected to fall as interest rates reduce and the unwinding of QE reduces the level of deposits on which interest is payable. It is likely to be a while before dividends resume as the ECB is expected to prioritise rebuilding its risk provisions first.