ICAEW chart of the week: The start of a new fiscal year

My first chart of the financial year starting 1 April 2026 for ICAEW looks at the government’s £1.4tn budget for 2026/27.

ICAEW chart of the week: The start of a new fiscal year. 

A step chart showing budgeted receipts and spending for 2026/27. 

Receipts £1,304bn = Top 10 taxes £1,050bn + Other taxes £121bn + Other receipts £133bn. 

Borrowing £115bn = deficit £115bn. 

Spending £1,419bn = Health and welfare £749bn + Education £151bn + Public services £388bn + Interest £131bn. 

2 Apr 2026. Chart by Martin Wheatcroft FCA. 
Sources: HMT, Autumn Budget 2025; OBR, Spring Forecast 2026.

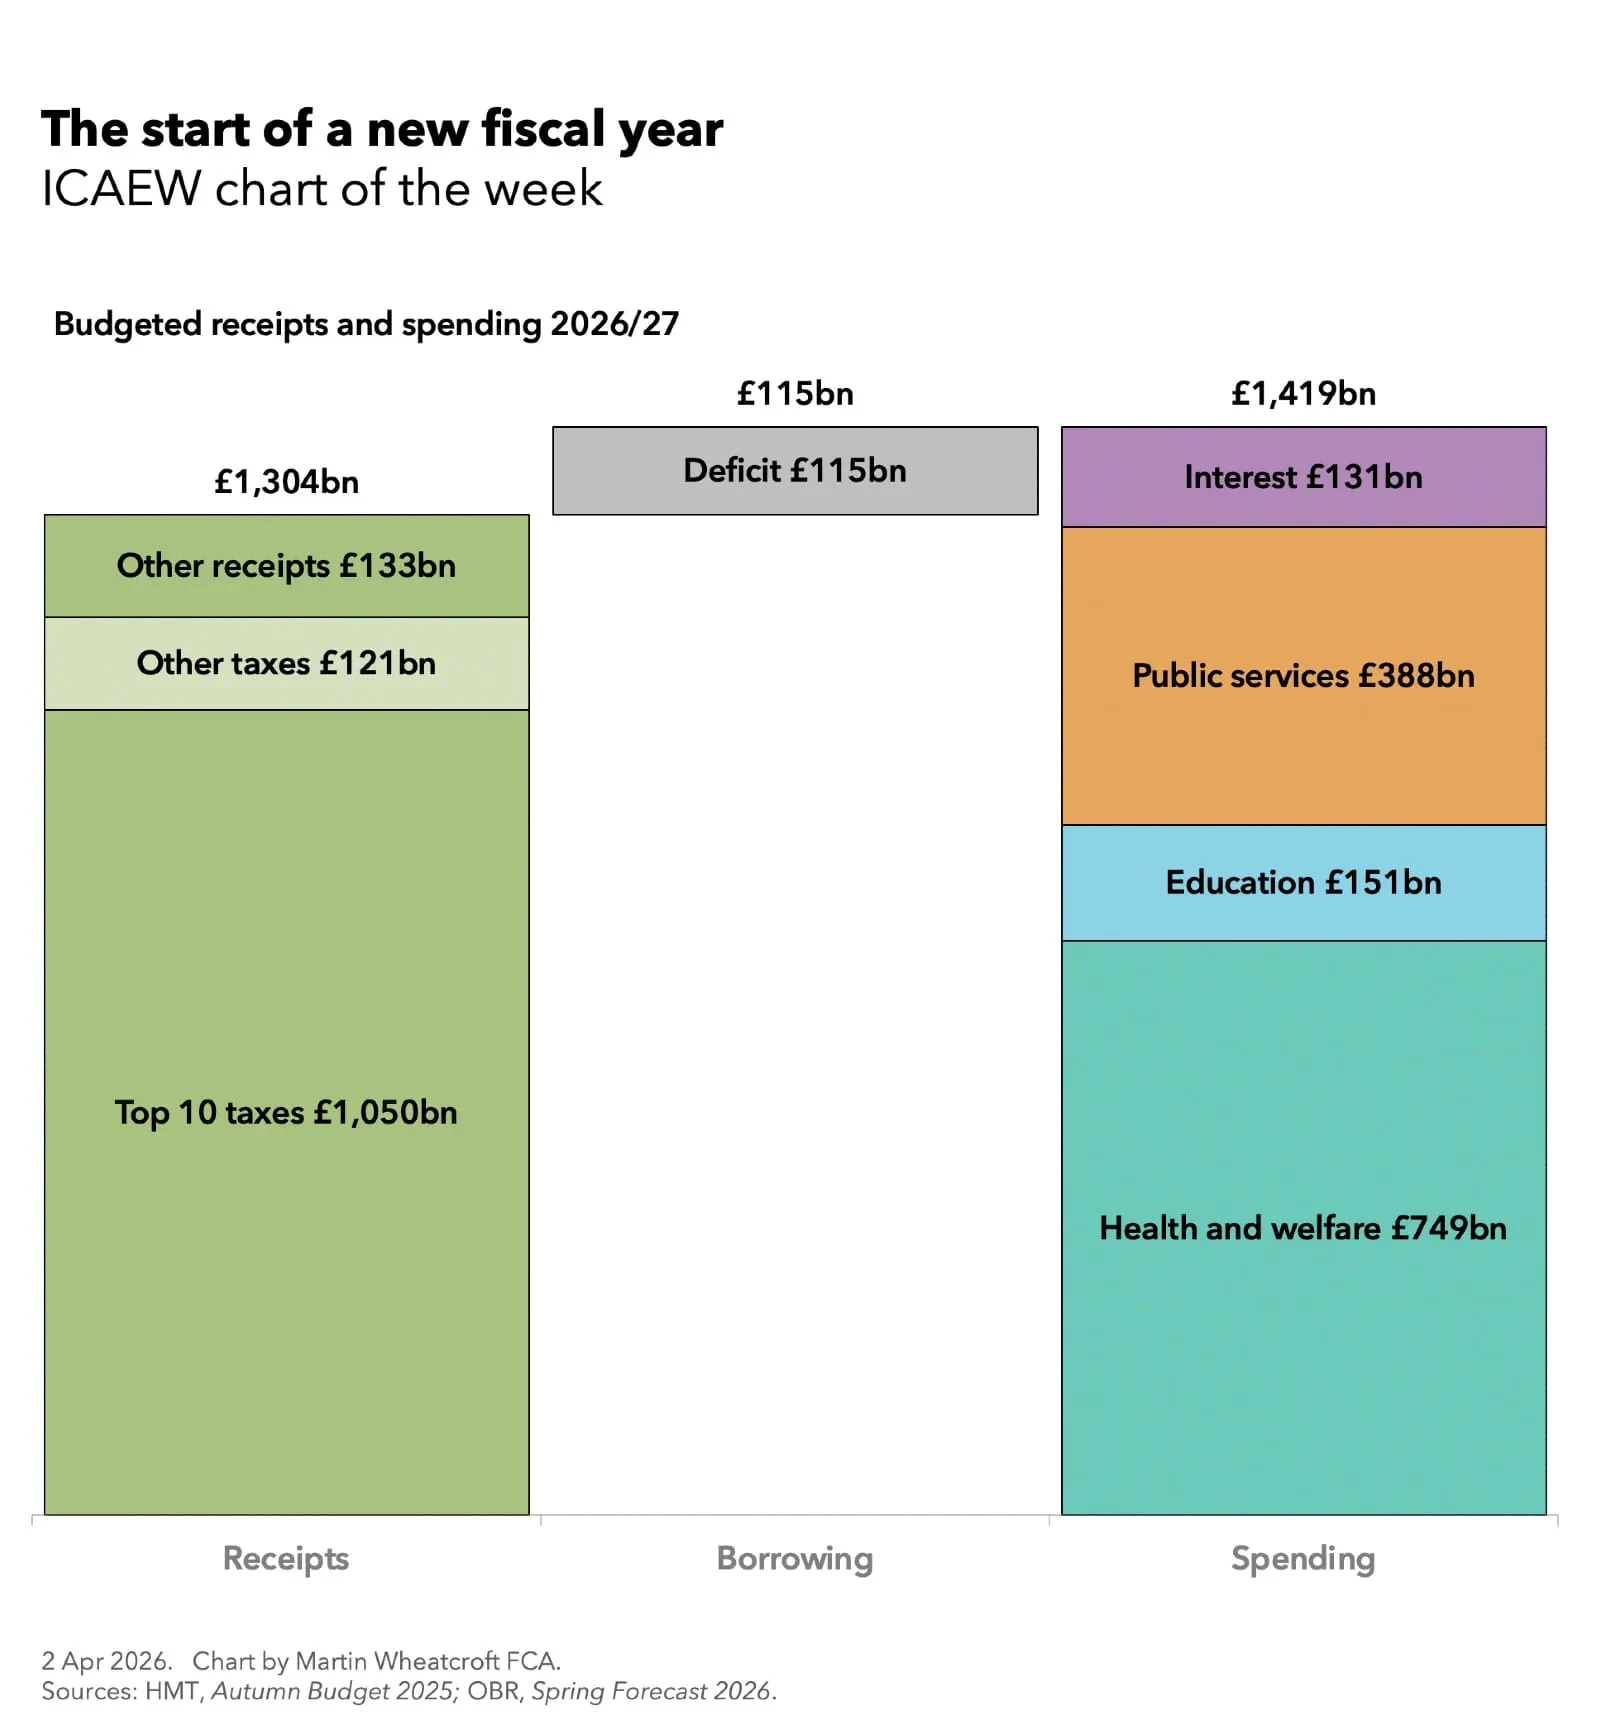
My chart fir ICAEW this week is on the public sector budget for the 2026/27 financial year which began on 1 April 2026, showing how there is expected to be a shortfall of £116bn between anticipated receipts of £1,304bn and planned spending of £1,419bn.

This is equivalent to a deficit of 3.6% of GDP, calculated as receipts of 41.2% of GDP less total managed expenditure of 44.8% of GDP.

The chart highlights how the top 10 taxes are expected to generate £1,050bn (81% of total receipts), with all other taxes contributing £121bn (9%) and other receipts generating £133bn (10%). 

The top 10 taxes comprise: income tax which generates £360bn, VAT (£220bn), employer national insurance (£155bn), corporation tax (£102bn), employee and self-employed national insurance (£57bn), council tax (£54bn), business rates (£37bn), fuel duties (£24bn), capital gains tax (£21bn) and property transaction taxes (stamp duty in England) generating £20bn. 

The remaining £121bn of tax receipts comprises £84bn from the next 10 largest taxes: environmental duties (£16bn), alcohol duties (£13bn), vehicle excise duty (£10bn), inheritance tax (£9bn), insurance premium tax (£9bn), tobacco duties (£7bn), air passenger duty (£5bn), stamp duty on shares (£5bn), customs duties (£5bn) and the apprenticeship levy (£5bn), and £37bn from all other taxes and duties.

Other receipts comprise £87bn from operating surpluses (including social housing rents and the profits of public corporations), £43bn in interest and dividends (on investments and cash balances), and £3bn other receipts.

On the spending side, the chart illustrates how the £749bn budgeted for health and welfare is more than half of the total (approximately 53%), while education spending is budgeted to be £151bn (11%), public services outside of health, social care and education amount to £388bn (27%) and interest is forecast to be £131bn (9%).

Health and welfare spending comprises £401bn on welfare (including the state pension), £294bn on health (principally the NHS), and social care provision of £54bn. Budgeted spending on public services outside of health, social care and education include defence and security of around £70bn, transport £69bn, public order and safety £62bn, industry, agriculture and employment £56bn, and housing and environment £51bn, together with £80bn across the hundreds of other public services provided by central and local government.

The planned borrowing to fund the deficit of £116bn, the difference between receipts and total managed expenditure, excludes £15bn in other borrowing to fund government lending activities and working capital movements, with public sector net debt scheduled to rise above £3tn during the coming financial year. 

The problem for the Chancellor – and for all of us – is that the actual numbers for 2026/27 could be significantly worse from the budgeted amounts presented in our chart. Not only is she already under significant pressure to increase defence spending and alleviate student loans (amongst many other spending challenges), but the conflict with Iran will make the situation even more challenging for both the government and the nation.

On that cheery note, we would like to wish you all the best for the new (financial) year. 

This chart was originally published by ICAEW.

ICAEW chart of the week: Council tax in England 2026/27

My chart for ICAEW this week celebrates the start of a new financial year by looking at the average level of council tax across England.

ICAEW chart of the week: Council tax in England 2026/27. 

A line chart showing council tax rates in England across 296 local billing authorities. 

Average council tax per dwelling per month (national average) - a horizontal dotted purple line of £156 per month. 

Average council tax per dwelling per month - a solid purple line marked with £82 for Wandsworth curving up very quickly and then fairly straight through Islington to cross the national average council tax per dwelling line to the left of Castle Point before curving up again from Stroud onwards to hit £244 for Elmbridge. 

Band D council tax per month (national average) - a dotted teal line of £199 per month. 

Band D council tax per month - a solid teal line jumping up and down centred on the national average, with five points where it goes below the £156 per dwelling average. 

27 March 2026. Chart by Martin Wheatcroft FCA. Source: Ministry of Housing, Communities & Local Government, Council tax in England 2026/27.

My chart for ICAEW this week illustrates the average council tax payable per dwelling by local billing authority in 2026/27, ranging from £82 per month in Wandsworth, £137 per month in Islington, £159 per month in Castle Point in Essex, £178 per month in Stroud, Gloucestershire, and £244 per month (£2,927 for the year) in Elmbridge in Surrey.

These compare with an average council tax per dwelling across England in 2026/27 of £156 per month, a 5.5% increase over 2025/26. This is based on a total amount of council tax of £46.8bn to be raised by 296 local billing authorities divided by approximately 25.1m residential dwellings in England.

Our chart also illustrates how the relationship between the average council tax per dwelling in each local authority area and the amount payable on a Band D property can vary significantly based on the proportions of residential properties in each band (based on 1991 property values). In some areas there are more Band E, F, G and H properties, which pay 22%, 44%, 67% and twice the amount payable on a Band D property respectively, while in others there are more Band A, B and C properties that pay 33%, 22% and 11% less respectively.

Overall, the national average per dwelling amount is 22% less than the headline rate of council tax on a Band D property of £199 per month, reflecting the approximately two-thirds of properties that are in Bands A to C nationally.

In the five highlighted local authorities, the average council tax per dwelling is 5% less, 22% less, 18% less, 14% less and £15% more respectively than their Band D rates of £86 per month in Wandsworth, £176 in Islington, £193 in Castle Point, £208 in Stroud, and £213 per month in Elmbridge.

The 296 billing authorities comprise 32 London boroughs and the City of London, 36 metropolitan boroughs, 62 unitary authorities and the Isle of Scilly, and 164 district councils. They raise council tax on behalf of themselves and (as appropriate) the Greater London Authority, 37 territorial police forces outside London, 29 fire and rescue authorities outside London, 12 regional combined authorities, and 21 county councils. They also raise precepts for just under 9,000 town and parish councils, mostly in rural areas.

Council tax in Wales

Not included in the chart are council tax bills for 2026/27 in Wales, where the average council tax per dwelling is £173 per month for its 22 principal councils, which raise £3.0bn in council tax from 1.4m dwellings for themselves, the four Welsh territorial police forces and around 730 community councils.

The average council tax per dwelling ranges from £137 per month in Caerphilly to £175 per month in Wrexham and £226 per month in Monmouthshire, respectively 21% less, 9% less and 12% more than the Band D rates in those councils of £174, £192 and £201 per month respectively. The national average of £173 per month is 9% less than the average Band D rate across Wales of £190 per month.

The variations reflect the differing proportions of residential properties in each band in each principal council area (based on 2003 property values), as well as the Welsh additional Band I that pays 17% more than a Band H property.

Changes ahead for councils

Back in England, the big development is the planned abolition over the next three years of the remaining county and district councils. The replacement of these two tiers with unitary authorities should establish a single principal tier of local government across the whole of England, while the gradual extension of regional combined authorities to cover more of the country should enable further devolution of responsibilities from Whitehall to the regions.

Although the rise in council bills will be unwelcome to many, the reality is that many if not most local authorities in both England and Wales are struggling financially, with the growing cost of local welfare provision (especially adult social care, child social care and homelessness) combined with limits on funding from central government continuing to squeeze budgets for local public services.

Whether the Chancellor’s proposed devolution of a share of income tax receipts to the English regions will make a significant difference to the financial health of local government remains to be seen.

For further information on council tax by local authority in England and Wales in 2026/27 visit the MHCLG council tax webpage and the Welsh government council tax webpage respectively.

This chart was originally published by ICAEW.