My chart for ICAEW this week looks at how public investment in assets is expected to increase over the next couple of years as the government seeks to stimulate the economy and “build build build”.
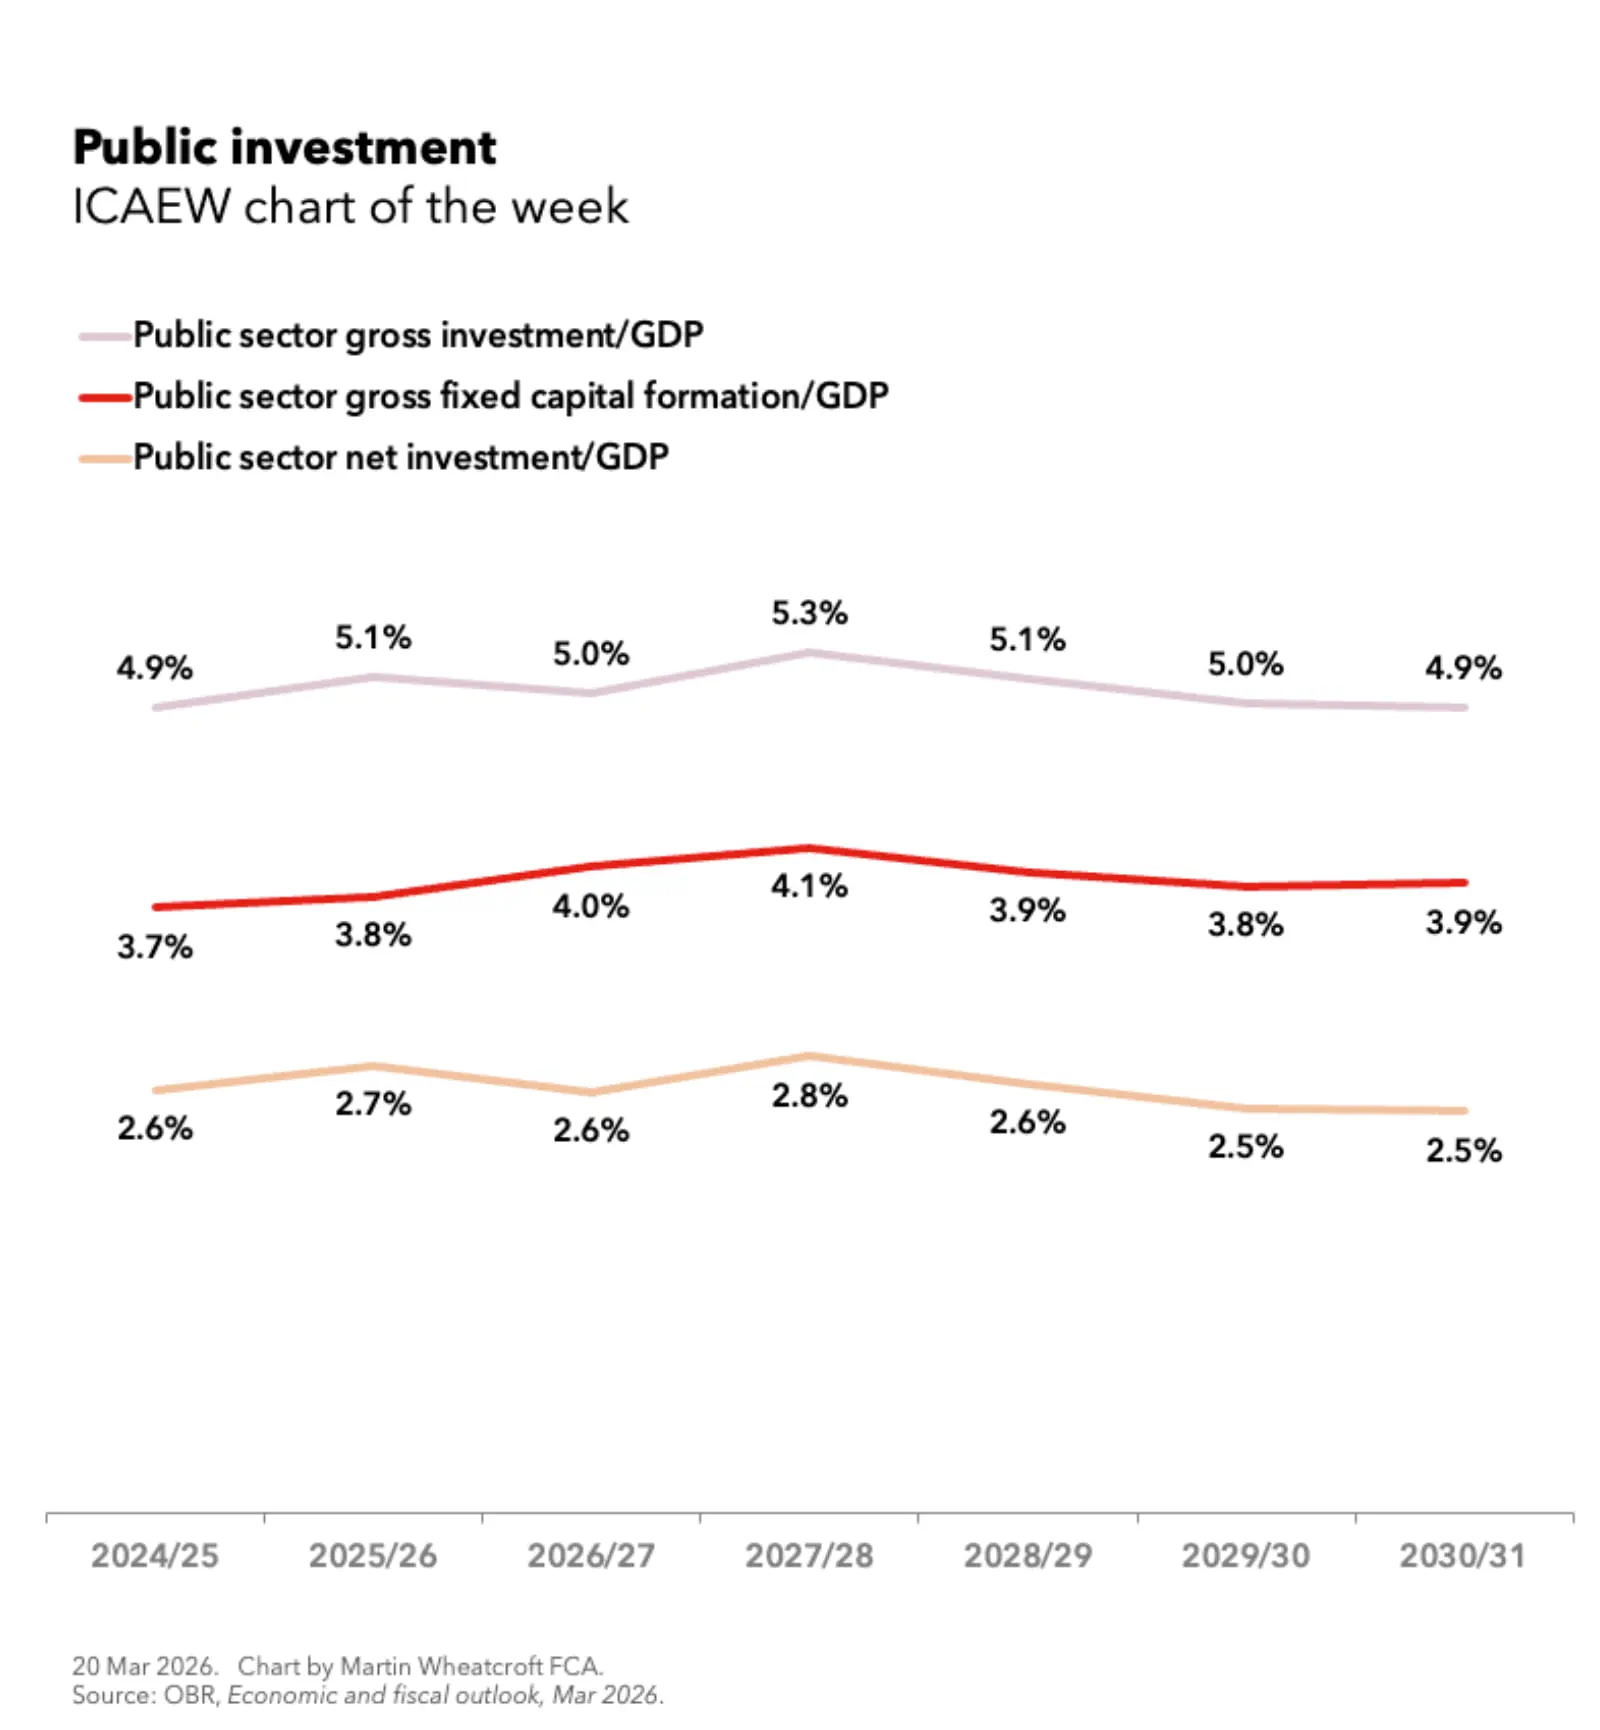
According to the Office for Budget Responsibility’s latest fiscal forecasts, public sector gross capital formation – the statistical equivalent of capital expenditure – is expected to increase as a share of the economy from 3.7% and 3.8% of GDP in the years ending 31 March 2025 and 2026 (2024/25 and 2025/26 respectively) to 4.0% and 4.1% in 2026/27 and 2027/28, before falling to 3.9%, 3.8% and 3.9% in 2028/29, 2029/30 and 2029/31.
My chart for ICAEW this week shows this trend, together with the headline percentages of public sector gross investment/GDP and public sector net investment/GDP. The former is expected to bounce around 5% of GDP – going from 4.9% in 2024/25 to 5.1%, 5.0%, 5.3%, 5.1%, 5.0% and then 4.9% in 2030/31. The latter is expected to go from 2.6% in 2024/25 to 2.7%, 2.6%, 2.8%, 2.6%, 2.5% and 2.5% in 2030/31.
Public sector gross investment is higher than gross capital formation because it also includes capital grants, research and development funding, and student loan impairments in addition to capital expenditure on infrastructure and other fixed assets.
Public sector net investment is equal to public sector gross investment less depreciation, to give an idea of much is new investment after taking account of the usage of existing assets.
The increase in public sector gross fixed capital formation – from £116bn in 2025/26 to £125bn in the coming financial year starting on 1 April 2026 (2026/27) and then to £134bn in the following financial year (2027/28) – is a substantial expansion in the level of public sector capital expenditure.
These increases, of 6% and 5% respectively over the next two years after adjusting for inflation, should be positive for an economy that needs every boost that it can get. If it can help unlock incremental private sector investment too, the economic benefit could be even greater.
The challenge is that while additional investment is welcome, this is not a transformative change, especially as the increase as a share of the economy is not expected to be sustained beyond the first couple of years of the forecast period.
The expectation of many commentators was that the Chancellor was hoping for improvements in the economy to allow her to pencil in further increases in 2028/29 and beyond. Recent events suggest this hope may be less likely than it once was.