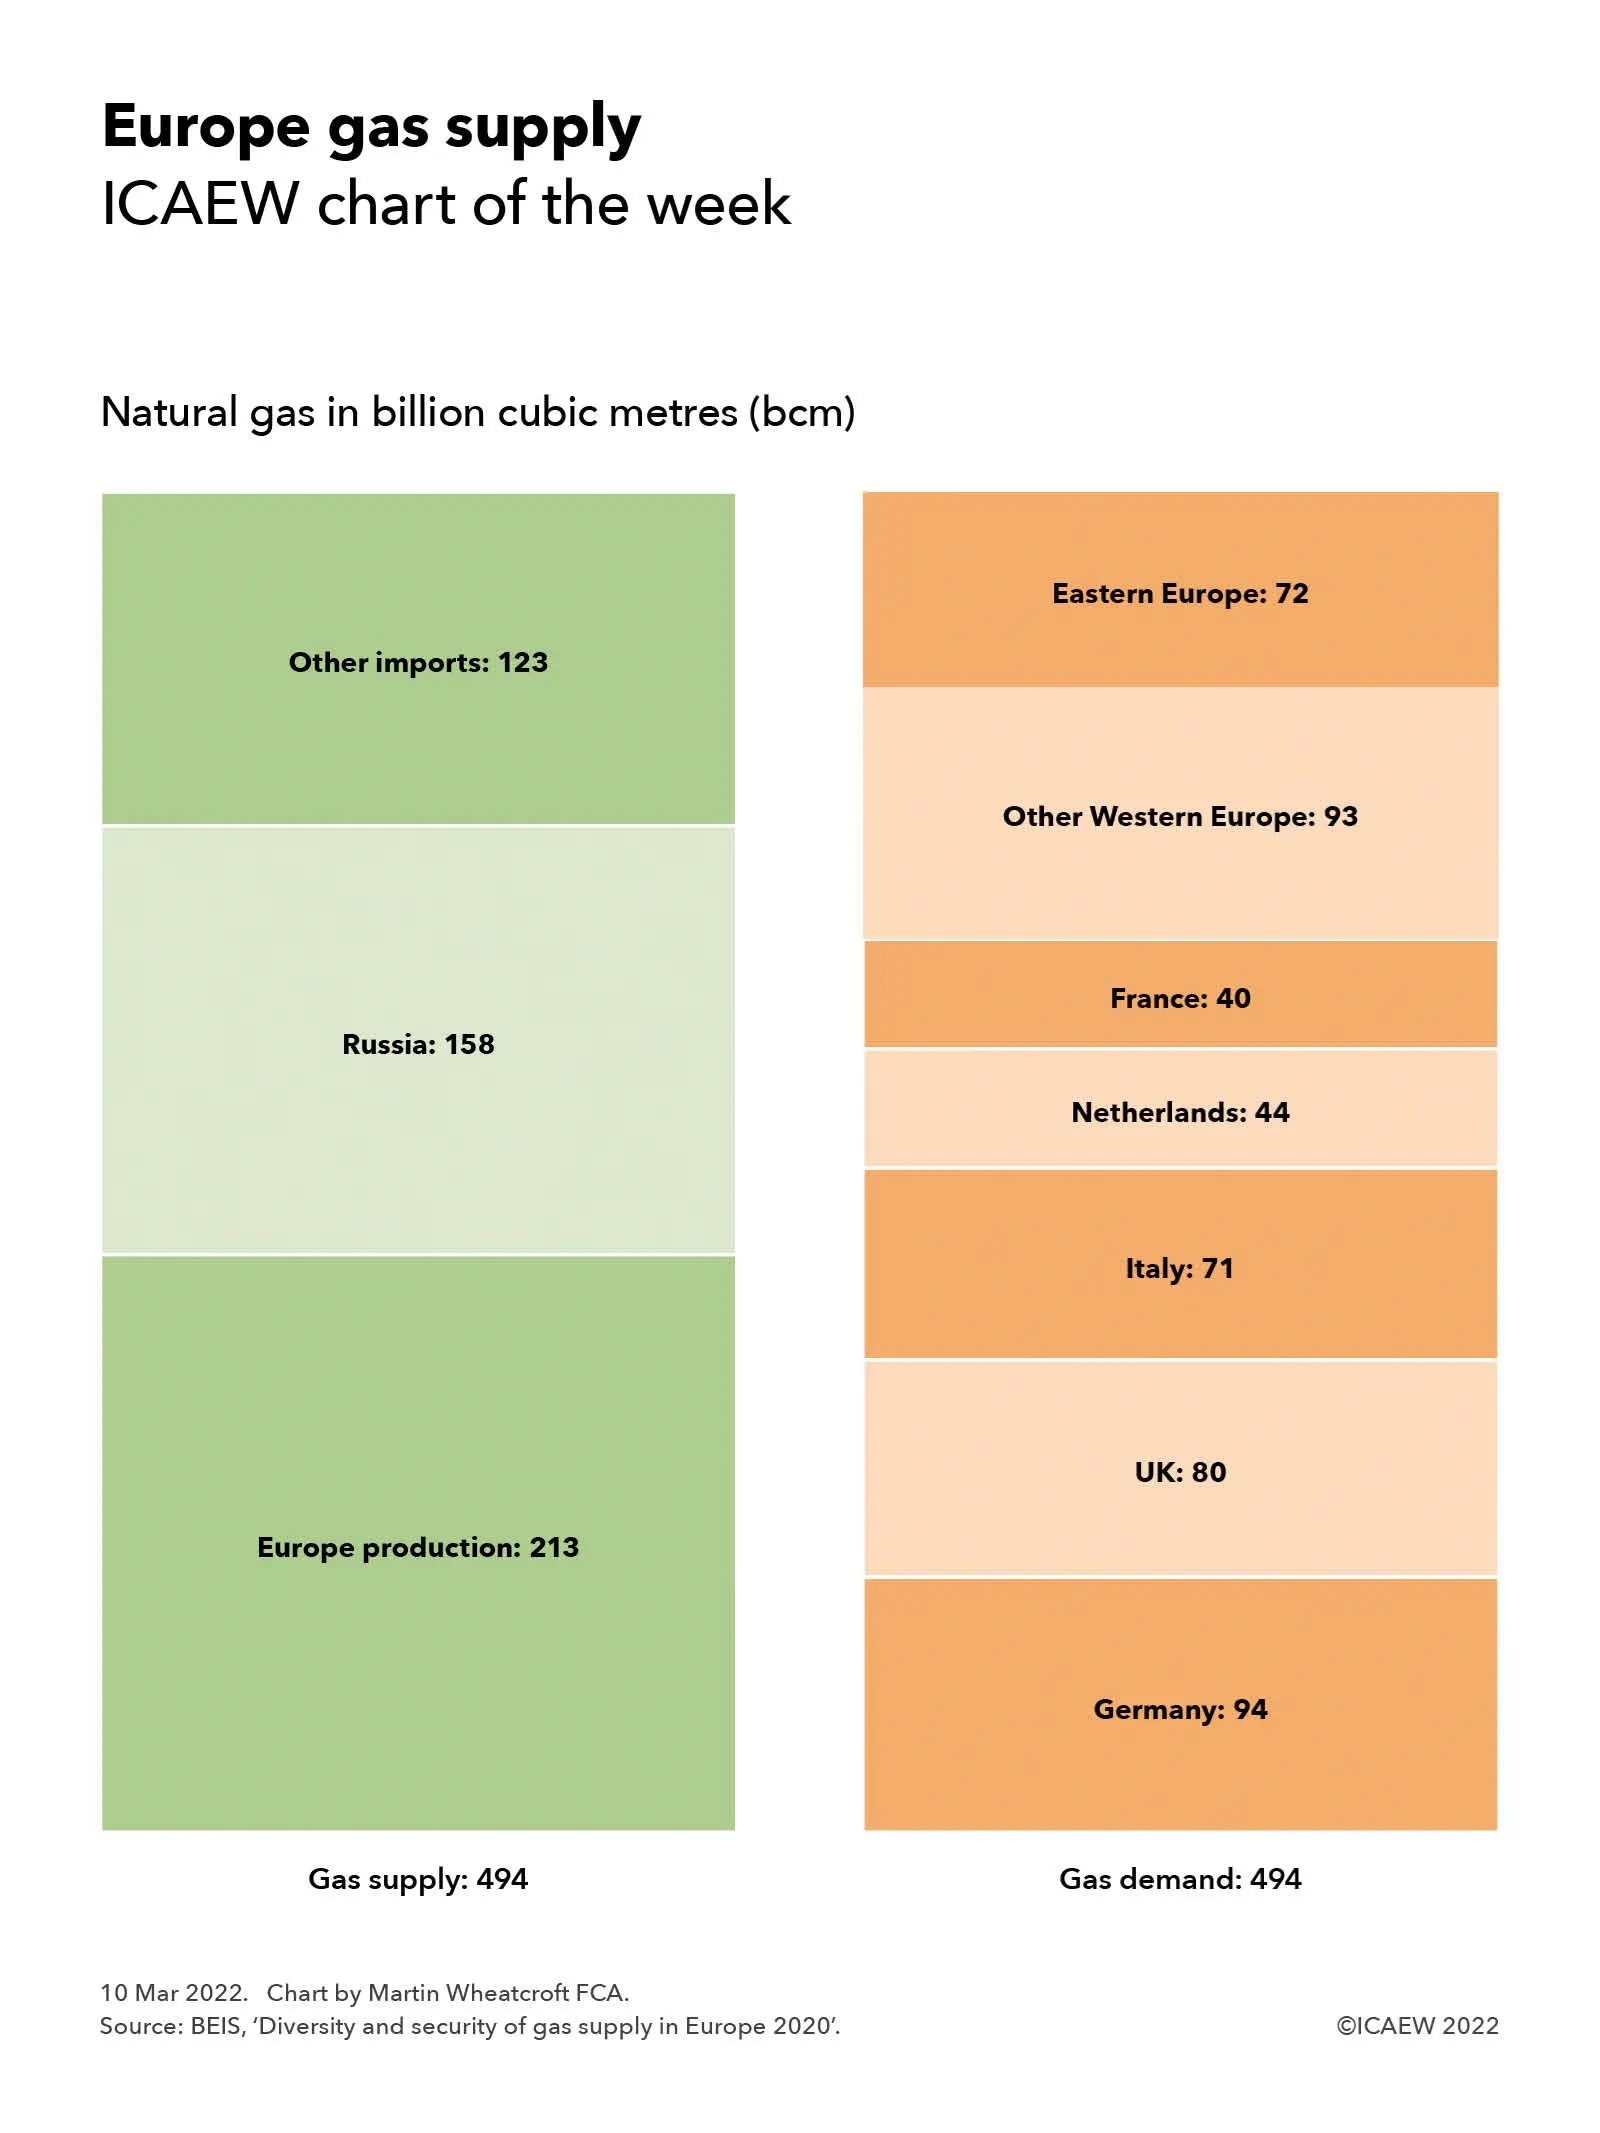
Our chart this week illustrates the $5.8tn federal budget for the 2023 fiscal year proposed by President Biden to Congress for approval – a process that will not be straightforward.
The US Office for Management and Budget (OMB) has just published President Biden’s proposal for the Budget of the United States Government, Fiscal Year 2023, which commences on 1 October 2022.
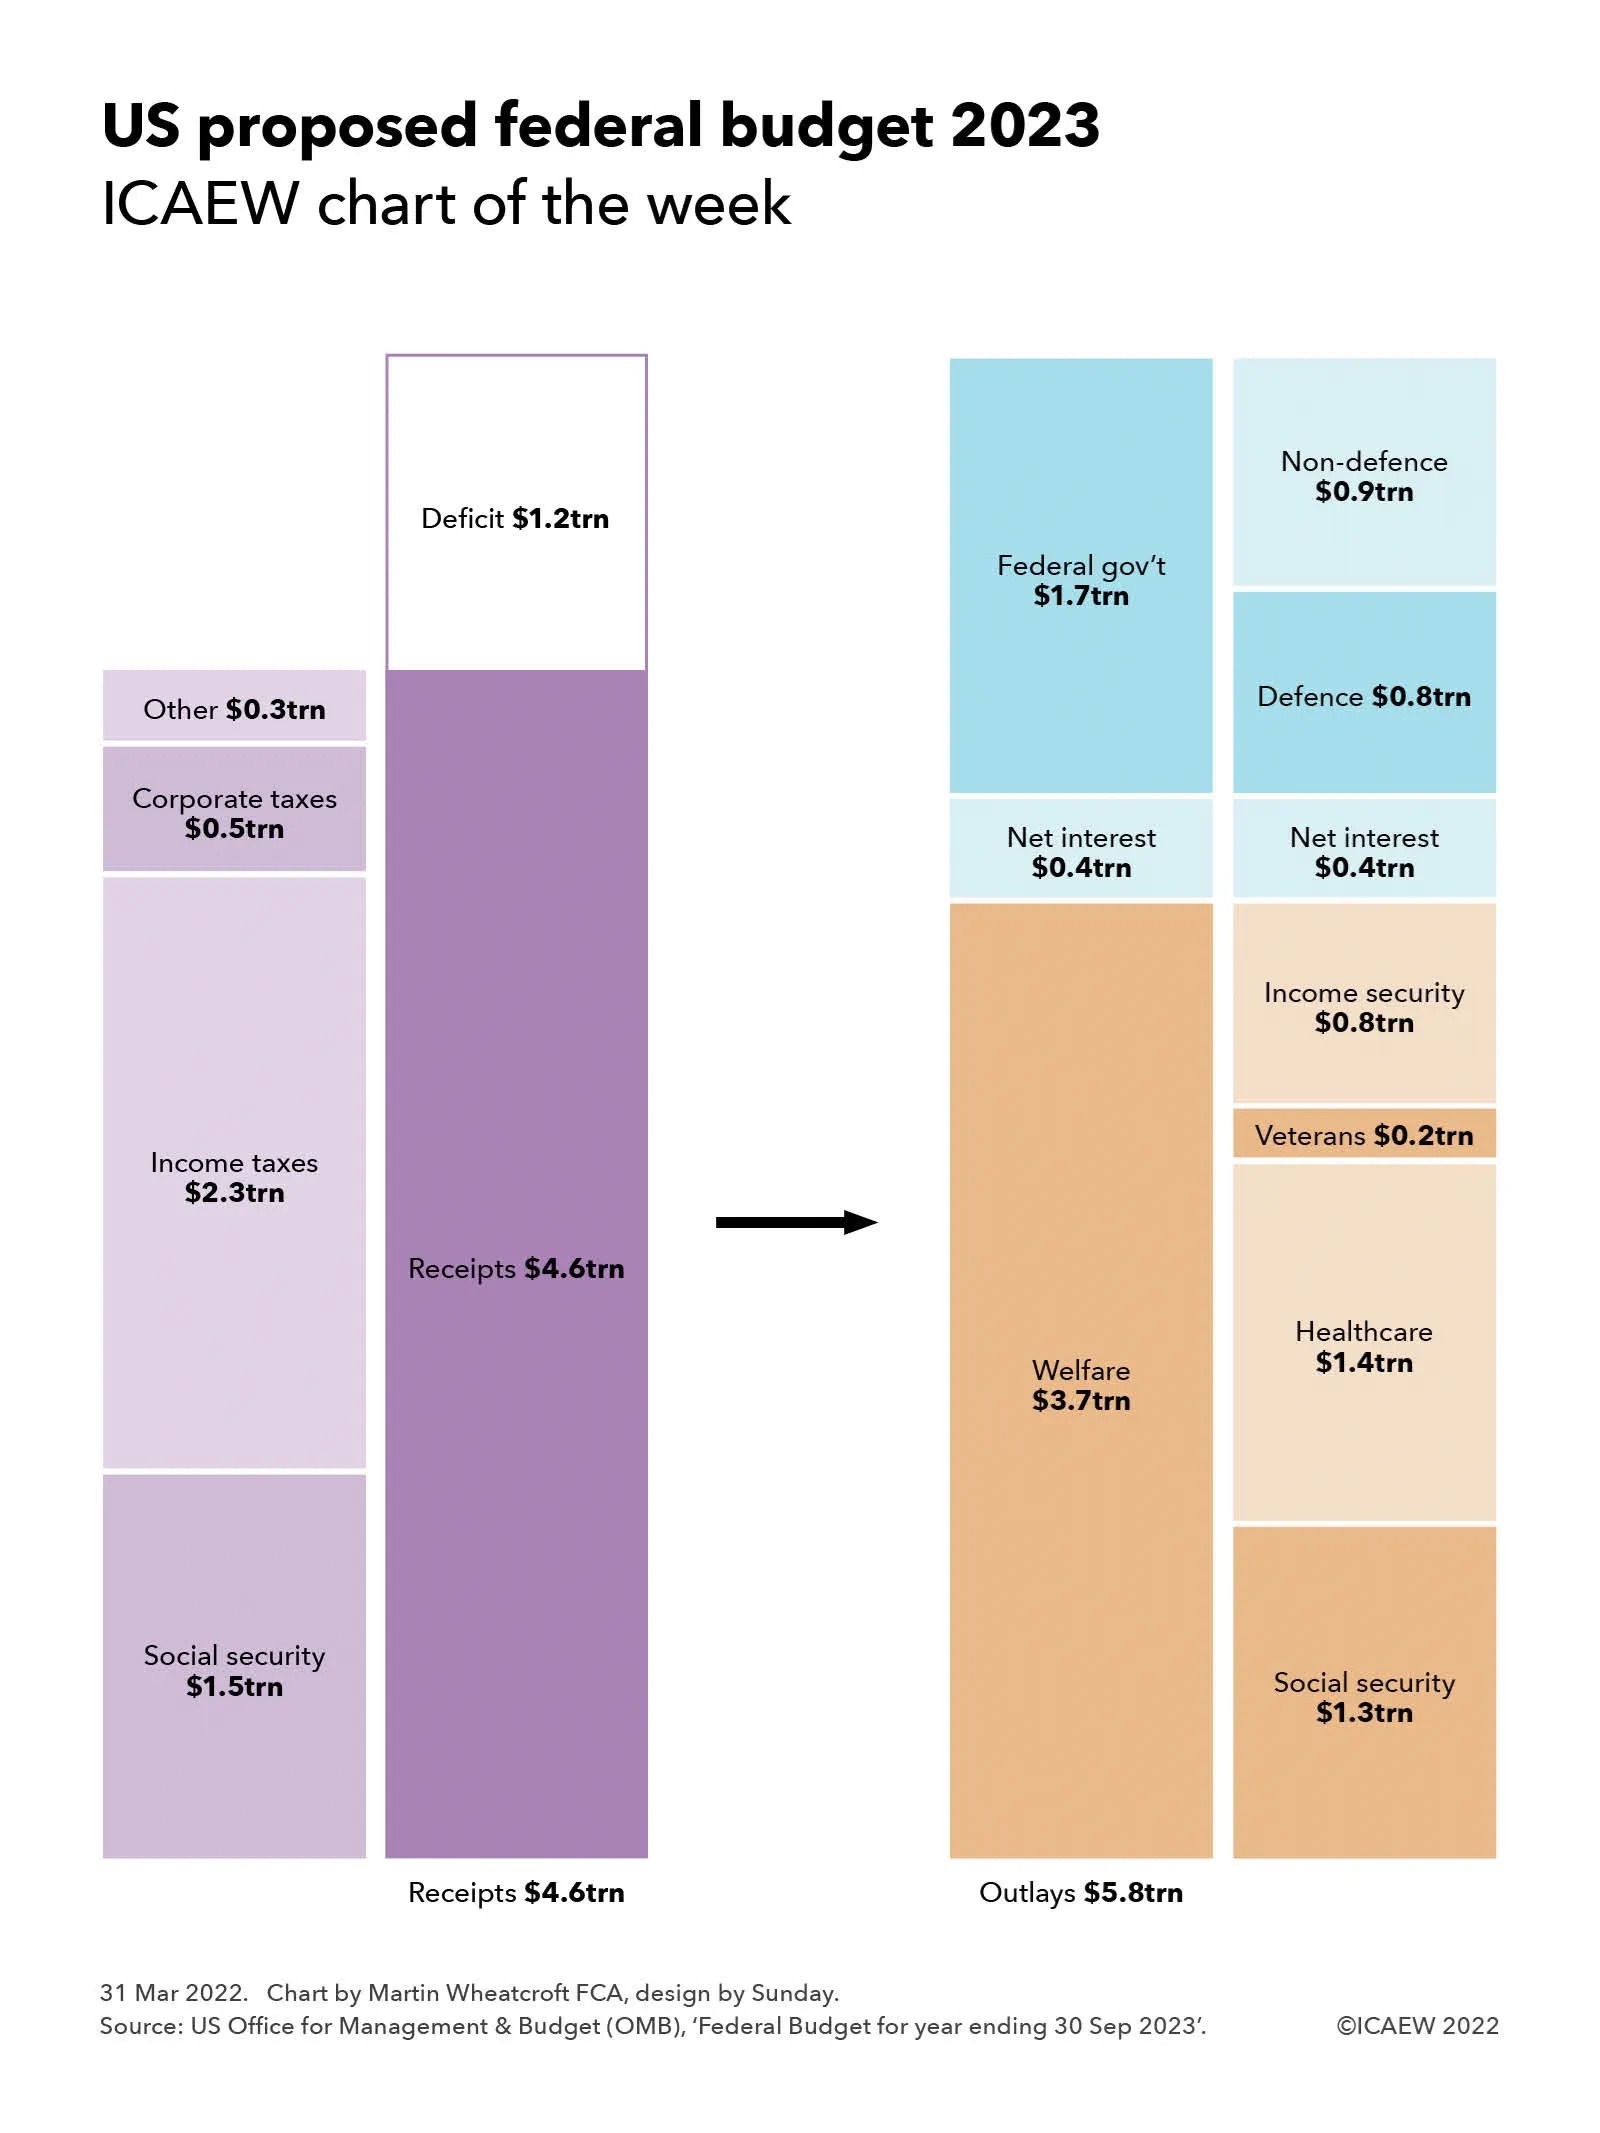
Federal spending proposed of $5.8tn comprises $3.7bn of ‘mandatory’ spending, primarily on welfare programmes, $0.4tn on debt interest, and $1.7tn of ‘discretionary’ spending. Welfare spending includes $1.3tn on social security, $1.4tn on healthcare (Medicare and Medicaid), $0.2tn on support to veterans, and $0.8tn on income security and other programmes.
This is a $60bn reduction from the $5.9tn forecast for the current financial year ending on 30 September 2022, with increases in social security ($99bn), Medicare and Medicaid ($67bn), interest ($39bn) and defence ($29bn), offset by a reduction of $280bn in income security (primarily pandemic support) and $14bn in non-defence departmental spending. This compares with the $6.8trn spent in the fiscal year ended 30 September 2021 at the height of the pandemic.
Receipts are forecast at $4.6tn, comprising social security payroll taxes of $1.5tn, federal income taxes of $2.3tn, corporate taxes of $0.5tn, and other taxes $0.3tn, resulting in a deficit of $1.2tn to be funded by borrowing.
Receipts are forecast to be $201bn higher than the $4.4tn forecast for the current financial year, with social security receipts up $64bn, income taxes up $82bn and corporate taxes up $118bn, offset by a fall of $63bn in other receipts. This primarily relates to economic factors as the US emerges from the pandemic but, as has been publicly reported, also involves higher taxes on ‘billionaires’, among other tax measures.
With pandemic income security and furlough programmes no longer required, the deficit has fallen from $2.8tn in 2021 to $1.4tn in the current year and a proposed $1.2tn in the next, before increasing to $1.8tn in 2032, reflecting increases in both receipts and spending over the coming decade.
The budget documents prepared by the OMB focus in particular on the major plans to improve infrastructure embodied in the bipartisan Infrastructure Investment and Jobs Act 2021, as well as further investment in defence, in lowering health and social care costs for individuals, in improving housing, pre-school and college education, and in reducing energy costs by combating climate change. The OMB suggests that there is some prudence in the budget given the uncertainties about whether proposed tax rises will obtain political support from within Congress, with an indication that this will be used to reduce the federal deficit even further if all the proposed tax rises are enacted into law.
For President Biden, this is his last budget proposal before the mid-term elections in November, when there is a possibility that the Democrats might lose control of one, or even both, houses of Congress. This makes it particularly important to his ability to deliver his domestic agenda.