22 October 2020: Public finances remain on track for the worst peace-time deficit ever, thanks to lower receipts and large-scale coronavirus interventions.
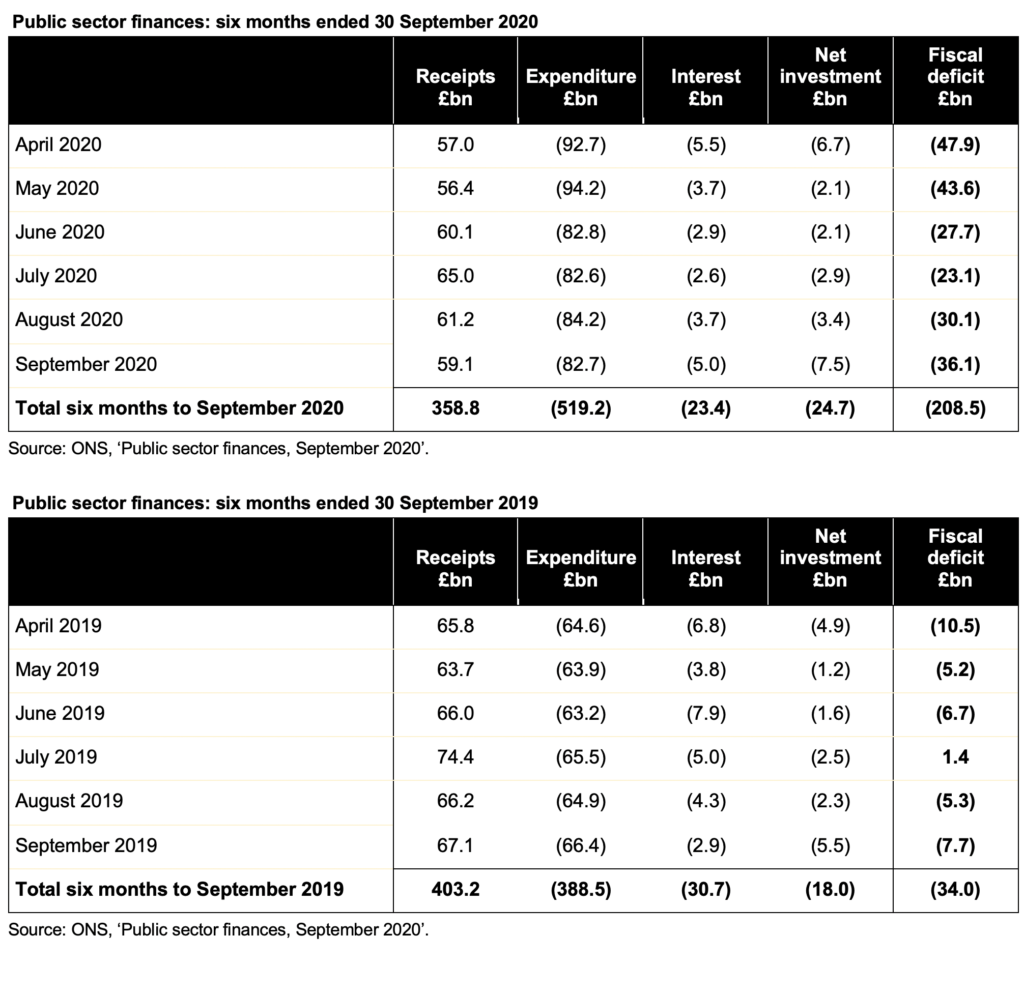
The latest public sector finances reported a deficit of £36.1bn in September 2020, a cumulative total of £208.5bn for the first six months of the financial year.
Falls in VAT, corporation tax and income tax drove lower receipts, while large-scale fiscal interventions resulted in much higher levels of expenditure. Net investment is greater than last year, as planned, while the interest line has benefited from ultra-low interest rates.
Public sector net debt increased to £2,059.7bn or 103.5% of GDP, an increase of £259.2bn from the start of the financial year and £274.0bn higher than in September 2019. This reflects £50.7bn of additional borrowing over and above the deficit, most of which has been used to fund coronavirus loans to business and tax deferral measures.
Commenting on the figures Alison Ring, ICAEW Director for Public Sector, said: “The deficit of £208bn is already more than the full-year deficit at the height of the financial crisis a decade ago and remains on track to be the largest ever outside the two world wars.
“The economic damage caused by the pandemic in the first half of the fiscal year was not as bad as originally feared, thanks in part to the extraordinary level of financial support provided by the Chancellor. However, the second wave is putting further strain on the public finances as new regional restrictions are placed on economic activity.
To help the recovery the Chancellor must take the opportunity at the Autumn Statement and Spending Round to invest in preparing infrastructure projects to start as soon as possible.”

The combination of receipts down 11%, expenditure up 34% and net investment up 37% has resulted in a deficit for the six months to September 2020 that is approaching four times the budgeted deficit of £55bn for the whole of the 2020-21 financial year set in the Spring Budget in March. This is despite interest charges being lower by 24%. The cumulative deficit is more than six times as much as for the same six-month period last year.
Cash funding (the ‘public sector net cash requirement’) for the six months was £257.8bn, compared with £7.1bn for the same period in 2019.
Interest costs have fallen despite much higher levels of debt, with extremely low interest rates benefiting both new borrowing to fund government cash requirements and borrowing to refinance existing debts as they have been repaid.
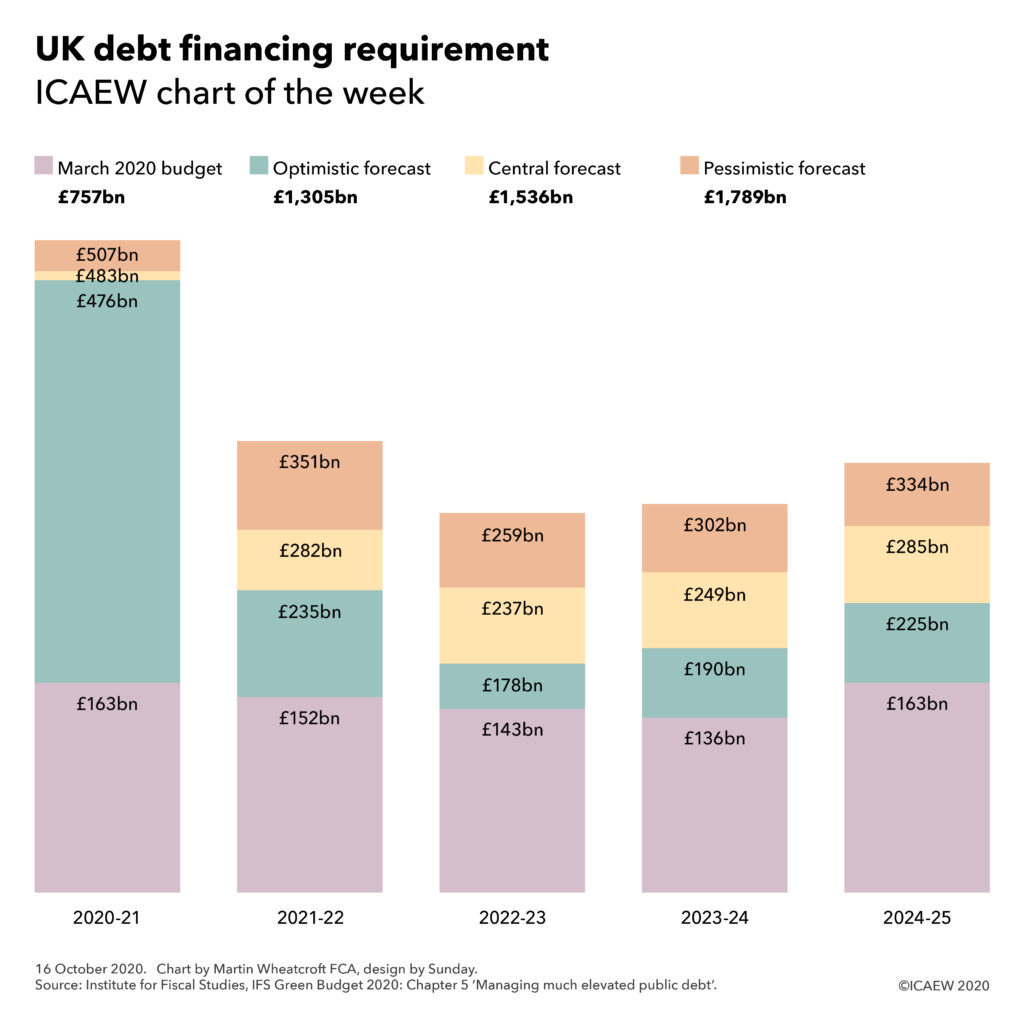
The Institute for Fiscal Studies’ recent IFS Green Budget 2020 annual pre-Budget report indicated that the deficit for the full year to March 2021 could reach £350bn or 17% of GDP.
Some caution is needed with respect to the numbers published by the ONS, which are expected to be repeatedly revised as estimates are refined and gaps in the underlying data are filled. In particular, the OBR points out that the ONS has yet to record any allowance for losses that might arise on the more than £100bn of tax deferrals, loans and guarantees provided to support businesses through the pandemic.
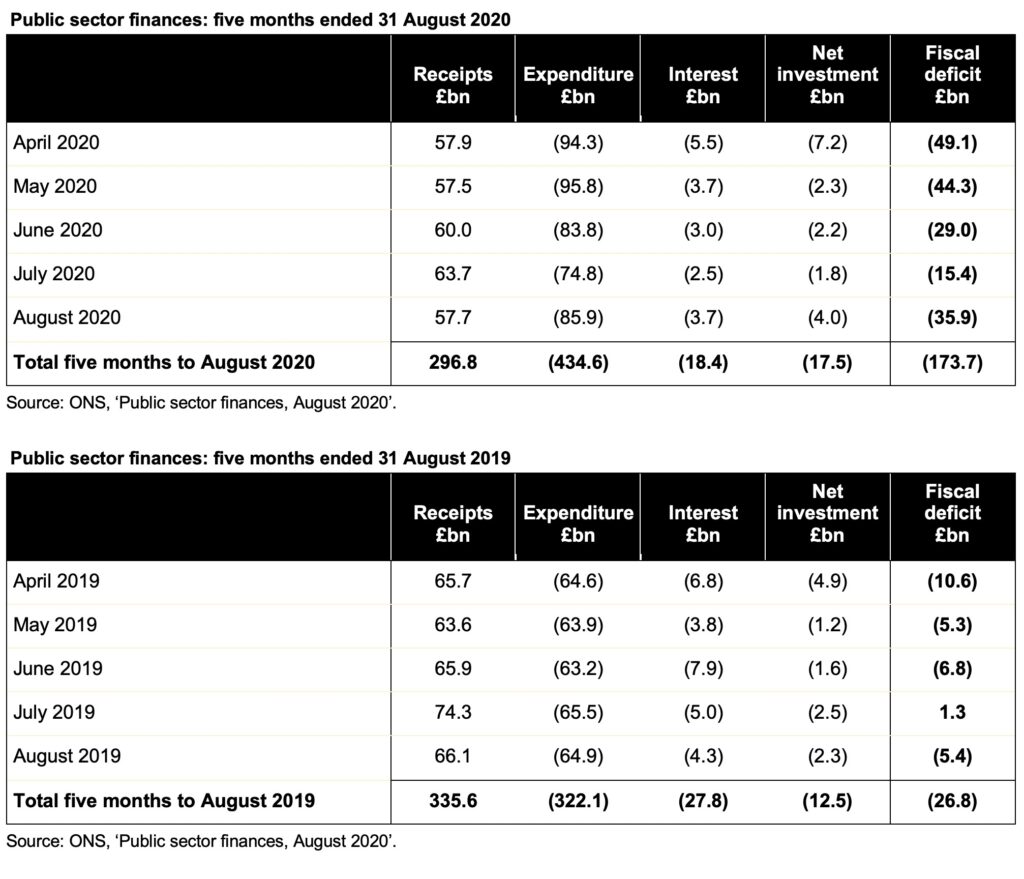
The ONS made a number of revisions to prior month and prior year fiscal numbers to reflect revisions to estimates and changes in methodology. These had the effect of reducing the reported fiscal deficit in the first five months from the £173.7bn reported last time to £172.4bn and reducing the reported deficit for 2019-20 from £55.8bn to £54.5bn.
For further information, read the public sector finances release for September 2020.