My chart for ICAEW this week celebrates the launch of King Charles III banknotes by looking at the number and value of Bank of England banknotes in circulation, highlighting the continued popularity of the £20 note.

My chart this week is in honour of the new King Charles III banknotes that have just started to enter circulation. These will match the design of the existing Sir Winston Churchill £5 notes, Jane Austen £10 notes, JMW Turner £20 notes, and Alan Turing £50 notes, but with the King’s image replacing that of the late Queen Elizabeth II.
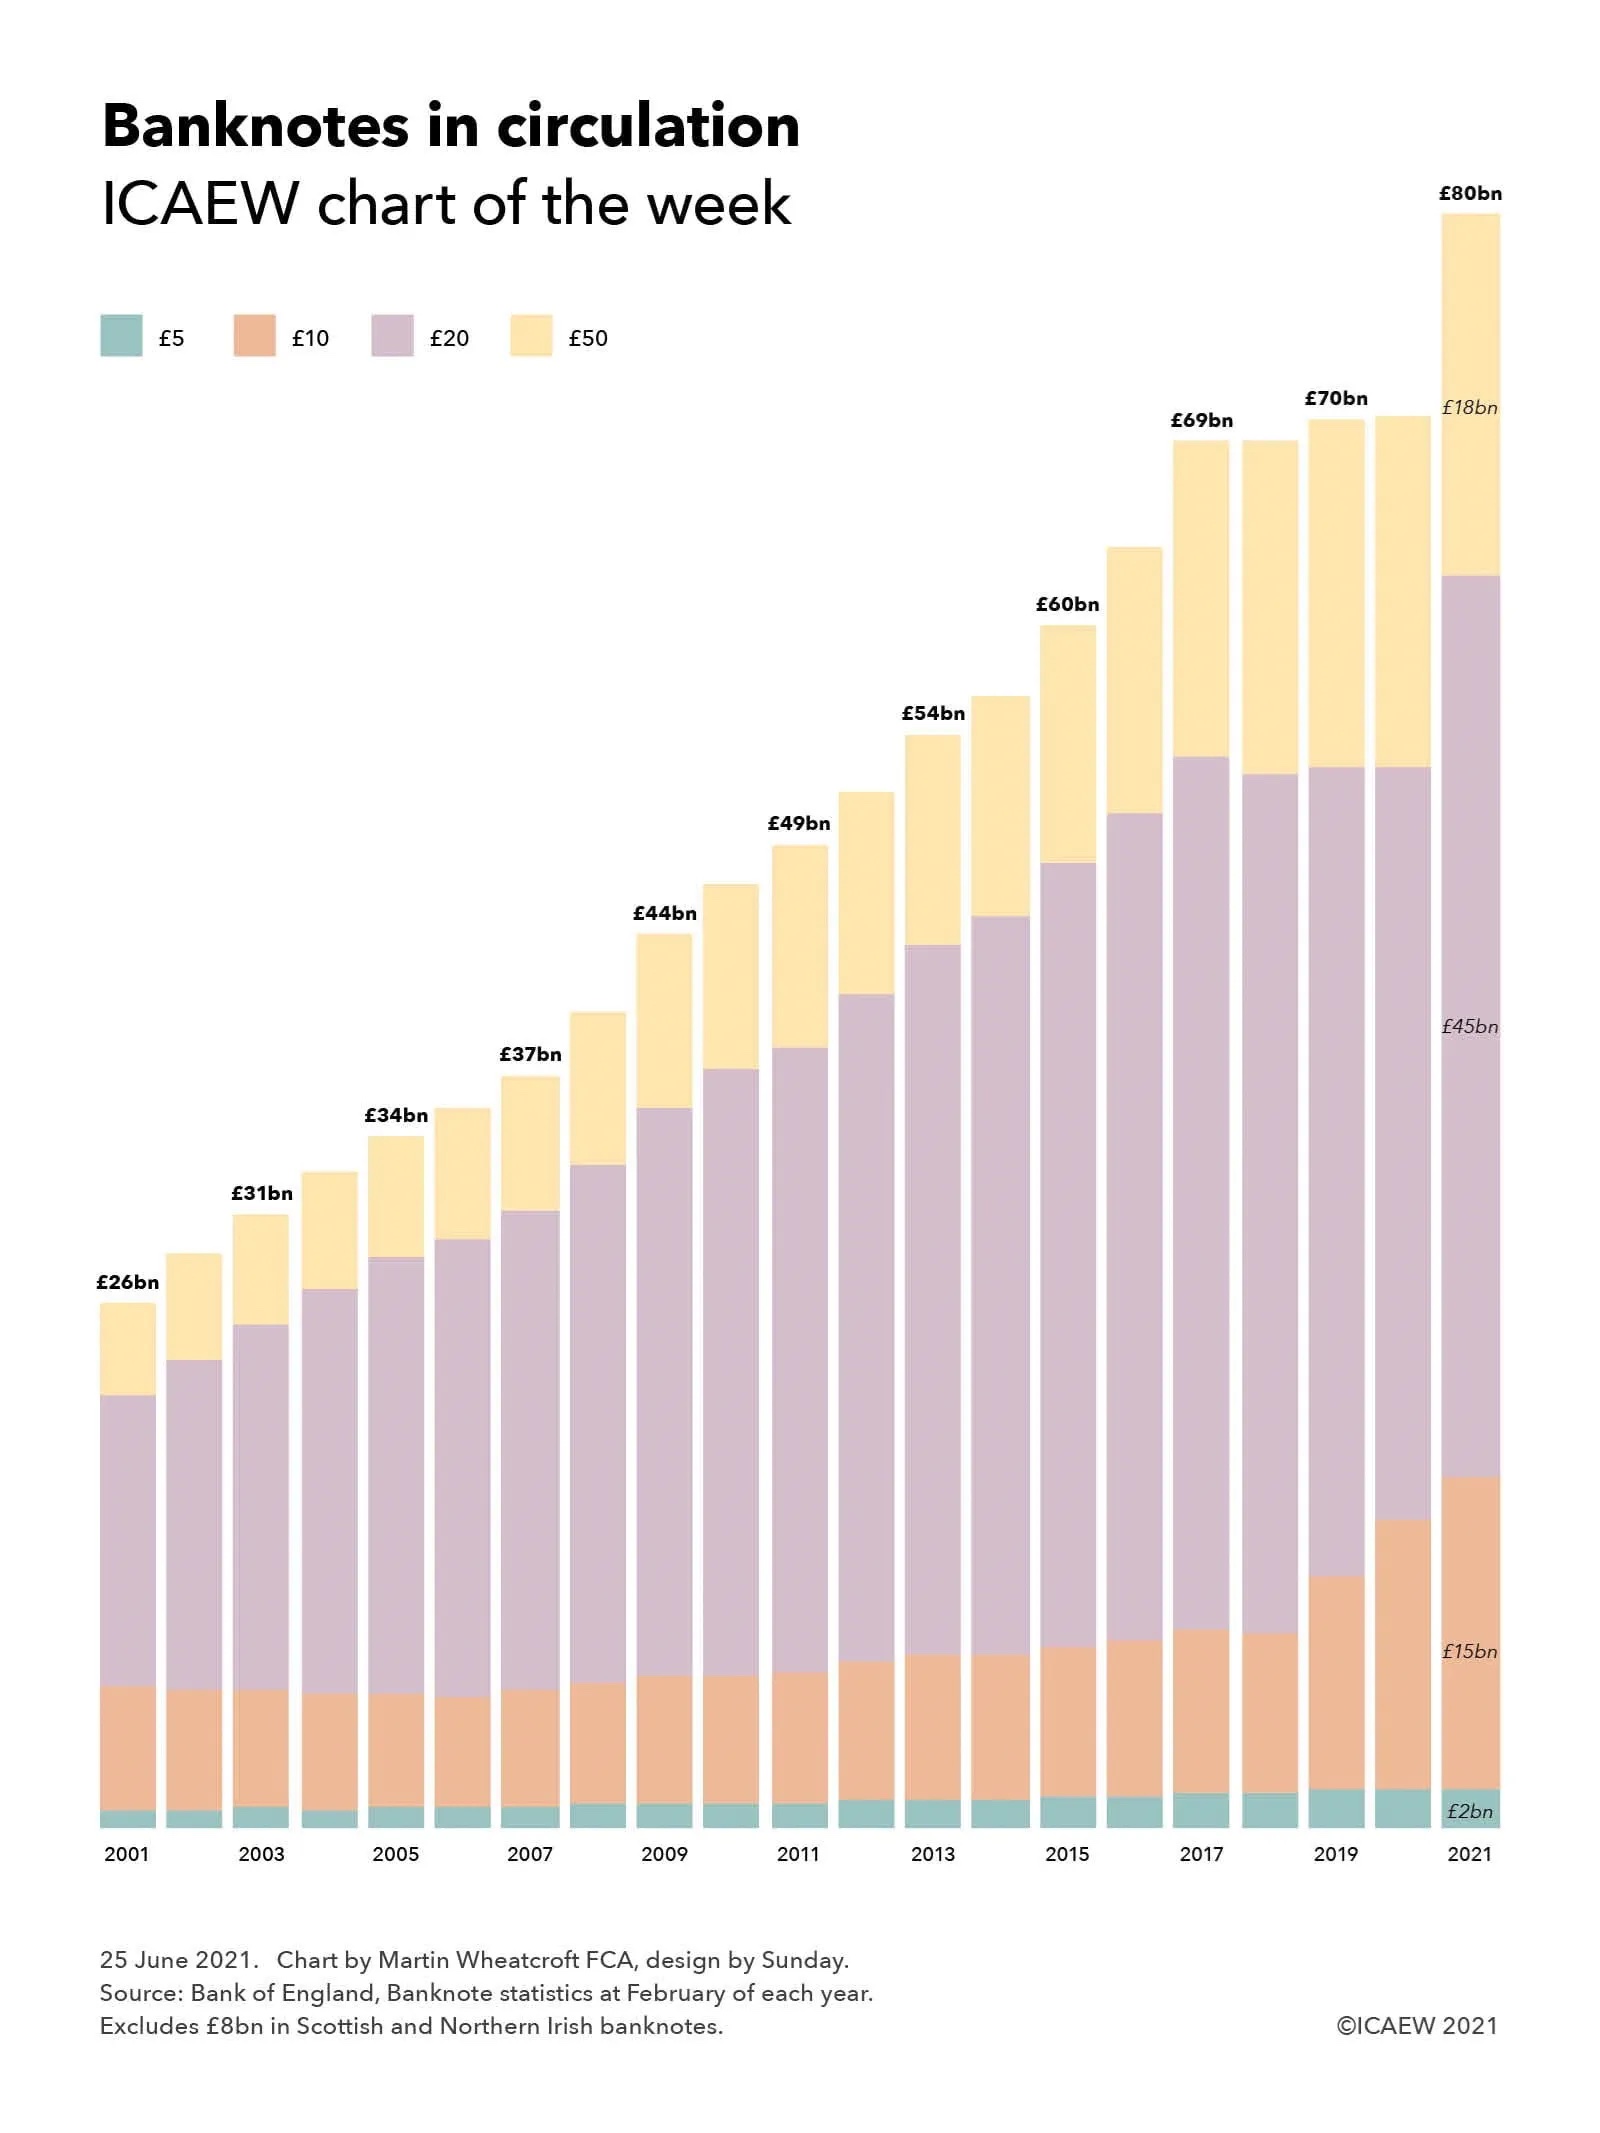
As the chart illustrates, the Bank of England reports that there were £82.4bn of its banknotes in circulation on 29 February 2024, comprising 384m £5 notes worth £1.9bn, 1,277m £10 notes worth £12.8bn, 2,646m £20 notes worth £52.9bn, and 295m £50 notes worth £14.8bn.
The chart excludes £4.6bn in high value notes issued to Scottish and Northern Irish banks that in turn print their own banknotes.
The new King Charles III banknotes (or ‘Charlies’ as they may come to be called) were issued for the first time on 5 June 2024 in relatively small numbers. The Bank of England says that they are only going to put them into circulation as old banknotes wear out or to meet demand, which could take a long time given that polymer banknotes are much more hardwearing than old paper banknotes.
On average there are approximately 6 x £5, 20 x £10, 40 x £20 and 4 x £50 in circulation for each person living in the UK. Although many of these will be sitting in cash registers and bank vaults, there are still a large number sitting in drawers or down the back of sofas, or even – perhaps surprisingly in today’s ‘cashless’ world – in wallets and purses.
Of course, these are not the only currencies that will feature the King, with Canada recently announcing that Charles’ image will feature on the next Canadian $20, with New Zealand expected to follow in due course. However, Australia has decided to not to put the King on the next Australian $5, the last remaining Australian banknote to still retain an image of the late Queen.
Fortunately, Bank of England banknotes remain exchangeable forever, so if you damage any of your existing banknotes, you can always just pop down to Threadneedle Street to ask for a replacement. Although probably not immediately, as the queues for the new Charlies are likely to be quite long.