An inflation rate of 10.1% in the year to March 2023 conceals a huge variation in individual price rises, as illustrated by this week’s chart on food prices.
One of the problems in measuring inflation is that a weighted average of thousands of different prices is very different from our individual experience of inflation. Not only are we unique in terms of the basket of goods and services that we buy, but we also tend to notice some price changes more than others – making our personal experience very different from everyone else’s.
Nowhere is this more pronounced than in our regular trips to the shops to buy groceries, where we can see higher prices both on the shelves and when we come to pay at the till. This can be much more visible to us than bills paid by direct debit, for example, where money just disappears from our bank account and we need to make an effort to work out what is going on.
The Office for National Statistics has recently launched a shopping prices comparison tool that allows you to choose a basket of goods and see how retail prices have increased across different types of purchases: food and drink, clothing and footwear, restaurants and bars, health, household items, recreation and culture, services, and transport. Even there, the prices they quote are averages from many different retail outlets, specific products, and brands – and so won’t exactly match what is happening to your individual basket.
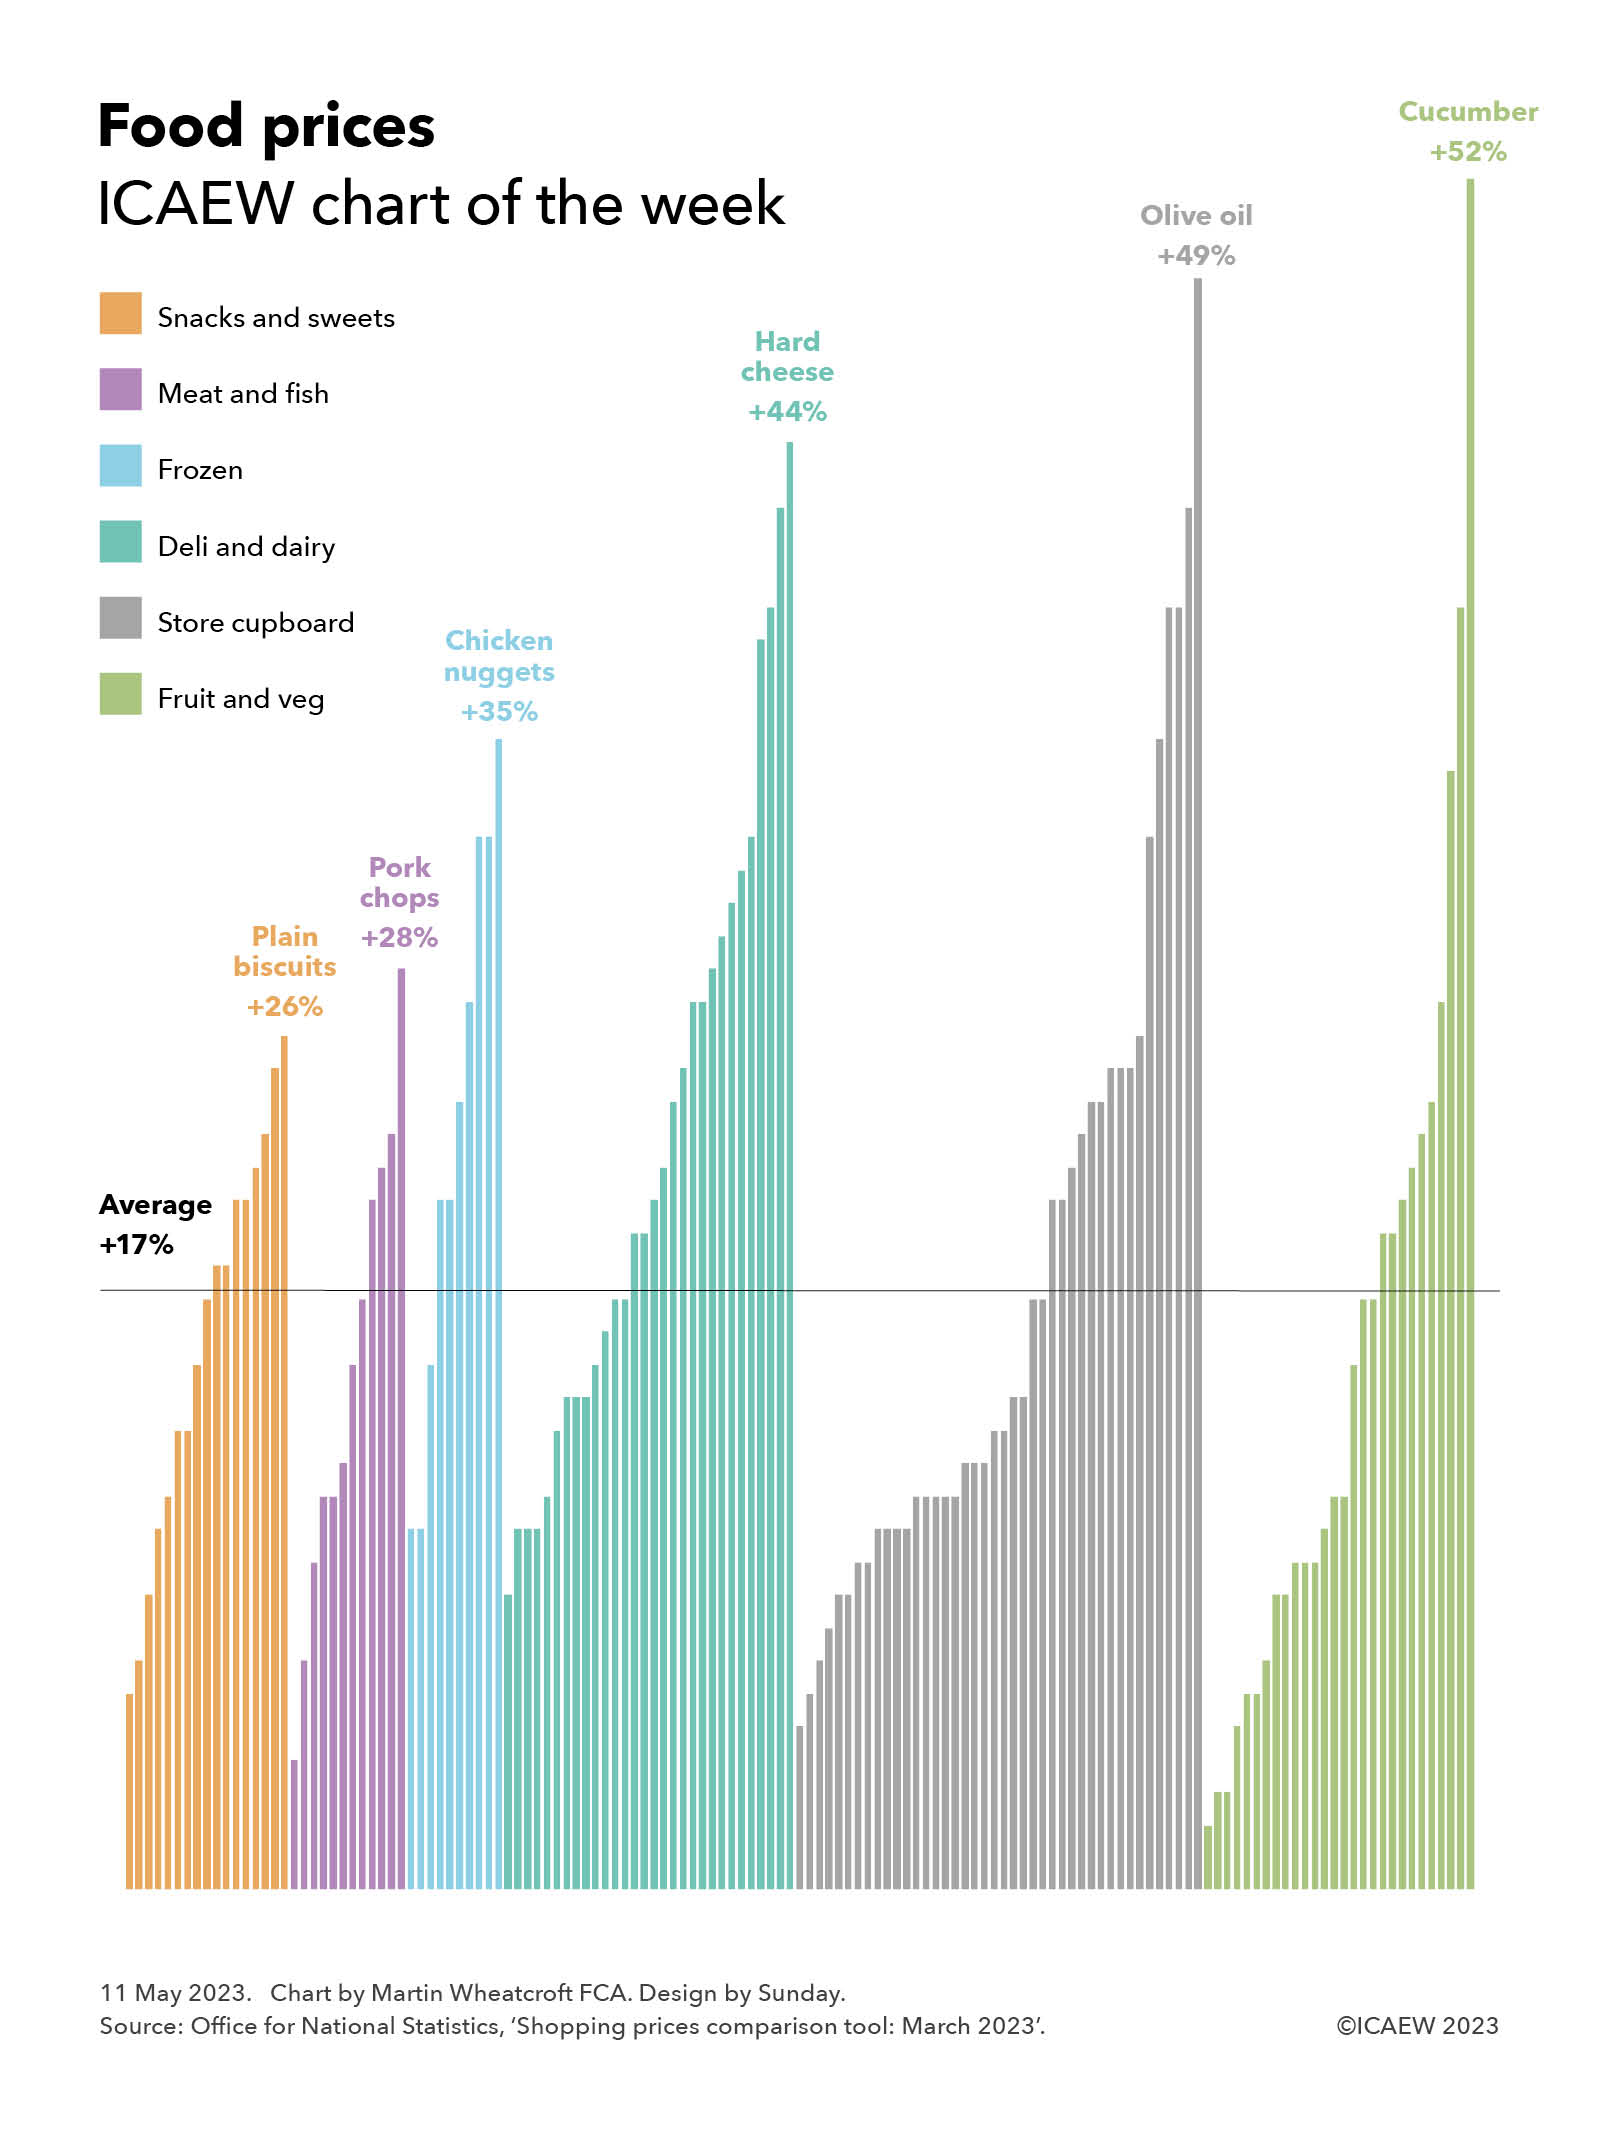
For our chart this week, we have chosen to look at food prices, choosing a basket that in total has increased by 17% over the past year, rising from £422.40 if you had bought everything on the list in March 2022 to £495.43 in March 2023. We have allocated these into six different categories to give a bit more flavour (pun intended) to what is going on.
There is a huge amount of variation between different foodstuffs, with our chart illustrating how in the snacks and sweets category the average price of 200-300g of plain biscuits has increased by 26% (from 98p to £1.24), while in meat and fish, pork loin chops have gone up by 28% (from £6.35 per kg to £8.12 per kg). In the frozen category, chicken nuggets are up 35% (from £1.79 to £2.41), while in deli and dairy, hard cheese has gone up the most on average, by 44% (from £6.92 per kg to £9.98 per kg). Olive oil tops our store cupboard classification, up 49% (from £3.87 to £5.78 on average between 500ml and 1 litre), but the king of food price inflation is the humble cucumber, up a massive 52% over a one year period from 55p to 84p each.
Not highlighted in the chart are the smallest price rises in each category, with peanuts up 5% (from £1.23 to £1.29 for 150-300g), lamb loin chop/steaks up 4% (from £15.49 to £16.13 per kg), frozen vegetable burgers up 11% (£1.99 to £2.21), sliced ham up 9% (£2.41 to £2.64 for 100-200g), low-sugar/non-chocolate breakfast up 6% (£2.08 to £2.20), and sweet potato up a mere 2% (from £1.17 to £1.19 per kg).
The Bank of England continues to tighten the screws on inflation, raising its base rate to 4.5% on 11 May 2023, and the projections are that inflation overall should start to reduce quite rapidly over the next few months.
However, as ICAEW Economies Director Suren Thiru recently said in a TV interview on BBC Breakfast, inflation is now becoming embedded into the everyday things that we buy. This makes the challenge for the Bank of England to bring inflation back down to its target range of 1% to 3% that much harder.
The public finances continue to be battered by economic shocks as this week’s chart on the past five years of red ink illustrates.
The monthly public sector finances for March 2023 released on Tuesday 25 April contained the first cut of the government’s financial result for 2022/23, with our chart this week illustrating trends over the past five years in receipts, expenditure and the deficit.
As our chart highlights, tax and other receipts increased from £813bn in 2018/19 to £827bn in 2019/20, before falling to £793bn during the first year of the pandemic. They recovered to £920bn in 2021/22 before rising with inflation to a provisional estimate of £1,016bn for the year ended 31 March 2023.
Total managed expenditure (TME) increased from £857bn in 2018/19 to £888bn in 2019/20, before exceeding £1trn for the first time in 2020/21 as the pandemic caused expenditure to rise significantly. TME fell in 2021/22 to £1,041bn as pandemic-released spending was scaled back, before rising this year to £1,155bn as inflation, higher interest rates and energy support packages more than offset the pandemic related spending that was not repeated in 2022/23.
The deficit of £44bn in 2018/19 was the lowest it had been since the financial crisis, following an extended period of spending restraint over a decade. The purse strings were loosened a little in 2019/20 as previous government plans to eliminate the deficit were abandoned, with the deficit rising to £61bn. The huge cost of the pandemic saw the deficit rise to £313bn in 2020/21 as the borrowing rose to meet the huge costs of dealing with the pandemic, before falling back to £121bn in 2021/22.
There were hopes that the situation would improve further, with the government in October 2021 budgeting for a deficit of £83bn. Unfortunately, rampant inflation and the energy crisis following Russia’s invasion of Ukraine mean that the government does not currently expect to reduce the deficit to below £50bn until 2027/28 at the earliest. And that is with what some commentators believe are unrealistic assumptions about the government’s ability to reduce spending on public services beyond the cuts already delivered.
Provisional receipts in 2022/23 were 25% higher than the outturn for 2018/19, which in the absence of economic growth has principally been driven by inflation of around 15% over that period combined with an increase in the level of taxation and other receipts from around 37% to approaching 41% of the economy. Total managed expenditure is provisionally 35% higher than in 2018/19, although this includes substantial amounts of one-off expenditures on the energy support packages and index-linked debt interest that should moderate, at least assuming inflation reduces in the coming financial year.
Not shown in the chart is what these numbers mean for public sector net debt, which has increased by £753bn over the past five years from £1,757bn at 1 April 2018 to a provisional £2,530bn at 31 March 2023. This comprises £678bn in borrowing to fund the deficits shown in the chart, and £75bn to fund lending by government and working capital requirements.
Our chart this week may be well presented, but it is not a pretty picture.
Volumes have been the main driver of the increase in value of debit and credit card transactions since 2022, as average spend on debit cards fell and the average transaction on credit cards rose by less than inflation.
UK Finance, the industry body for the banking and finance industry, released its latest data on UK card transactions on 20 April 2023. This provides an insight into UK debit and credit card transactions between January 2022 and 2023, and our chart this week takes a look at the year-on-year change in transaction amounts.
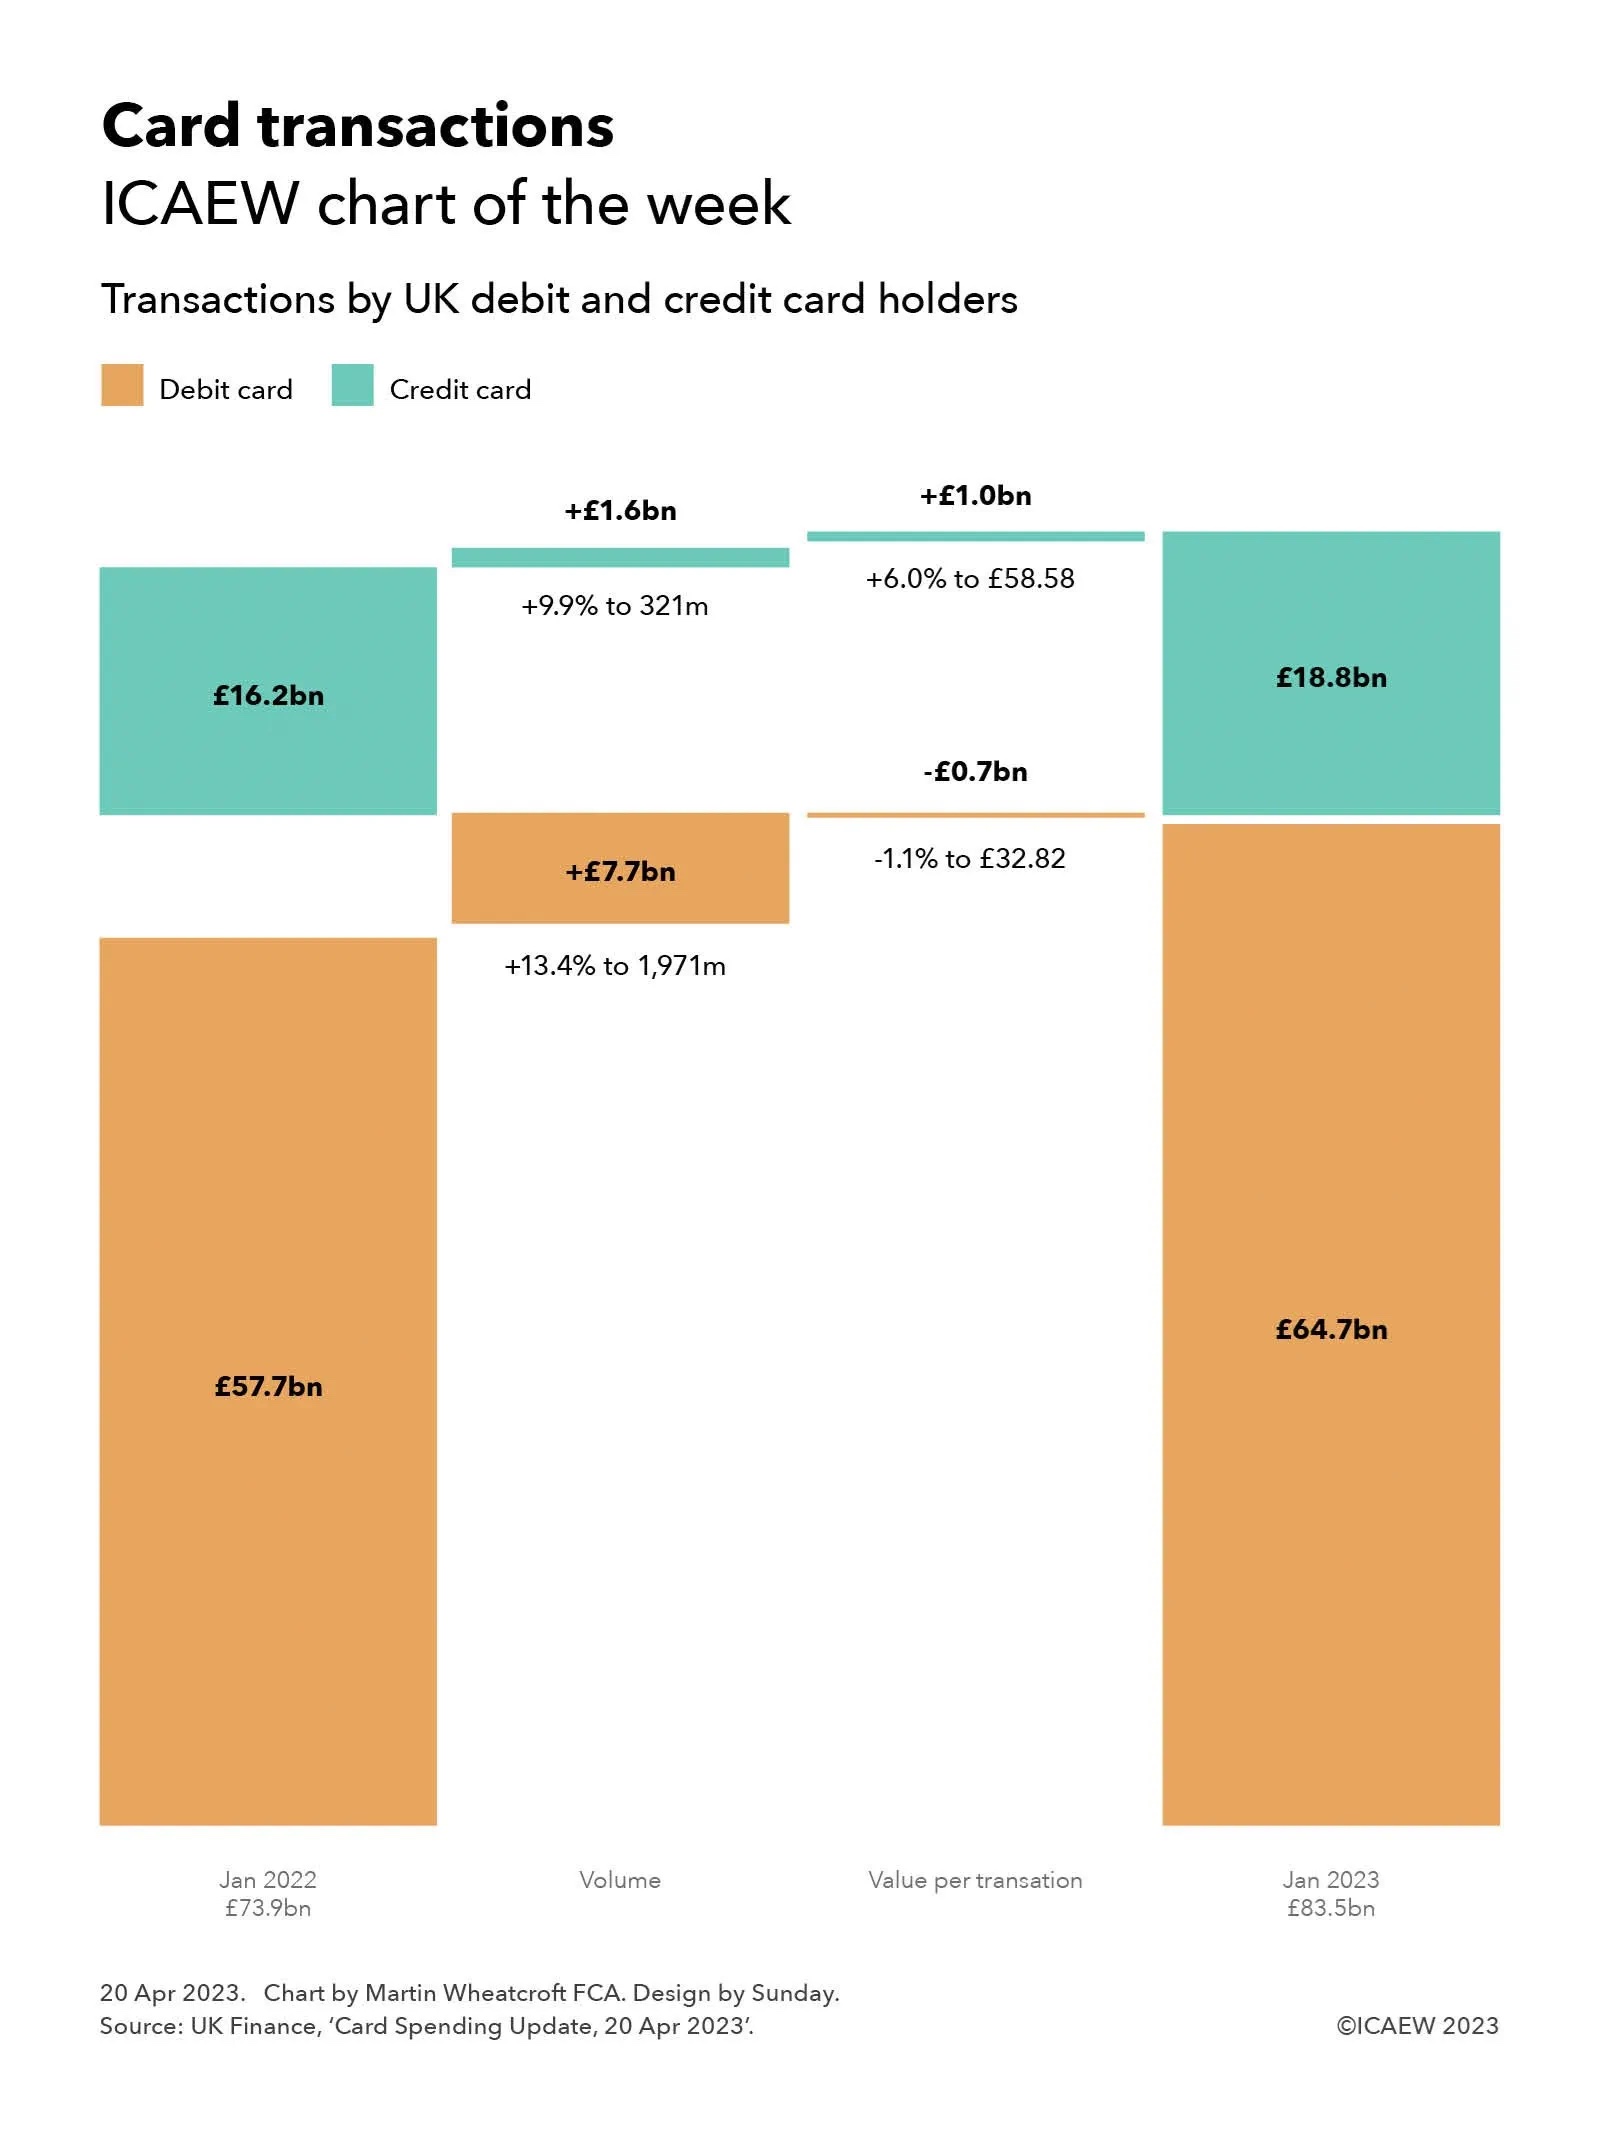
The monthly total value of transactions on UK-issued debit and credit cards increased from £73.9m in January 2022 to £83.5bn in January 2023, putting card transactions on course to exceed £1trn over the course of 2023. This includes online and telephone purchases, as well as in-person retail transactions and spending overseas.
Our chart illustrates how the value of debit card transactions increased from £57.7bn in January 2022 to £64.7bn, analysed between £7.7bn from a 13.4% increase in the volume of transactions to 1,971m, less £0.7bn from a 1.1% fall in the average value of each debit card purchase to £32.82.
In the context of inflation in excess of 10%, a decline in the average value of debit transactions may seem counterintuitive. This is partly because of the continued displacement of cash as a method of payment, especially for low value purchases – contributing to growth in the volume of transactions, but a decline in average purchase amounts. Consumers scaling back their spending in response to the cost-of-living crisis is also likely to be a factor.
The value of credit card transactions rose from £16.2bn to £18.8bn, reflecting £1.6bn from a 9.9% increase in the number of transactions to 321m plus £1.0bn from a 6.0% increase in the average value of each transaction to £58.58.
The largest component of credit card transactions were purchases, which increased from £14.6bn to £17.1bn, up £1.4bn from a 9.9% increase in the volume of purchases to 319m, and £1.1bn from a 6.7% increase in the average value of each purchase to £53.60. Cash advances increased from £187m to £207m (from a 6.6% increase in the number of cash advances to 1.5m and a 3.6% increase in average advance to £135), while balance transfers increased from £1.4bn to £1.5bn (from a 4.0% increase in the number of balance transfers to 0.7m and a 4.9% increase in average transfer to £2,133).
Similar to debit cards, the decline in the average value of each credit card purchase after inflation is likely to be affected by the ongoing switch from cards to cash, as well as a scaling back of purchases by some consumers. There may also have been a shift in purchasing patterns for some households, from fewer larger purchases to more frequent smaller ones.
Not shown in the chart is the amount owed by credit card holders, which was 9.1% higher at £60bn at the end of January 2023 compared with £55bn a year previously. This is lower than the £61.3bn owed at the end of December 2022 as the £20.1bn repaid (just under a third of the total) exceeded the £18.8bn added. According to UK Finance, 51.3% of credit card balances attract interest, with the remainder primarily comprising those who pay their balances in full each month and those on interest-free balance transfers.
Debit and card usage is expected to continue to rise, with UK Finance previously forecasting that cash usage will fall from around 15% of all retail purchases in 2021 to around 6% by 2030. Others have suggested that physical cash could be eliminated altogether, saving the exchequer and businesses from the costs of creating, handling and disposing of cash.
For many, transitioning to a cashless society will be welcome – heralding the end of the need of jingling coins and purses and wallets bulging with banknotes. For others, including the million or so consumers who prefer or are reliant on cash for most of their day-to-day shopping, this may not be so positive.
I take a look at Africa this week and how its current population of 1.5bn, 18% of the world’s total, is distributed across the continent.
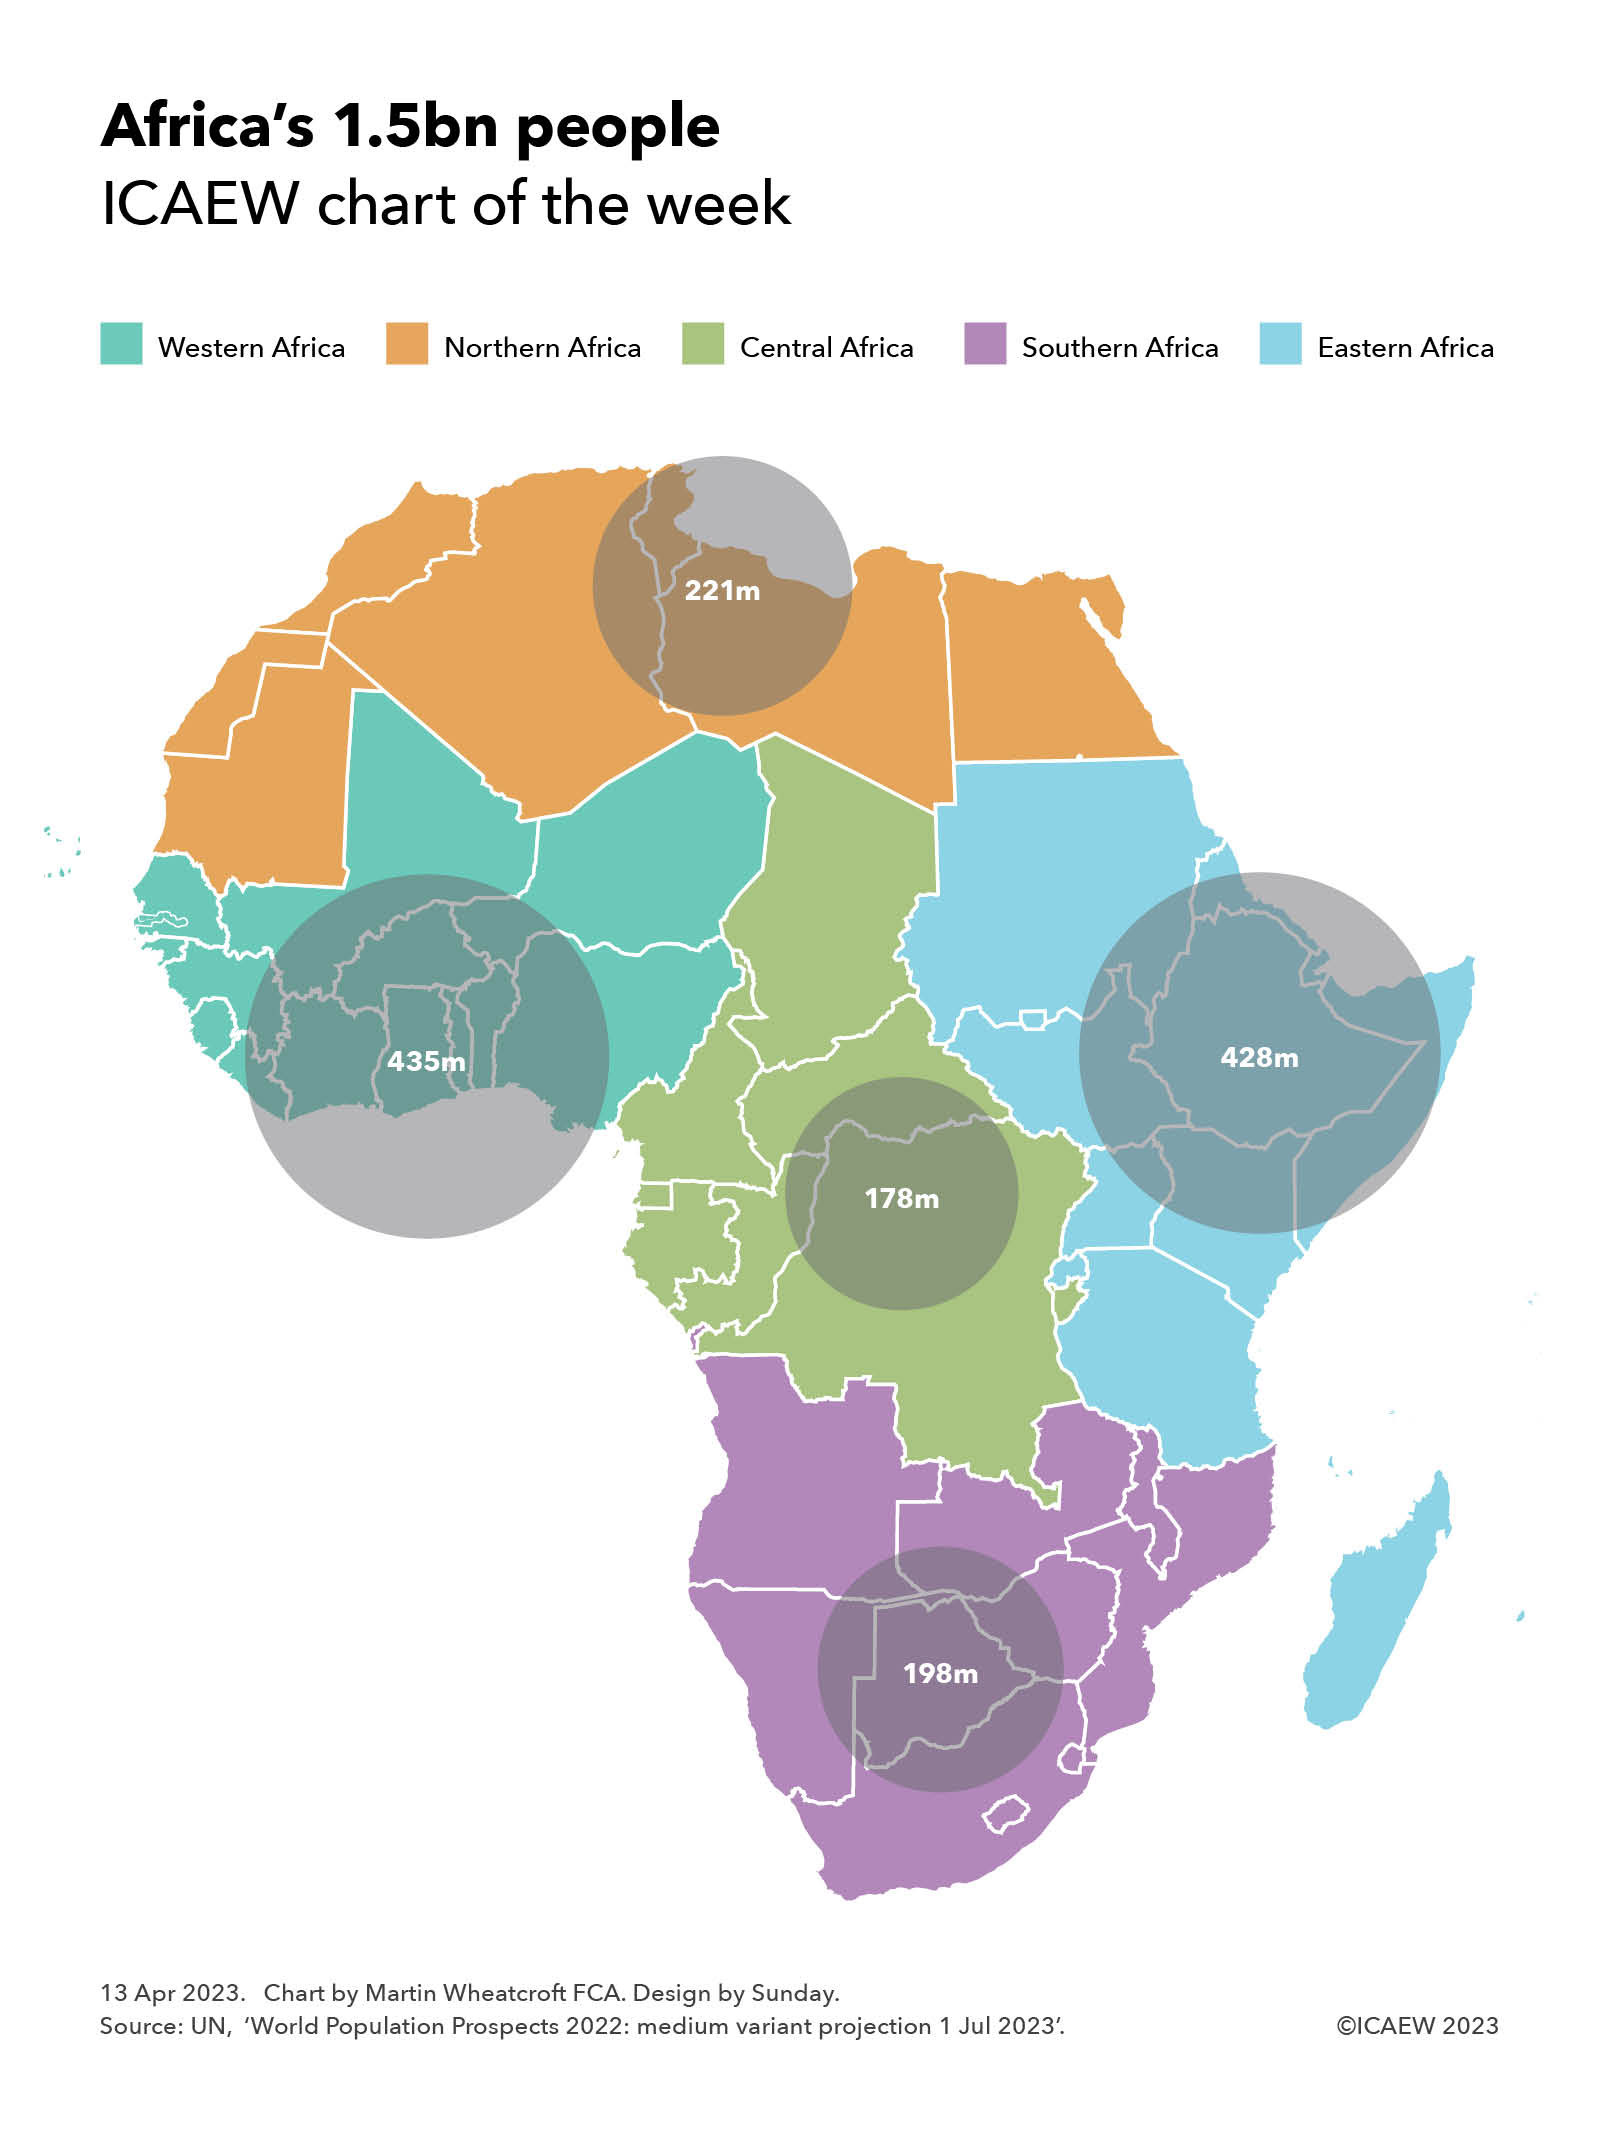
My chart this week illustrates how Africa’s population of 1,460m can be divided into five regions. These comprise Western Africa with 435m people, Northern Africa with 221m, Central Africa with 178m, Southern Africa with 198m, and Eastern Africa with 428m.
These regions are based on the African Union’s official regions for its 55 member states, which differ from the regions used by the United Nations. They include Réunion (1.0m) and Mayotte (0.3m), two French overseas territories in the Indian Ocean that are not members of the African Union, as well as St Helena (5,000), an overseas territory of the UK in the Atlantic. It also includes an estimated 5.8m people living in African Union applicant Somaliland that are included within the number for Somalia.
Excluded are 175,000 or so people living on the African continent in Ceuta and Melilla (Spain), around 2.2m and 250,000 respectively in the Atlantic Ocean on the Canary Islands (Spain) and Madeira (Portugal), and several hundred people in the Indian Ocean within France’s Southern Territories.
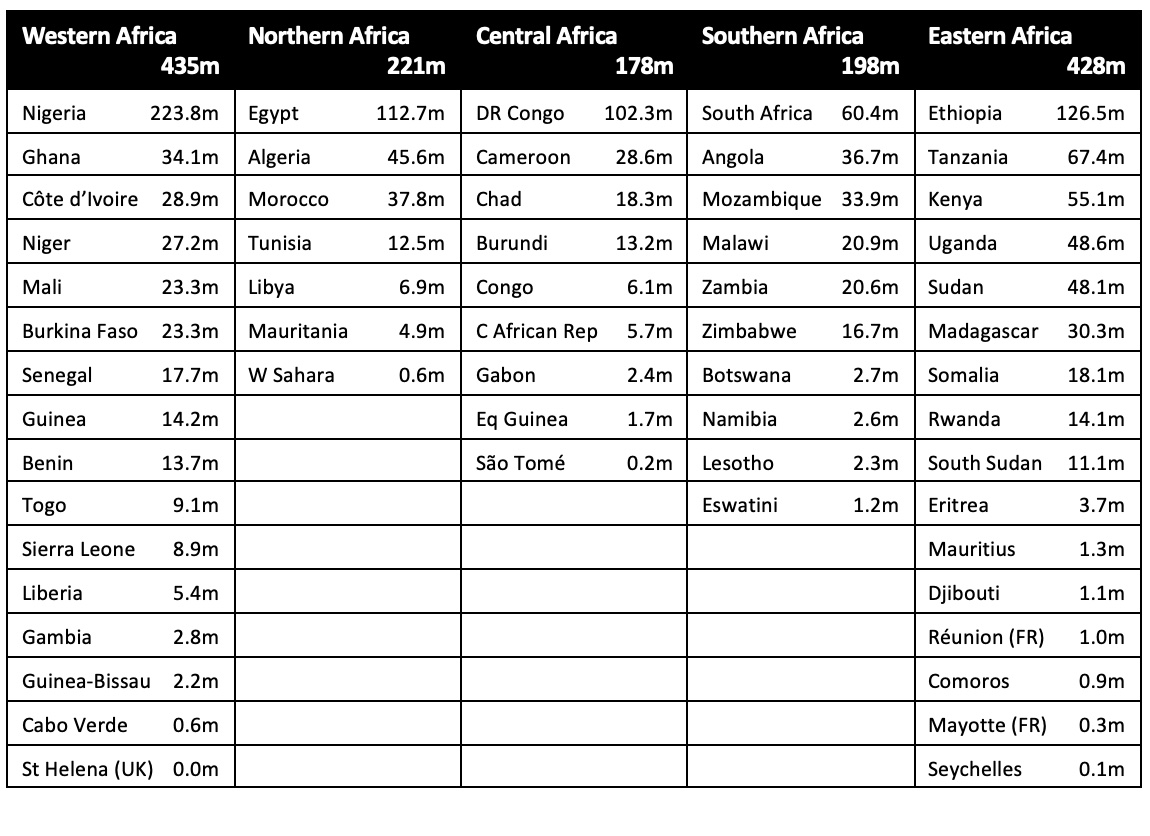
The table below breaks down the total by country within each region, highlighting how the four largest countries by population each have more than 100m people, led by Nigeria with 223.8m (15.3% of Africa’s total), Ethiopia with 126.5m (8.7%), Egypt with 112.7m (7.7%) and the Democratic Republic of the Congo with 102.3m (7.0%).
The next largest are Tanzania with 67.4m (4.6%), South Africa with 60.4m (4.1%), Kenya with 55.1m (3.8%), Uganda with 48.6m (3.3%), Sudan with 48.1m (3.3%), Algeria with 45.6m (3.1%), Morocco with 37.8m (2.6%), Angola with 36.7m (2.5%), Ghana with 34.1m (2.3%), Mozambique with 33.9m (2.3%), Madagascar with 30.3m (2.1%) and Côte d’Ivoire with 28.9m (2.0%).
The population of Africa is expected to grow significantly over the rest of the century, with the UN’s medium variant projecting a population of 1.7bn (20% of the projected global total) in 2030, 2.1bn in 2040 (23%), 2.5bn (26%) in 2050, 2.9bn (28%) in 2060, 3.2bn (31%) in 2070, 3.5bn (34%) in 2080, 3.7bn (36%) in 2090 and 3.9bn (38%) in 2100. This is despite a rapidly declining birth rate, with many more Africans living much longer lives than preceding generations.
Africa is currently relatively poor compared with advanced economies, with the total GDP for its 55 countries and 1.5bn people close in size to the UK’s single country GDP for 67.5m people of around £2.5trn a year at current exchange rates. This is around 3% of the global economy in each case.
The UK’s share of the global economy is likely to decline over the rest of the century as Africa and other developing economies grow at a much faster pace. For Africa the combination of a rapidly growing population and economic development should see it become substantially more significant to the global economy than it is today.
Jeremy Hunt limits his tax and spending ambitions in the Spring Budget to stay within a very tight fiscal rule.
The Spring Budget 2023 for the government’s financial year of 1 April 2023 to 31 March 2024 was presented by the Chancellor of the Exchequer to Parliament on Wednesday 15 March 2023, accompanied by medium-term economic and fiscal forecasts from the Office for Budget Responsibility (OBR) covering the period up to 2027/28.
The fiscal numbers in the Budget are based on the National Accounts prepared in accordance with statistical standards. They differ in material respects from the financial performance and position that will eventually be reported in the Whole of Government Accounts prepared in accordance with International Financial Reporting Standards (IFRS).
A (slightly) lower fiscal deficit in 2023/24
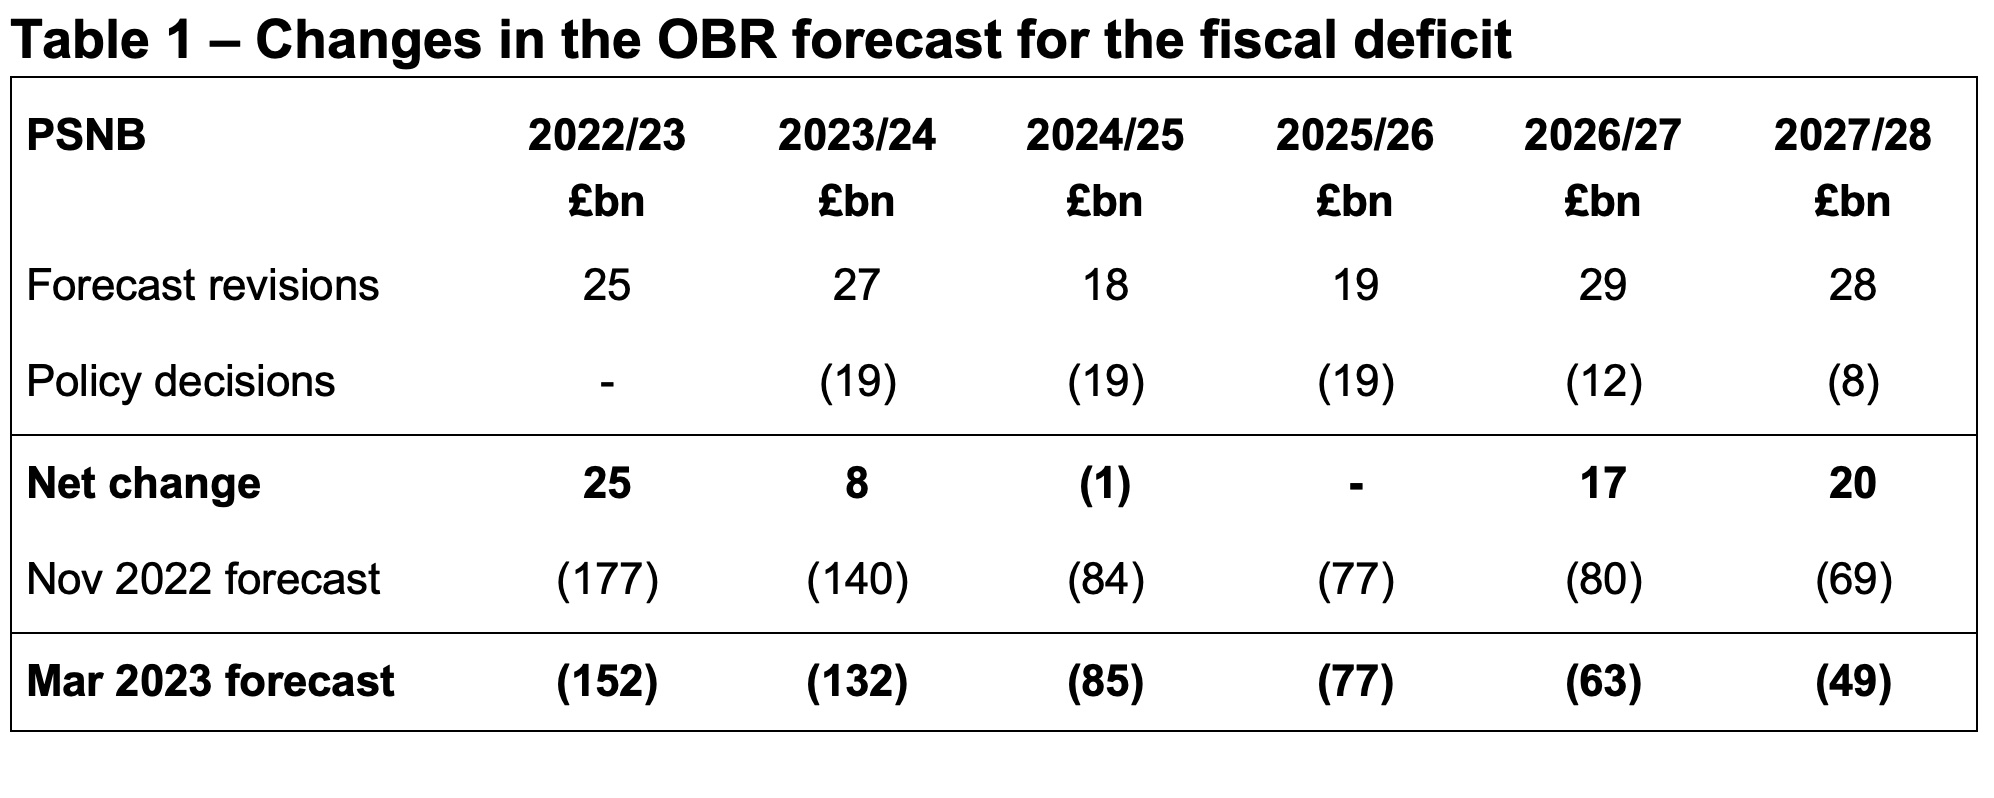
Table 1 shows the Spring Budget estimate for the deficit in 2023/24 is £132bn, £8bn lower than the £140bn forecast in November 2022. Positive revisions to the forecast added £27bn to the bottom line, before £19bn from tax and spending decisions made by the Chancellor.
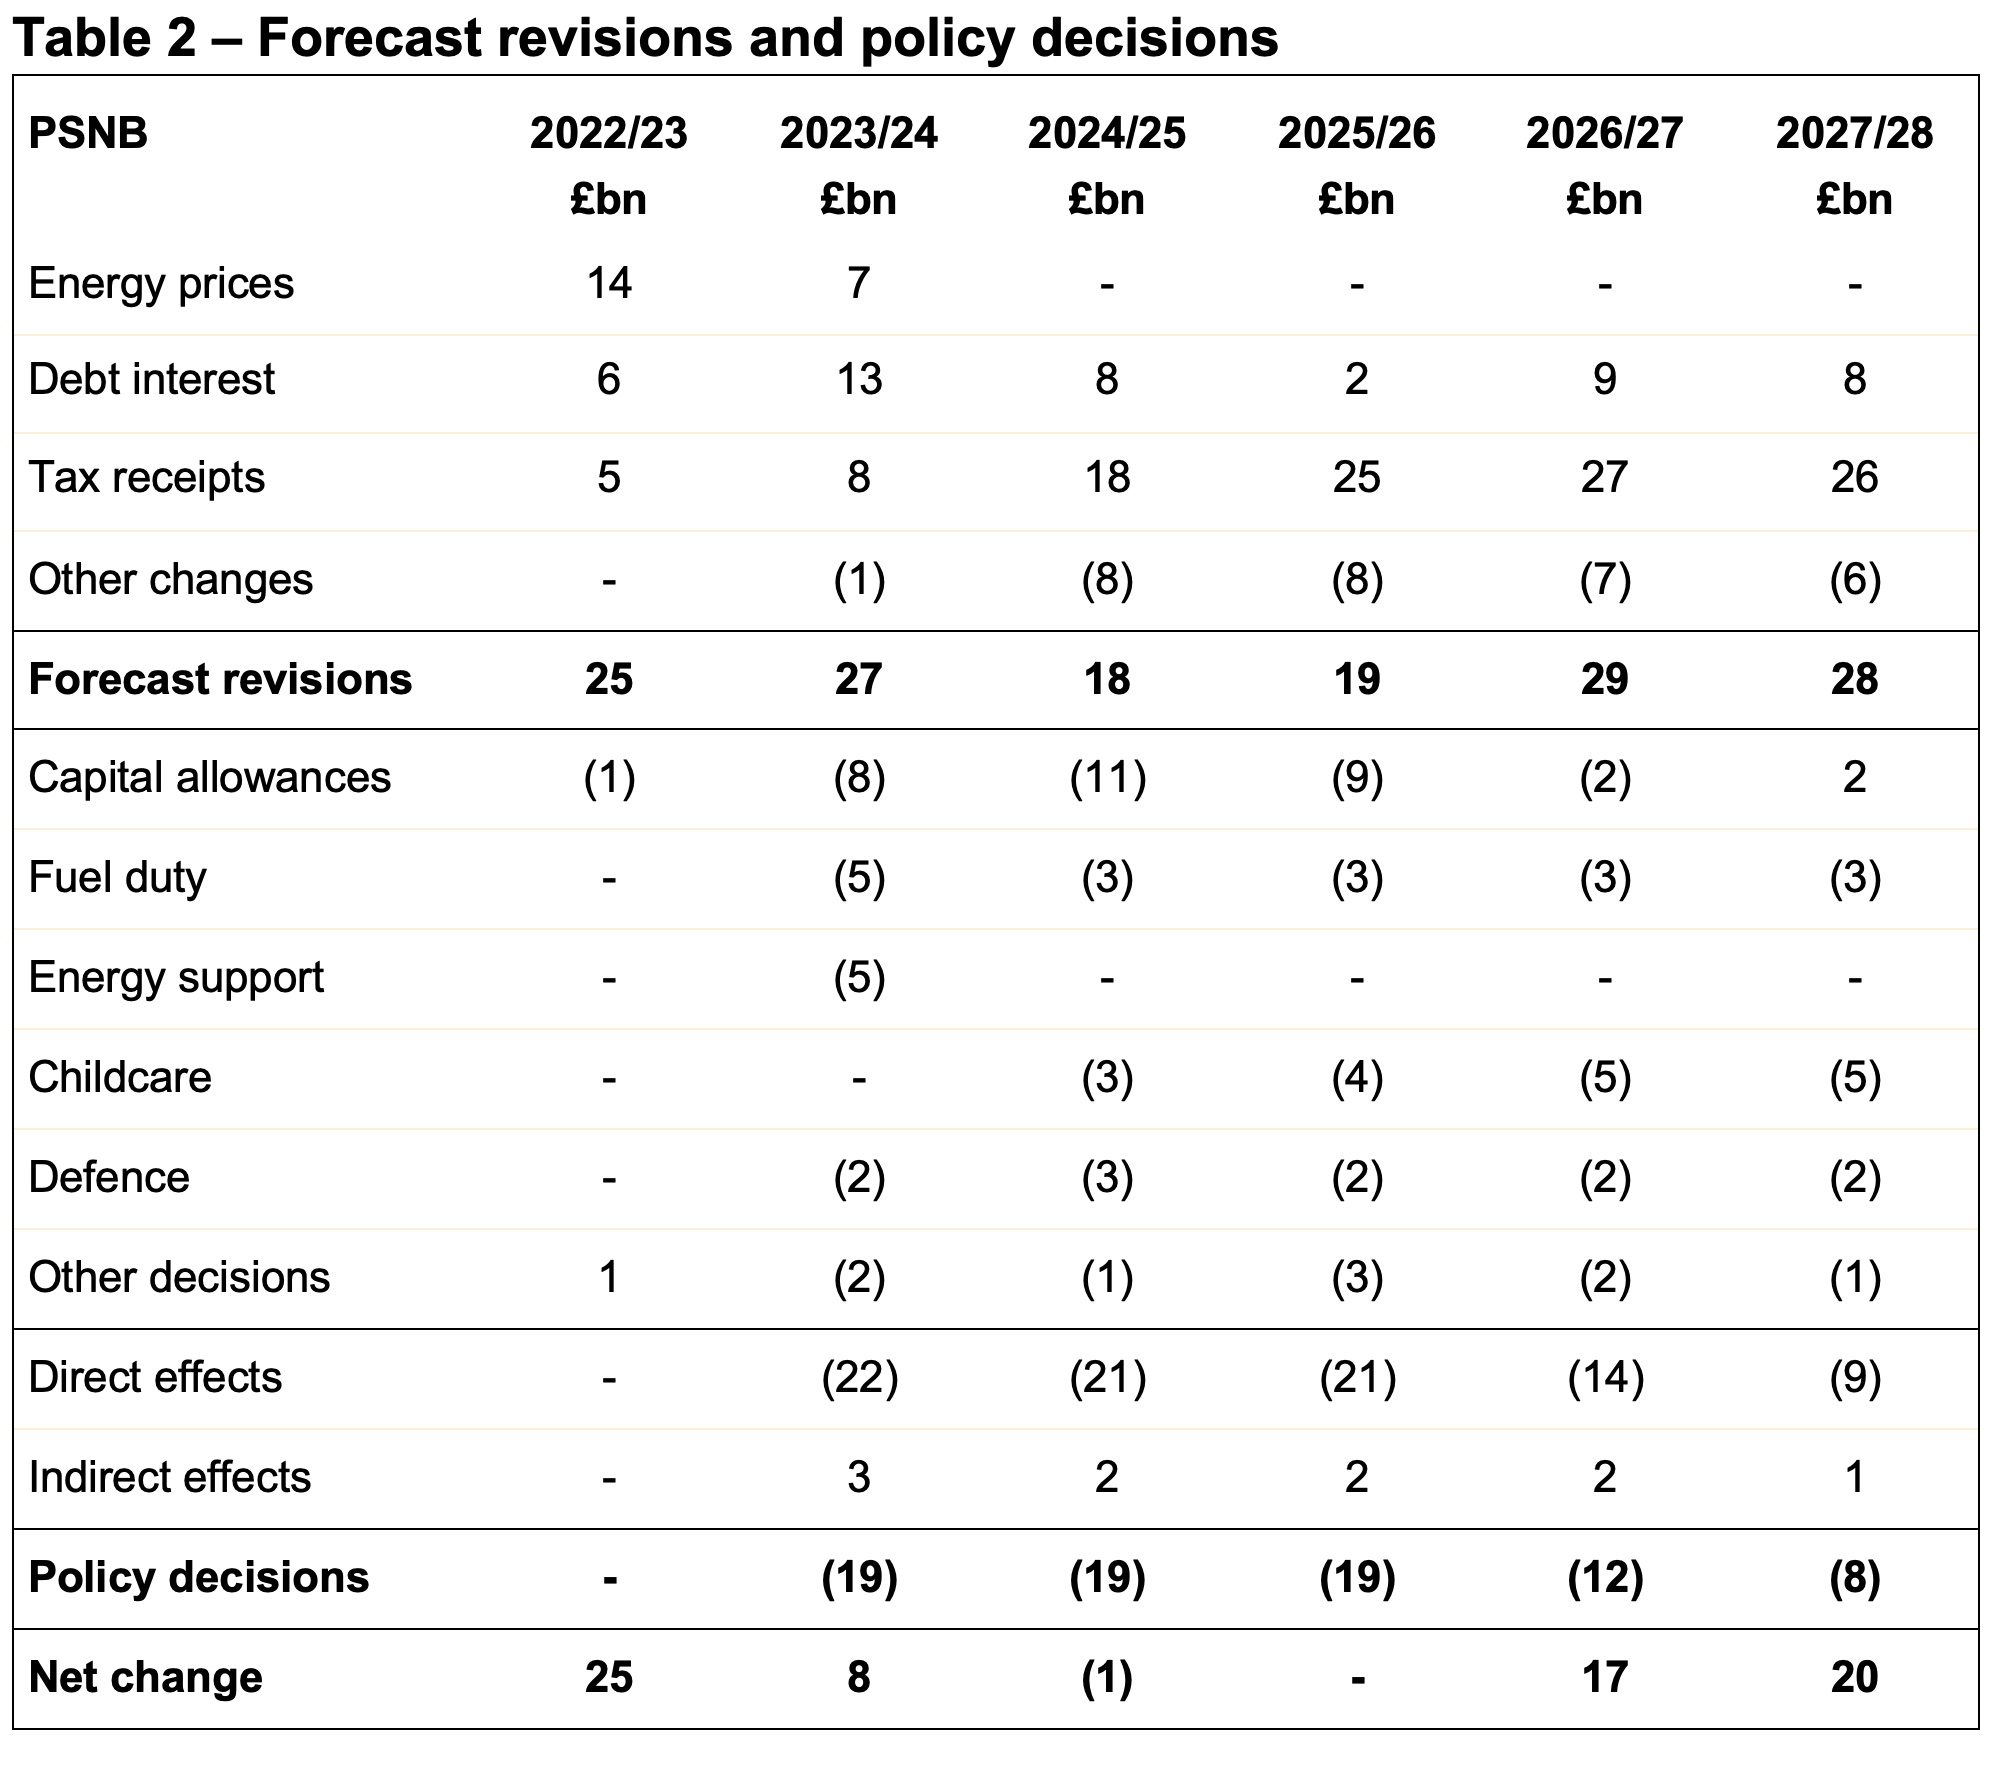
Forecast revisions in 2023/24 comprised £13bn in lower debt interest, £7bn less in energy support and £8bn in higher tax receipts, less £1bn other changes. The cost of tax and spending decisions in 2023/24 was estimated to be £8bn in lower corporation tax receipts from the full expensing of capital expenditure, £5bn from freezing fuel duties, £5bn from extending the energy price guarantee and other energy support measures, £2bn more for defence and security and £2bn from other decisions, less £3bn in indirect effects of those policy decisions on tax receipts and welfare spending.
Total receipts in 2023/24 are now expected to be £1,057bn (£2bn higher than previously forecast) and total managed expenditure is now anticipated to be £1,189bn (£10bn lower).
The forecast for the deficit in 2024/25 was up £1bn at £85bn and was unchanged in 2025/26 at £77bn, with upward revisions of £18bn and £19bn respectively offset by an estimated £19bn net cost of tax and spending decisions. The latter includes £3bn in 2024/25 and £4bn in 2025/26 for expanded childcare eligibility.
The final two years of the forecast were better by £17bn in 2026/27 (down to a fiscal deficit of £63bn) and by £20bn in 2027/28 (down to £49bn), although several commentators have pointed out this is on the basis of unrealistic spending assumptions that do not take account of significant pressures on public services.
In addition to forecasts for the next five years, the OBR also revised its estimate for the deficit in the current financial year ending 31 March 2023 to £152bn, £25bn lower than November’s estimate of £177bn. This is £53bn more than the OBR’s March 2022 estimate of £99bn and £69bn more than the November 2021 Budget estimate of £83m.
Table 2 provides a breakdown of the forecast changes by year, showing how lower debt interest and higher tax receipts flowing through the forecast period have provided the Chancellor with capacity to extend energy support, incentivise business investment, freeze fuel duty for yet another year (and extend the temporary 5p cut) and increase spending in specific areas.
Receipts and expenditure development
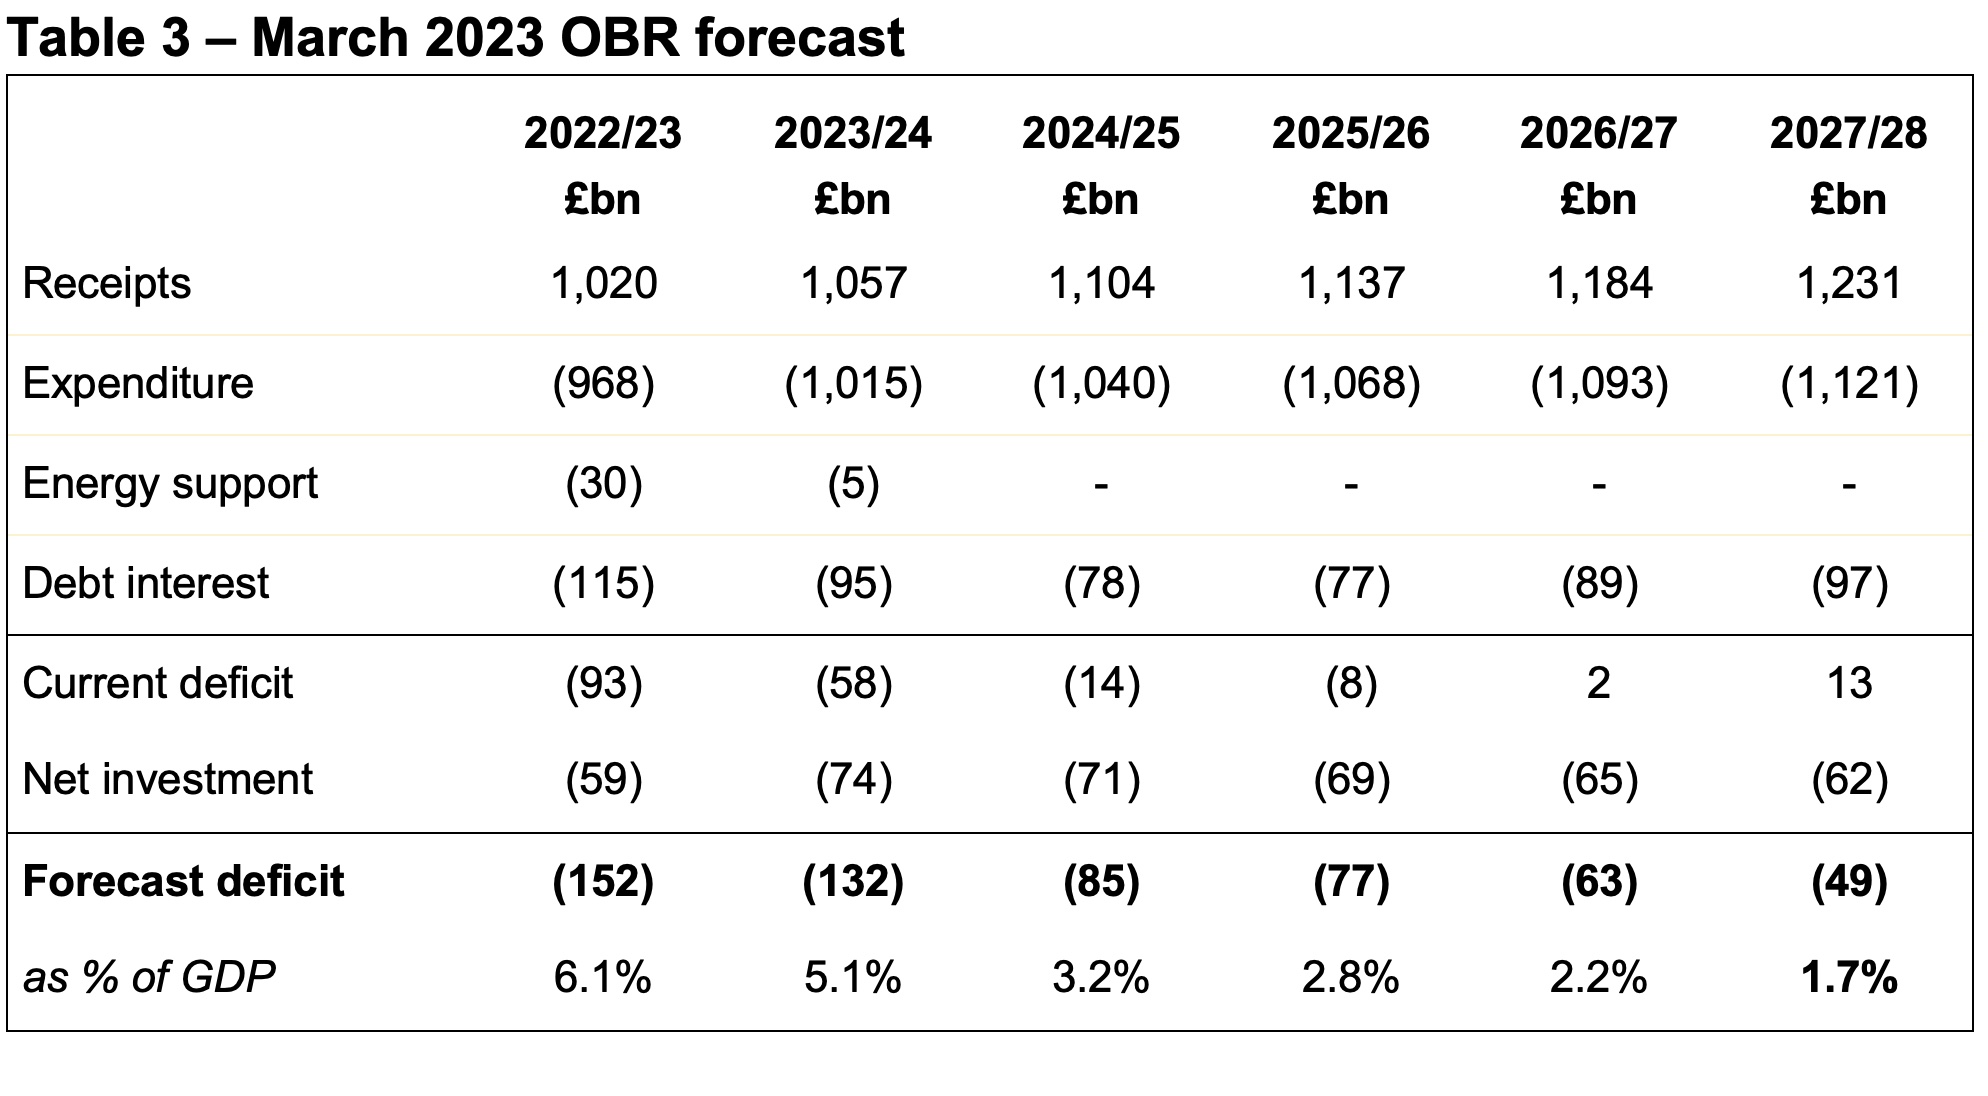
As illustrated by Table 3, receipts are expected to rise from £1,020bn in the current financial year to £1,231bn in 2027/28, while expenditure excluding energy support and interest is expected to rise from £968bn in 2022/23 to £1,121bn in 2027/28..
Interest costs are expected to fall from £115bn this year to £77bn in 2025/26 as interest rates and inflation moderate, before rising to £97bn in 2027/28 based on a growing level of debt.
Net investment is expected to increase in 2023/24 as an £8bn one-off credit from changes in student loan terms in 2022/23 reverses, before declining gradually as capital expenditure budgets flatline and depreciation grows. Public sector gross investment is planned to be £134bn, £134bn, £133bn, £132bn and £132bn over the five years to 2027/28, in effect a cut in real terms over the forecast period.
The government’s secondary fiscal target is to keep the fiscal deficit below 3% of GDP by the end of the forecast period. Based on the March 2023 forecasts, it has headroom of 1.3% of GDP, or £39bn, against this target.
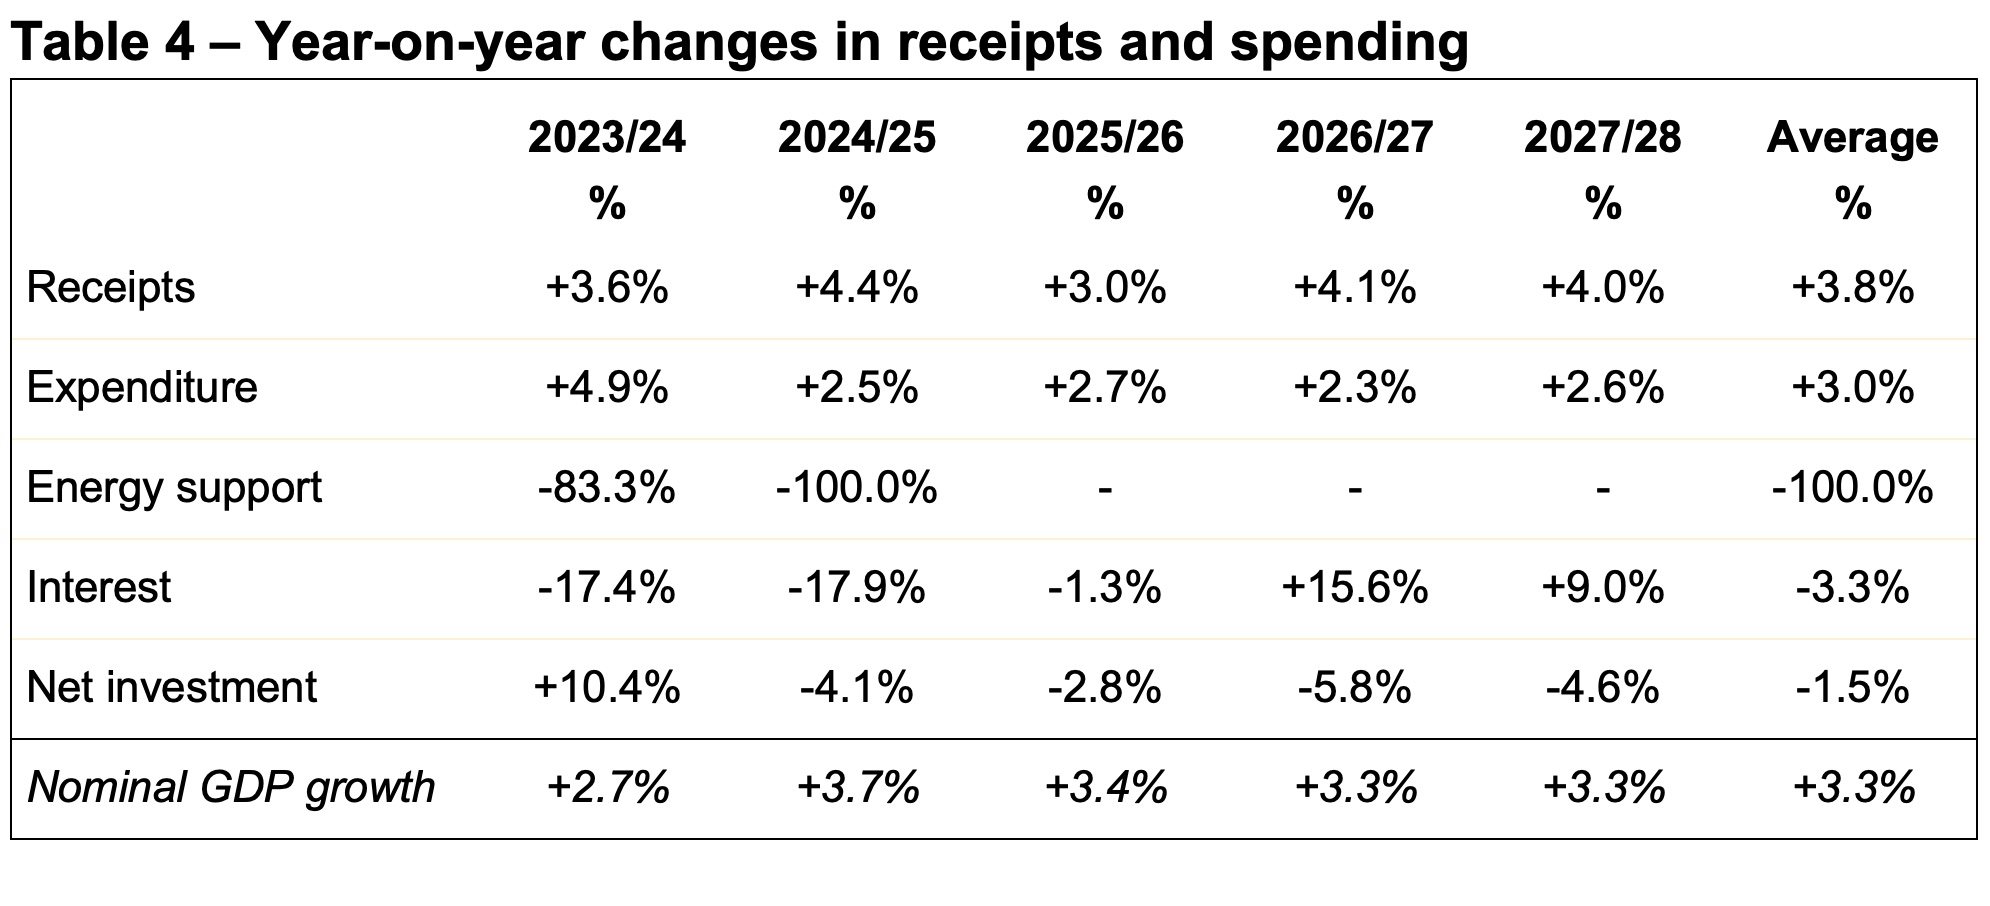
Table 4 provides a summary of the year-on-year changes in receipts and spending, together with the forecast for the increase in the size of the economy, including inflation. This highlights how tax and other receipts are expected to increase faster than the overall rate of growth in the overall size of the economy, while the government plans to constrain the average rise in expenditure excluding energy support and interest to 3.0% including inflation.
The former is principally a result of ‘fiscal drag’ as tax allowances are frozen, bringing in proportionately more in tax as incomes rise with inflation. The latter reflects what is generally considered to be unrealistic plans to constrain public spending in the context of an expected 9% rise in the number of pensioners over the five-year period (that will add to pensions, welfare, health and social care spending), pressure on public sector pay and the deteriorating quality of public services.
Average nominal GDP growth over the five years of 3.3% combines average real-terms economic growth of 1.7% a year and inflation of 1.6%, the latter using the GDP deflator, a ‘whole economy’ measure of inflation. This is different to consumer price inflation, which is forecast to fall to 4.1% in 2023/24 and average 1.4% over the five years to 2027/28.
Public sector net debt
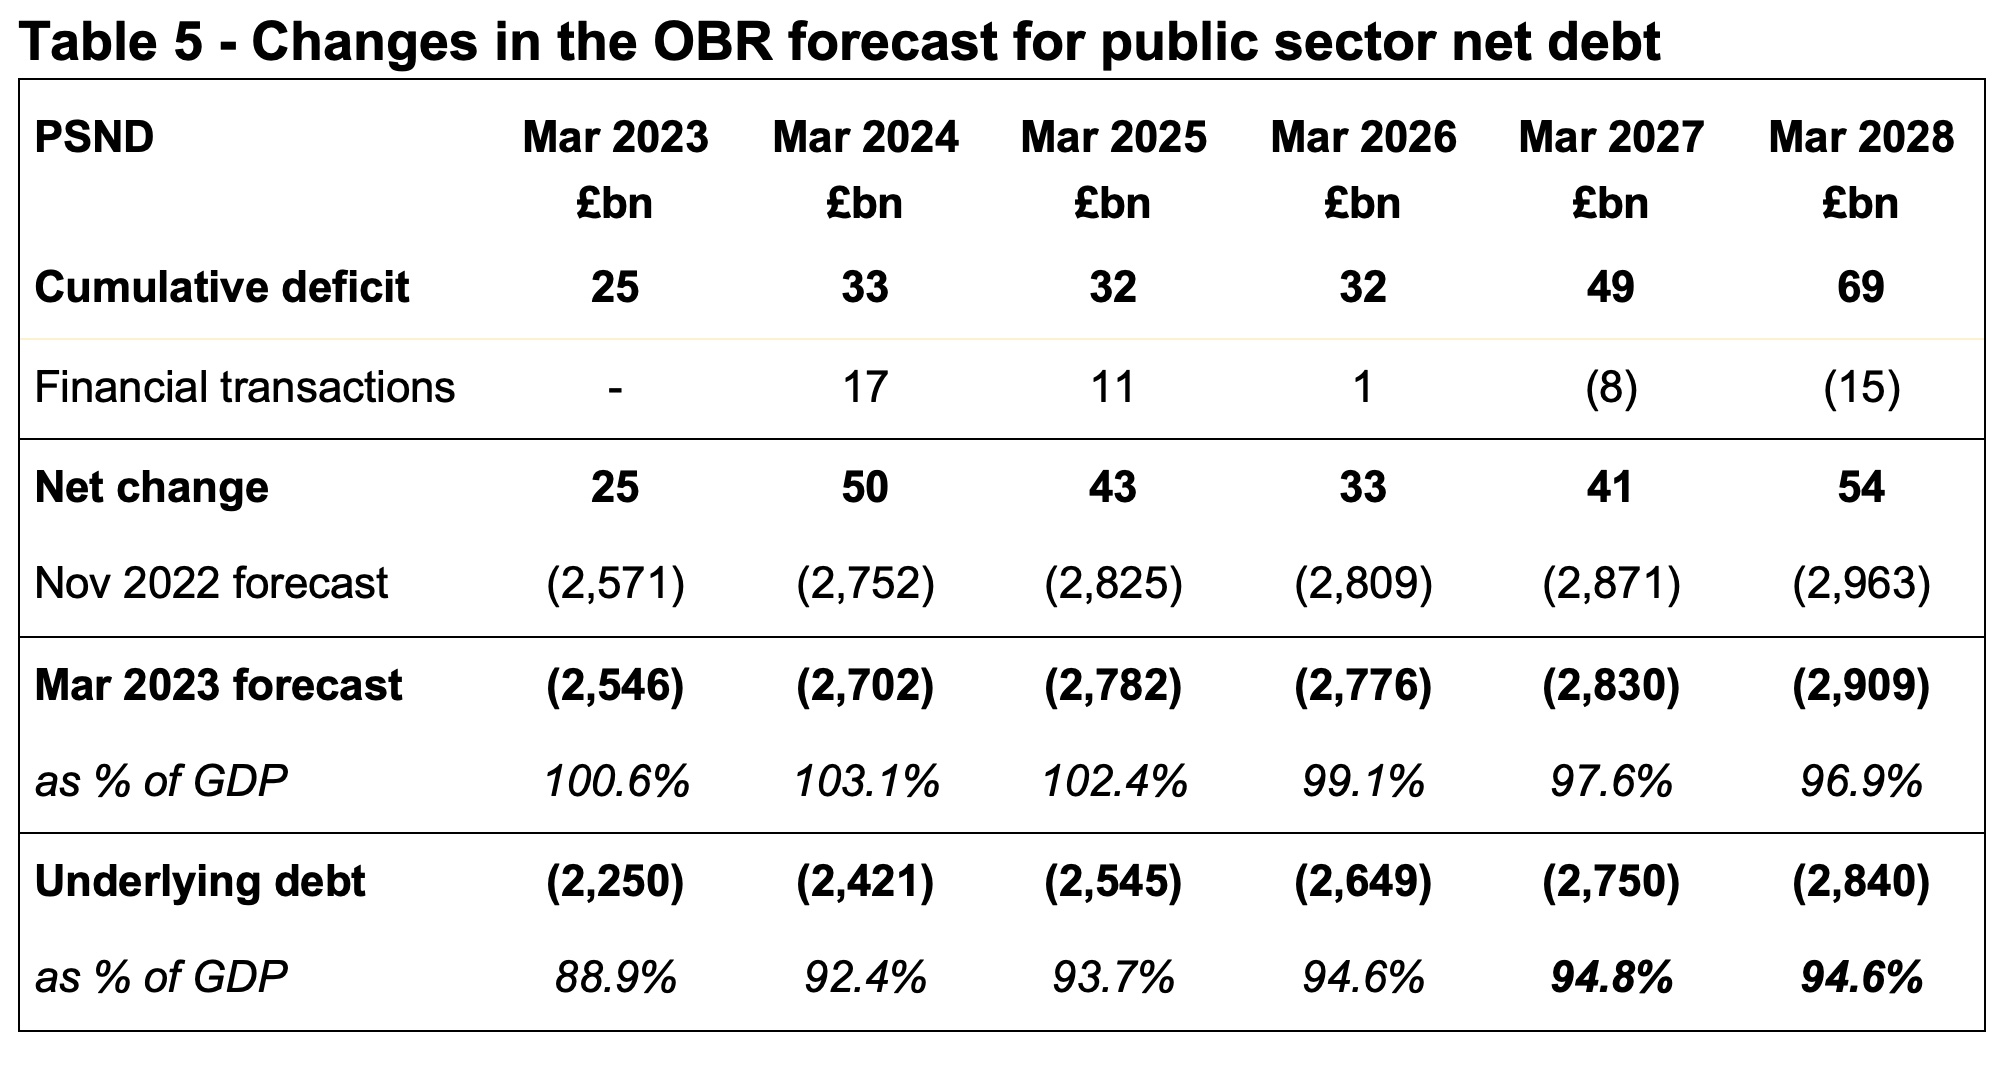
Lower deficits over the forecast period translate into lower borrowing requirements, reducing forecasts for public sector net debt from just under £3.0trn to £2.9trn. This is partly increased or offset by changes in the forecasts for financial and other transactions and working capital movements.
Table 5 shows how forecast public sector net debt is now expected to reach £2,909bn by March 2028, £54bn less than was forecast in November. Although an improvement, debt at the end of the forecast period is expected to be £1,089bn higher than £1,820bn reported for March 2020 before the pandemic, reflecting the large amounts borrowed during the pandemic, in addition to borrowing planned over the next five years.
The government’s primary fiscal target is based on ‘underlying debt’, a non-generally accepted statistical practice measure that excludes the Bank of England and hence quantitative easing balances. Underlying debt needs to be falling as a proportion of GDP between the fourth and fifth year of the forecast period.
The forecast gives the Chancellor just £6.5bn in headroom against this target, with underlying debt / GDP expected to fall from 94.8% to 94.6% between March 2027 and March 2028.
Fiscal rules limit ambitions for tax and spending
Following the disastrous ‘mini-Budget’ of his predecessor Kwasi Kwarteng, the Chancellor’s principal goal has been to stabilise the public finances to provide confidence to debt markets. To do this he has prioritised meeting his fiscal rules over incentivising business investment, cutting taxes and increasing defence spending. He has also adopted what are generally considered to be unrealistic assumptions about public spending in the later years of the forecast to keep within his self-imposed fiscal rules.
This has led to the Chancellor announcing ‘ambitions’ to extend the full expensing of capital expenditure beyond three years and to increase defence and security spending to 2.5% of GDP, as well as continuing to plan for increases in fuel duties each year despite the repeated practice of cancelling these rises.
Because these are ambitions and not plans, they are not incorporated into the forecasts enabling fiscal targets to be met. The OBR reports that continuing to cancel fuel duty rises each year would reduce the headroom to just £2.8bn, while converting the Chancellor’s ambitions to extend full expensing beyond three years and to increase defence spending to 2.5% of GDP into formal plans would cause him to breach his primary fiscal rule.
Conclusion
The overall fiscal position remains weak, with public finances vulnerable to potential economic shocks.
The Chancellor has followed the practice of many of his predecessors in increasing planned borrowing when fiscal forecasts worsen, as occurred in November 2022, only to then use upsides from improvements in subsequent forecasts to fund new tax and spending commitments. This ratchets up borrowing and debt as forecasts fluctuate and creates instability in both tax policy and public spending plans.
The consequence is a relatively unchanged fiscal position for the financial year commencing 1 April 2023 and the two subsequent financial years, as tax and spending decisions offset forecast upsides. And although there is an anticipated improvement in the projected fiscal position in the final two years of the OBR’s five-year forecast (after the next general election), the likelihood is that it will be offset in due course by the reality of pressures on public service and welfare budgets.
There is a reason why the first Budget following a general election typically sees taxes rise and the Spring Budget 2023 suggests that this pattern is likely to be repeated, irrespective of whichever party wins power.
Ahead of the Spring Budget on 15 March, I take a look at how the official forecast for the 2022/23 fiscal deficit has fluctuated through successive forecasts.
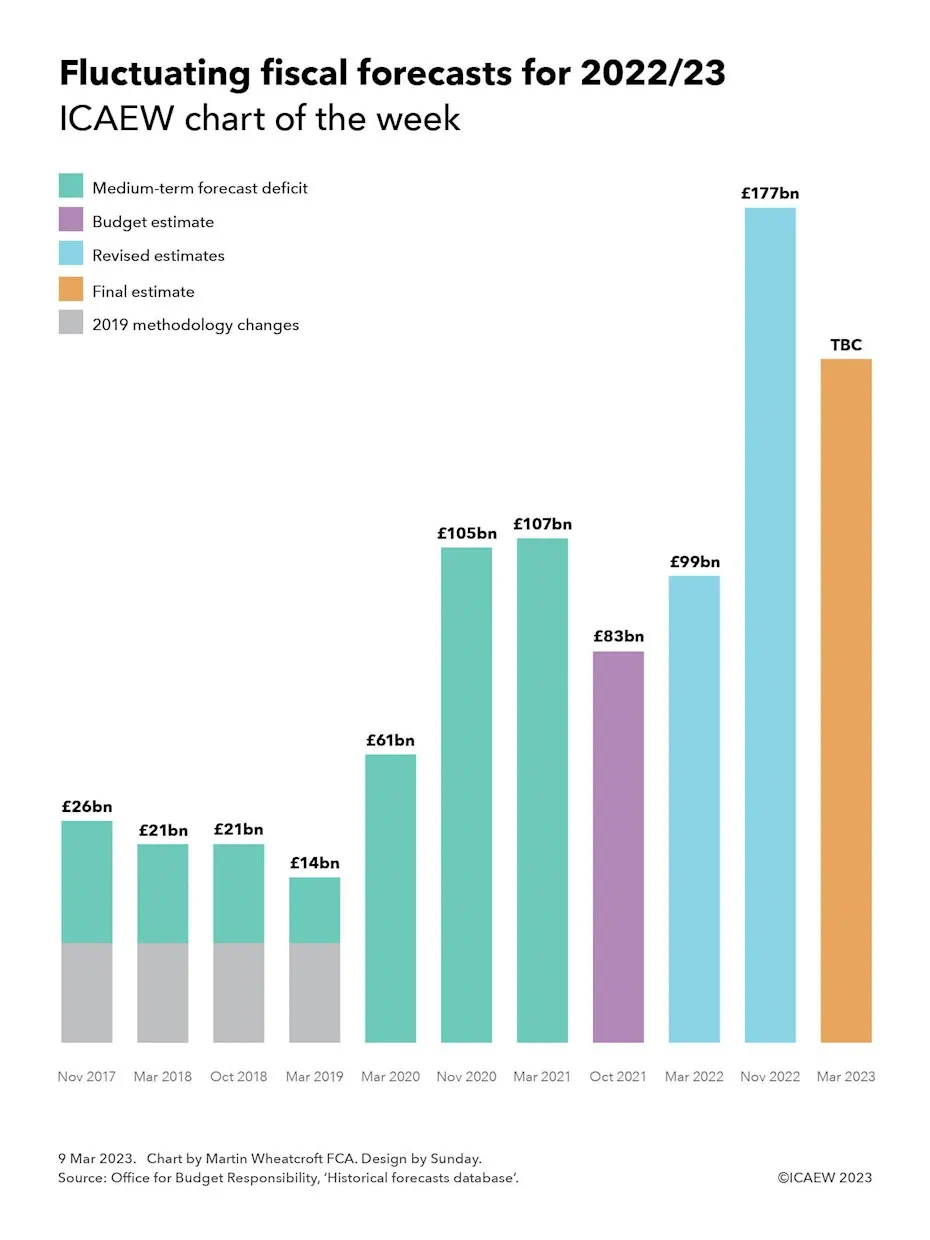
My chart this week is on the topic of fiscal forecasting, and how the forecast deficit for the UK government’s financial year ending 31 March 2023 (2022/23) has changed over the course of five or so years of official forecasts.
Our story starts with the Autumn Budget in November 2017, when the Office for Budget Responsibility (OBR) first published a medium-term fiscal forecast that extended to 2022/23. After plugging economic assumptions into its model and combining it with the government’s plans for public spending, it came up with a forecast of £26bn for the 2022/23 fiscal deficit, the shortfall between receipts and public spending calculated in accordance with statistical rules.
Then Chancellor Philip Hammond was at that time pretty positive about the economic prospects for the UK, despite weak productivity causing him to abandon the government’s medium-term plan to completely eliminate the budget deficit. Instead, he settled for a more modest objective of a balanced current budget and a falling debt-to-GDP ratio, extending austerity policies to cut public spending.
The next few fiscal events saw the OBR revise down its forecast for the 2022/23 deficit in the light of moderately better economic data each time. This saw the forecast for the 2022/23 deficit reduce to £21bn in the March 2018 forecast, stay at £21bn in October 2018 and fall to £14bn in the March 2019 forecast.
The forecasts up to this point were before methodology changes announced in 2019 relating to the treatment of student loans and other items. According to the OBR these had the effect of increasing the forecast for the fiscal deficit in 2022/23 by an estimated £21bn.
The calling of a general election in December 2019 prevented Chancellor Sajid Javid from presenting a Budget in November 2019, so the OBR had to wait until March 2020 to publish its next forecast. At this point, 2022/23 was in the middle of the forecast period and Rishi Sunak’s first fiscal event as Chancellor saw a £26bn increase in the 2022/23 deficit to £61bn in an ‘end-to-austerity’ Budget that saw £46bn in extra planned spending compared with previous forecasts.
Frustratingly for the OBR, its forecasts that day were immediately out of date, as initial emergency pandemic measures were decided too late to be incorporated into its calculations. While these and subsequent temporary measures to support households and businesses through the pandemic primarily affected the 2020/21 and 2021/22 financial years, the economic hit caused by COVID-19 was the primary reason for the OBR increasing its forecast for the 2022/23 fiscal deficit to £105bn in November 2020.
March 2021 saw a small tweak to the forecast to £107bn, but the Autumn Budget and Spending Review in November 2021 saw an improvement to £83bn as the economy emerged from the lockdown phases of the pandemic in a slightly better place than was previously anticipated, with higher spending funded by planned tax rises.
This positive move went into reverse in March 2022 as the OBR revised its Budget estimate upwards to £99bn, reflecting rising interest rates on government debt and the government’s initial response to an emerging cost-of-living crisis.
The OBR was not asked to produce an official forecast to accompany short-lived Chancellor Kwasi Kwarteng’s tax-cutting ‘mini-Budget’ in September. At £177bn the OBR forecast for the 2022/23 fiscal deficit in November 2022 was eye-watering enough, and that was after current Chancellor Jeremy Hunt’s Budget had reversed most of his predecessor’s tax cuts.
Lower than anticipated wholesale energy prices have led several commentators to suggest that the OBR’s final estimate for the fiscal deficit could be revised down by £30bn or more when it presents its medium-term forecasts up to 2027/28 to accompany the Spring Budget on 15 March 2023. As the chart suggests, this is not a ‘windfall’ as some commentators have claimed. Even if the gap between receipts and spending narrows, the deficit will still be significantly higher than the £83bn official estimate included in the Budget for 2022/23 presented to Parliament.
Fiscal forecasting is of course a very difficult task even in normal times. The deficit is the difference between two very large numbers – receipts of just over a trillion pounds and public spending of nearly £1.2trn – that can each move up or down significantly as economic conditions change, and policy choices are made. Add to that a global pandemic, a cost-of-living crisis and an uncertain policy outlook, and it is perhaps unsurprising that the forecasts have changed so much over the past five years.
In an uncertain world, fiscal forecasts fluctuate.
Better than expected self assessment tax receipts helped generate a small fiscal surplus of £5bn in January, reducing the year-to-date deficit to £117bn, £7bn more than the comparative period in the previous financial year.
The monthly public sector finances for January 2023 released on Tuesday 21 February 2023 reported a provisional surplus for the month of £5bn. This was a significant improvement over the deficit of £26bn reported for the previous month (December 2022), but £7bn less than the surplus reported for the same month last year (January 2022).
A surplus arose primarily because better than expected self assessment tax receipts were sufficient to offset the effect of higher interest costs, higher inflation on index-linked debt, and the cost of the energy price guarantee for households and businesses incurred during the month. January also saw the Office for National Statistics (ONS) record a £2bn charge for custom duties that the UK had failed to collect when it was a member of the EU Customs Union.
The cumulative deficit for the first 10 months of the financial year was £117bn, which is £7bn more than in the same period last year but £155bn lower than in 2020/21 during the first stages of the pandemic. It was £64bn more than the deficit of £53bn reported for the first 10 months of 2019/20, the most recent pre-pandemic pre-cost-of-living-crisis comparative period.
The deficit was £22bn below the Office for Budget Responsibility (OBR)’s revised forecast made at the time of the Autumn Statement in November, primarily because the energy price guarantee has cost less than anticipated.
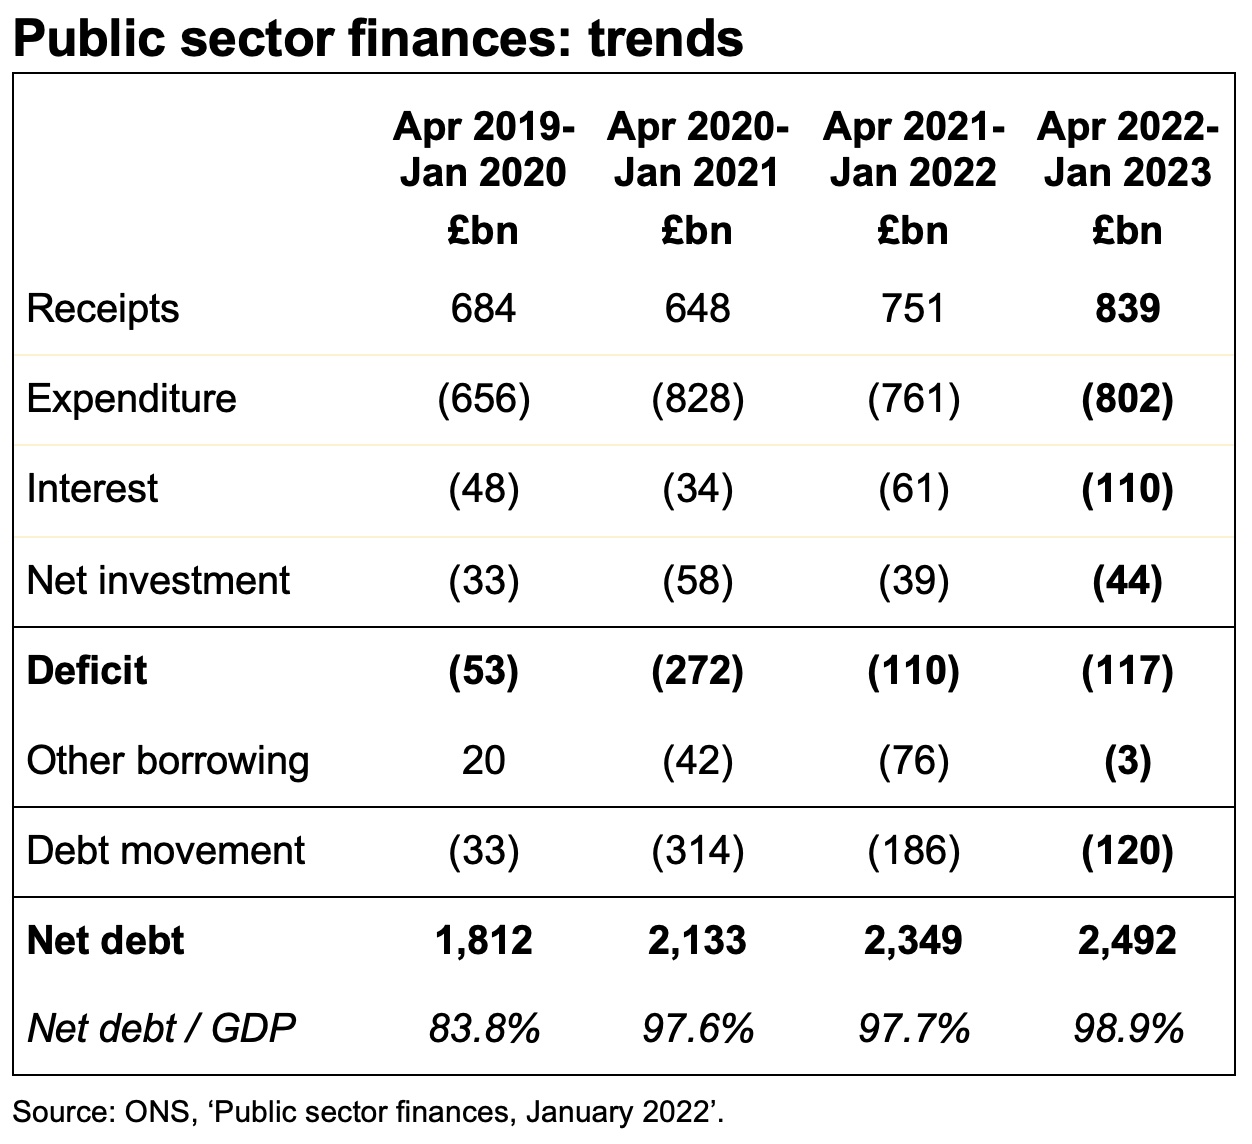
Public sector net debt was £2,492bn or 98.9% of GDP at the end of January 2023, dipping below the £2.5tn reported last month because of corrections to prior month data. This is £672bn higher than net debt of £1,820bn at 31 March 2020, reflecting the huge sums borrowed since the start of the pandemic. The OBR’s latest forecast is for net debt to reach £2,571bn by March 2023 and to approach £3trn by March 2028.
Tax and other receipts in the 10 months to 31 January 2023 amounted to £839bn, £88bn or 12% higher than a year previously. Higher income tax and national insurance receipts were driven by rising wages and the higher rate of national insurance for part of the year, while VAT receipts benefited from inflation in retail prices.
Expenditure excluding interest and investment for the ten months of £802bn was £41bn or 5% higher than the same period in 2021/22, with Spending Review planned increases in spending, the effect of inflation, and the cost of energy support schemes partially offset by the furlough programmes and other pandemic spending in the comparative period not being repeated this year.
Interest charges of £110bn for the 10 months were £49bn or 80% higher than the £61bn reported for the equivalent period in 2021/22, through a combination of higher interest rates and higher inflation driving up the cost of RPI-linked debt.
Cumulative net public sector investment to January was £44bn, £5bn more than a year previously. This is much less than might be expected given the Spending Review 2021 pencilled in significant increases in capital expenditure budgets in the current year.
The increase in net debt of £120bn since the start of the financial year comprised borrowing to fund the deficit for the 10 months of £117bn together with a further £3bn to fund student loans, lending to businesses and others, and working capital requirements, net of cash inflows from repayments of deferred taxes and loans made to businesses during the pandemic.
Alison Ring OBE FCA, Public Sector and Taxation Director for ICAEW, said: “With a small surplus, January’s fiscal numbers benefited from stronger self-assessment tax receipts than expected, providing some comfort to Chancellor Jeremy Hunt as he assembles his first Budget. The deficit for the current financial year is still on track to be one of the highest ever recorded, reaching £117bn for the ten months to January 2023 after energy support and interest costs more than offset the benefit of higher tax receipts.
“Although it appears that inflation has peaked, the near-term economic outlook continues to deteriorate and so calls for immediate tax cuts are likely to remain unanswered. We are asking the Chancellor to take urgent action to eliminate the backlog at HMRC that is inhibiting business growth, and to make improving the resilience of the UK economy and the public finances a priority.”
Caution is needed with respect to the numbers published by the ONS, which are expected to be repeatedly revised as estimates are refined and gaps in the underlying data are filled.
The ONS made several revisions to prior period fiscal numbers to reflect revisions to estimates. These had the effect of reducing the reported fiscal deficit for the nine months ended 31 December 2022 by £6bn to £122bn and reducing the reported fiscal deficit for the year to 31 March 2022 by £1bn to £122bn.
My chart this week illustrates the slowing rate of inflation and how it should fall further once a big surge in prices between February and April 2022 falls out of the year-on-year comparison.
The Office for National Statistics (ONS) reported that the annual rate of consumer price inflation (CPI) was 10.1% in January 2023, falling from 10.5% last month and down from a peak of 11.1% in October 2022, but much higher than the 5.5% annual rate of inflation for the year to January 2022.
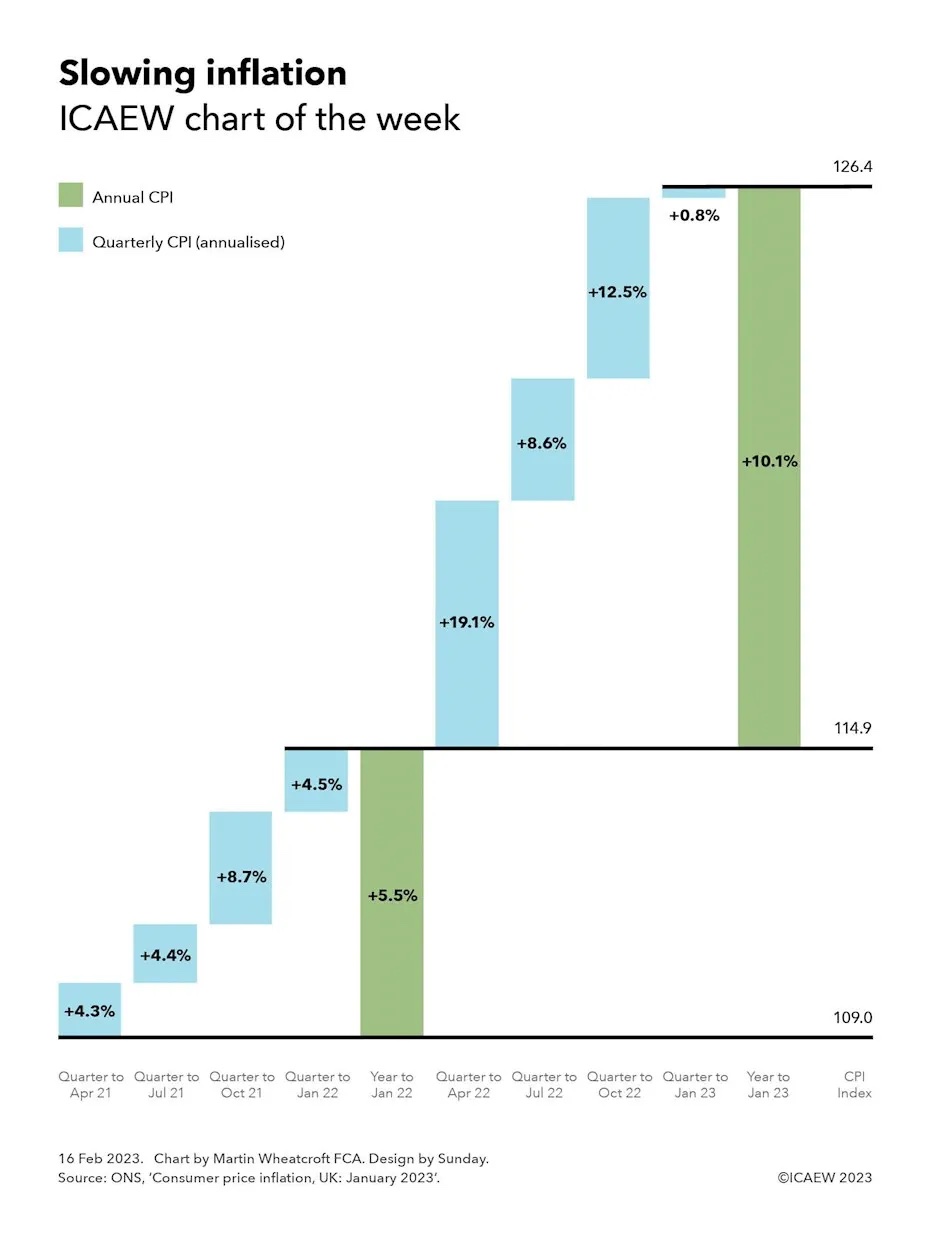
Our chart breaks down annual inflation over the past two years to January 2023 into quarters, highlighting how inflation is likely to fall quite rapidly over the next three months as the big surge in prices following Russia’s invasion of Ukraine last year falls out of the year-on-year comparison.
Reported inflation this time last year was 5.5% for the year to January 2022. This can be broken down into quarterly rises (annualised) of 4.3% in the three months to April 2021, 4.4% in the quarter to July 2021, 8.7% in the quarter to October 2021 and 4.5% in the three months to January 2022. Inflation in that period was well above the Bank of England’s target range of 1% to 3%, as supply constraints drove prices higher as the domestic and global economies started to recover from the depths of the pandemic.
Reported inflation for the year to January 2023 of 10.1% can be broken down into quarterly rises (annualised) of 19.1% in the quarter to April 2022, 8.6% in the quarter to July 2022, 12.5% in the quarter to October 2022 and 0.8% in the three months to January 2023. The sharp jump in prices in the period from February to April 2022 was driven by a rapid rise in energy prices following Russia’s invasion of Ukraine that added to existing inflationary pressures, turbo charging the rate of inflation. Since then, prices across the economy have risen rapidly, although with wholesale energy prices retreating from their peak recently, the overall rate of price rises has slowed down significantly in the last quarter.
The chart also shows how the consumer price inflation index (the CPI Index) increased from 109.0 in January 2021 to 114.9 in January 2022 and to 126.4 in January 2023.
The chart doesn’t show the intermediate annual rates of inflation, although these can be calculated using the geometric average of the preceding four quarters. The annual rate increased from 5.5% in January 2022 to 9.0% in April 2022, then to 10.1% in July 2022 before reaching a peak of 11.1% in October 2022, following which it fell to 10.1% in January 2022.
Successively dropping quarters from the previous year out of the year-on-year comparison and replacing them with price rises over the most recent quarter saw inflation rise as quarterly rises (annualised) of 4.3% fell out to be replaced by 19.1%, 4.4% by 8.6%, and 8.7% by 12.5%, before inflation fell over the last three months as 4.5% was replaced by 0.8%.
These ‘base effects’ mean that most commentators expect a sharp slowdown in the annual inflation rate over the next nine months as monthly and quarterly price rises over that time should be much lower than the comparatives falling out of the year-on-year calculation. The biggest fall is expected over the next three months, as even with a sizeable rise in domestic energy prices expected in the month of April 2023 as government support is withdrawn, price rises are expected to be much lower than the 19.1% annualised rate seen in the quarter to April 2022.
While the medicine of higher interest rates is no doubt playing a key part in restraining prices from rising as fast as they did last year, the Bank of England knows that arithmetic should be the biggest contributor to inflation coming down over the course of 2023.
My chart this week illustrates the choppy economic waters facing UK businesses as more stopped trading than were created over the course of 2022.
The Office for National Statistics (ONS) published its latest quarterly experimental statistics on business births and deaths on 2 February 2023. This reports that business closures have increased since before the pandemic at the same time as business creations have fallen, resulting in net reductions in the number of VAT- or PAYE-registered businesses operating in the UK over the past six quarters.
The statistics are taken from the government’s Inter-Departmental Business Register, a database of approximately 2.8m businesses registered for either PAYE or VAT, just over half of the estimated 5.5m businesses operating in the UK (according to the Department of Business & Trade). The difference principally relates to sole traders with turnover below the VAT threshold who have not voluntarily registered for VAT, or for PAYE if they trade through a company. There is also a time lag on reporting the closure of businesses where a business continues to be registered, with the ONS waiting for several periods of zero VAT or zero payrolls before recording a business as closed.
The statistics are labelled as experimental because they are not as rigorous as annual statistics, but the advantage is that they provide data on business births and deaths in 2022, for which we will not get a full set of annual numbers until towards the end of this year.
As our chart illustrates, the quarterly net change in businesses in 2017 was +18,390, -15,460, +3,825 and +6,320 respectively, followed by +1,520, +15,165, +13,750, +4,365 in 2018, +19,120 and +4,265, +10,530 and +9,980 in 2019. The pandemic saw a fall in business closures as government support enabled businesses that would otherwise have stopped operating to stay alive, with a net decrease of -6,750 in Q1 2020 followed by net increases of +750, +16,170, +3,115 in the second, third and fourth quarters of 2020.
A spurt in business creations in early 2021 saw net increases of +15,245 and +2,885 in the first two quarters, before net decreases of -2,070 and 7,170 in the last two quarters of 2021. With pandemic support measures coming to an end and the onset of the energy crisis, the trend moved further into negative territory with quarterly net closures of -11,785, -5,930, -11,915 and -12,945 in 2022.
Quarterly business deaths averaged around 81,400 in 2017, 76,300 in 2018, 78,000 in 2019, 77,200 in 2020, 86,300 in 2021 and 91,800 in 2022, while quarterly business births averaged around 84,700 in 2017, 85,000 in 2018, 88,900 in 2019, 80,500 in 2020, 88,600 in 2021 and 81,200 in 2022.
These numbers will not be pretty reading for Kemi Badenoch, the new Secretary of State for Business and Trade. With interest rates on the rise, energy costs still at very high levels and consumers cutting back on spending, the risks are that many more existing businesses will cease trading, while business creations may continue to be subdued.
One crumb of comfort is that businesses founded during downturns are believed to do better than those founded in good times. So, if you are thinking of striking out on your own with a new business idea, there may be no better time than now.
Inflation is believed to have peaked last quarter before being forecast to fall significantly over the course of 2023. We hope.
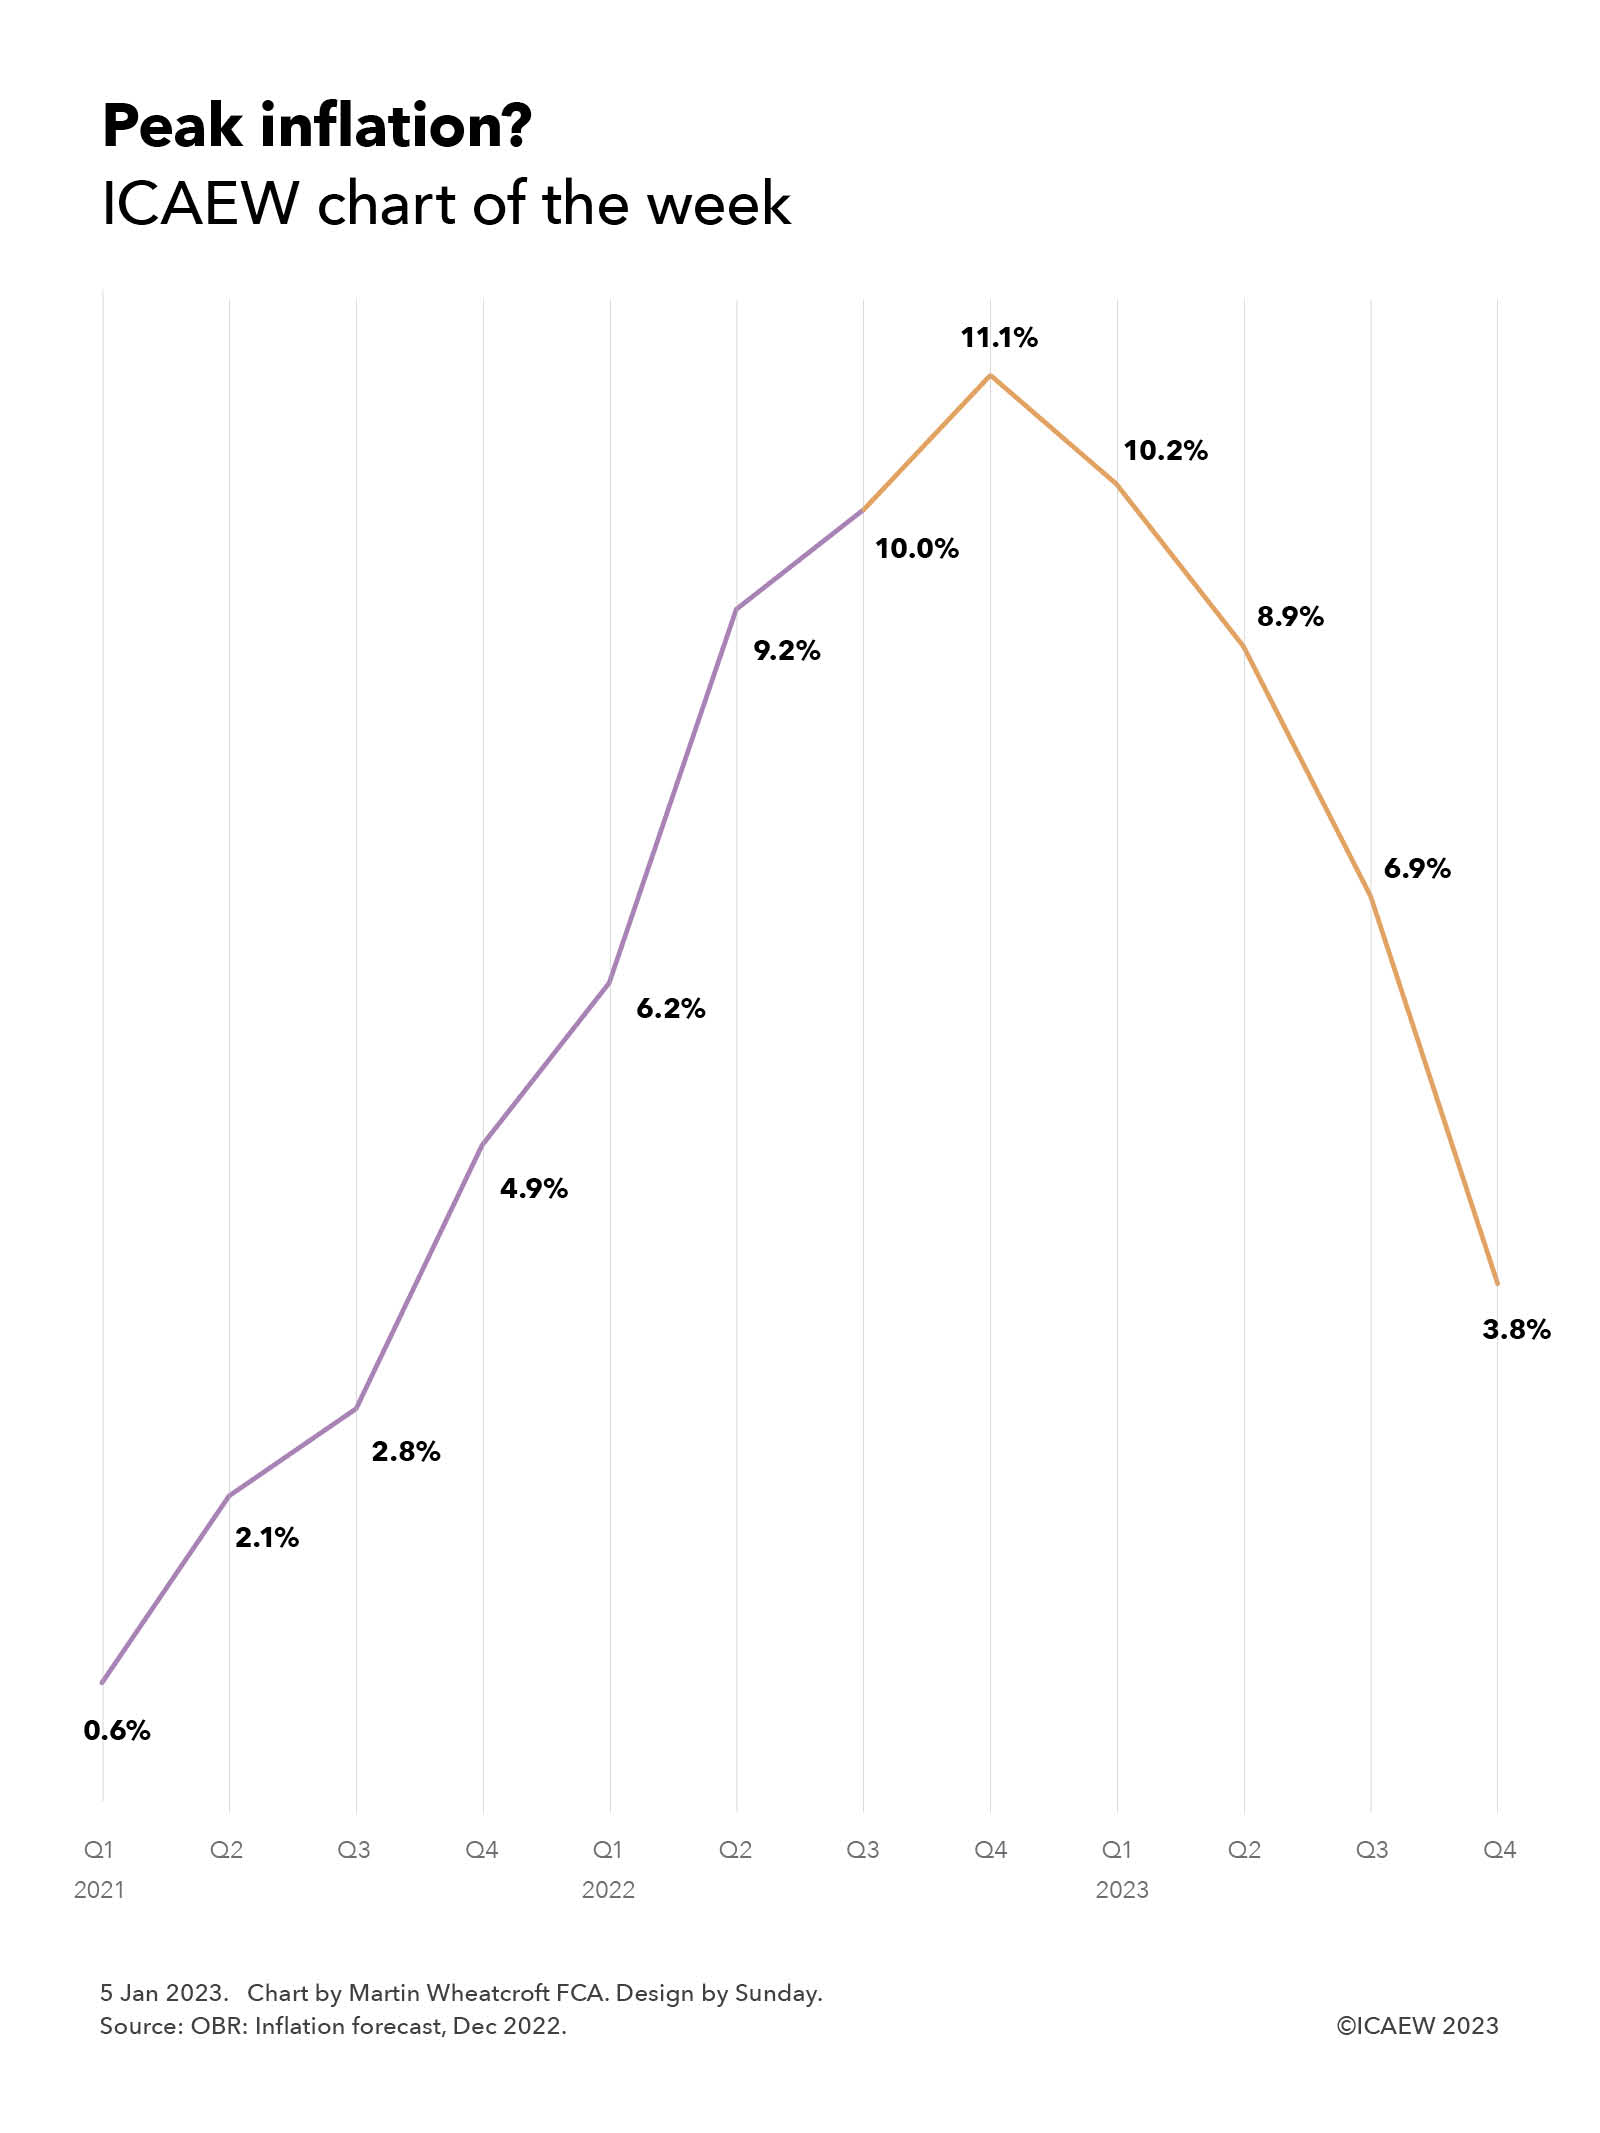
Our first chart of 2023 is on the prospects for consumer price inflation (CPI) over the course of the coming year, based on the latest forecasts for inflation from the Office for Budget Responsibility (OBR) that were released on 21 December 2022.
The OBR’s calculations suggest that CPI should come down significantly over the next four quarters to reach 3.8% by the end of the year, ‘only’ 0.8% above the Bank of England target range of 1% to 3%. The return of inflation to more moderate levels should help stabilise an economy that is currently in a pretty bad place, although it is important to understand that prices will still be rising, just at a slower pace than they have been over the course of the past year.
The chart illustrates how inflation started to rise in 2021, from a below-target 0.6% in Q1, to 2.1% in Q2, then 2.8% in Q3, before jumping to 4.9% at the end of 2021. The Russian invasion of Ukraine in the first quarter of 2022 and its consequences for global energy prices drove the inflation rate even higher, to 6.2% in Q1, 9.2% in Q2 and 10% in Q3, before rising to a forecast peak of 11.1% in Q4 of 2022. The OBR then goes on to forecast that the rate of price increases experienced by consumers will moderate in the coming year, down to 10.2% in Q1, 8.9% in Q2, 6.9% and then 3.8% in the fourth quarter of 2023.
Of course, economic forecasts of this nature are inherently uncertain, especially given the role that volatile energy prices play, both in their own right but also as a cost input to many other products and services. For consumers, the withdrawal of the Energy Price Guarantee will mean energy bills are likely to rise significantly in the second quarter despite falling wholesale prices.
The chart does not extend into 2024, when the forecasts are even more uncertain than for the current year. The OBR suggests that inflation could turn negative during 2024 (Q1: 2.5%; Q2: 0.4%; Q3: -0.2%; Q4: -0.1%) and 2025 (Q1: -0.1%; Q2: -0.6%; Q3: -1.1%; Q4: -1.3%), before heading back to target in 2026 (Q1: -1.0%; Q2: -0.4%; Q3: 0.9%; Q4: 1.2%). Deflation brings with it a whole different set of economic challenges to be faced but, fortunately, forecasts are less accurate the further into the future they go. The hope is that the Bank of England will be able to time its switch in monetary policy actions from countering inflation to countering deflation just right in order to avoid this potential outcome.
Either way, the prospect of inflation coming down over the coming year is a positive amid an otherwise very bleak economic picture for the UK as we begin 2023.