My chart for ICAEW this week takes a look at how average earnings have risen over the last decade and how they compare with the headline rate of inflation.
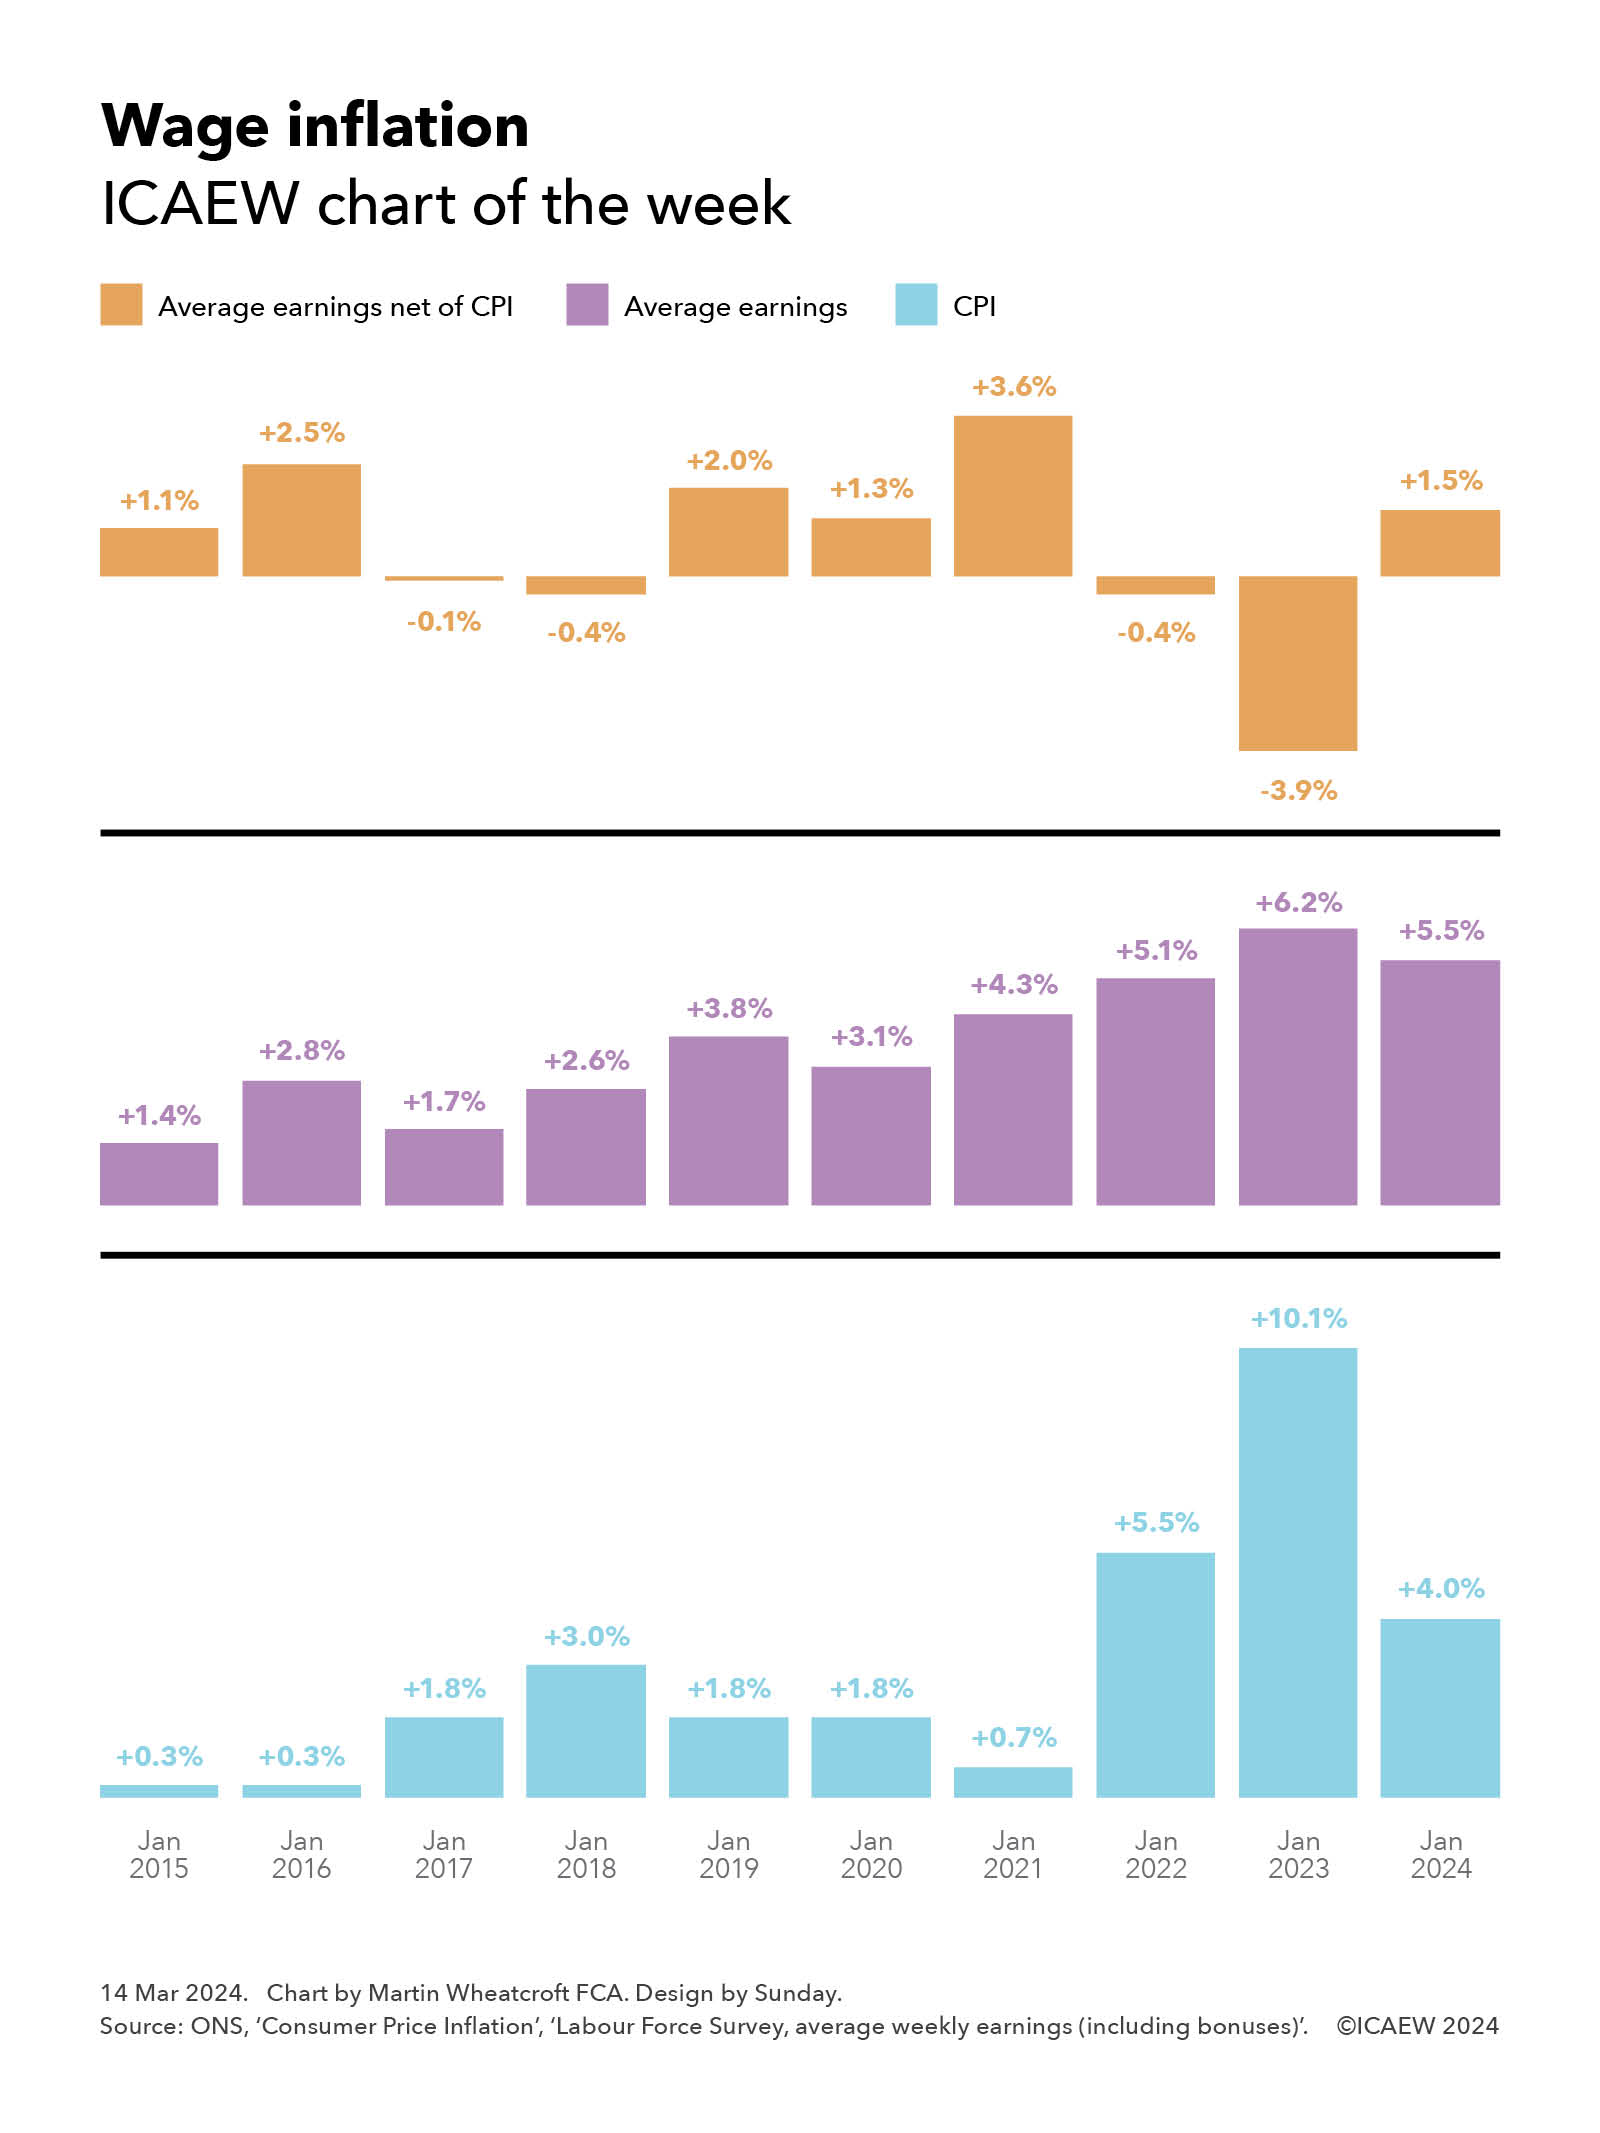
According to the Office for National Statistics (ONS), average weekly earnings including bonuses on a seasonally adjusted basis increased by 5.5% between January 2023 and January 2024 to £672 (equivalent to £2,912 per month). This is 1.5 percentage points higher than the rate of consumer price inflation (CPI) over the same 12-month period of 4.0%.
While this might seem positive for the theoretical ‘average’ worker, this follows a 6.2% increase in the preceding year to January 2023, 3.9 percentage points lower than the corresponding 10.1% increase in consumer prices.
Our chart this week takes these numbers back a decade, with CPI of 0.3%, 0.3%, 1.8%, 3.0%, 1.8%, 1.8%, 0.7%, 5.5%, 10.1% and 4.0% respectively in the years from January 2015 through to January 2024. Average earnings increased by 1.4%, 2.8%, 1.7%, 2.6%, 3.8%, 3.1%, 4.3%, 5.1%, 6.2% and 5.5% respectively over the same period, giving rise to net differences of +1.1%, +2.5%, -0.1%, -0.4%, +2.0%, +1.3%, +1.3%, +3.6%, -0.4%, -3.9% and +1.5%.
Overall, wages have increased faster than inflation over the last decade, up 43.2% compared with a 32.8% increase in the CPI Index, equivalent to average rises of 3.7% a year and 2.9% a year respectively – or a net 0.8 percentage point a year improvement in average wages over CPI.
Private sector wages have risen faster at 45.7% over ten years (3.8% a year on average), while public sector wages have gone up by 33.7% (2.9% a year on average), only marginally ahead of CPI (by 0.07% a year). Of course, averages are just that and individual and household experiences will differ significantly.
This comparison would not be approved of by the statistical authorities, who prefer the consumer prices including housing (CPIH) measure of inflation to headline CPI. However, CPIH was up 31.7% over the past decade to January 2024 (or 2.8% a year on average), so while the numbers might have been slightly different in individual years if we had used CPIH in the chart, the increase in average wages over 10 years is only slightly better – by 1.1% in total or 0.1% a year on average.
Assuming inflation falls to below 2% later this year as predicted, the picture for the coming year is likely to show a significant positive variance for earnings, especially given the 9.8% increase in the minimum wage scheduled for April. This should have the effect of pushing up average earnings, unless something very surprising happens to wages further up the income scale.
For more ICAEW analysis on the economy, click here.