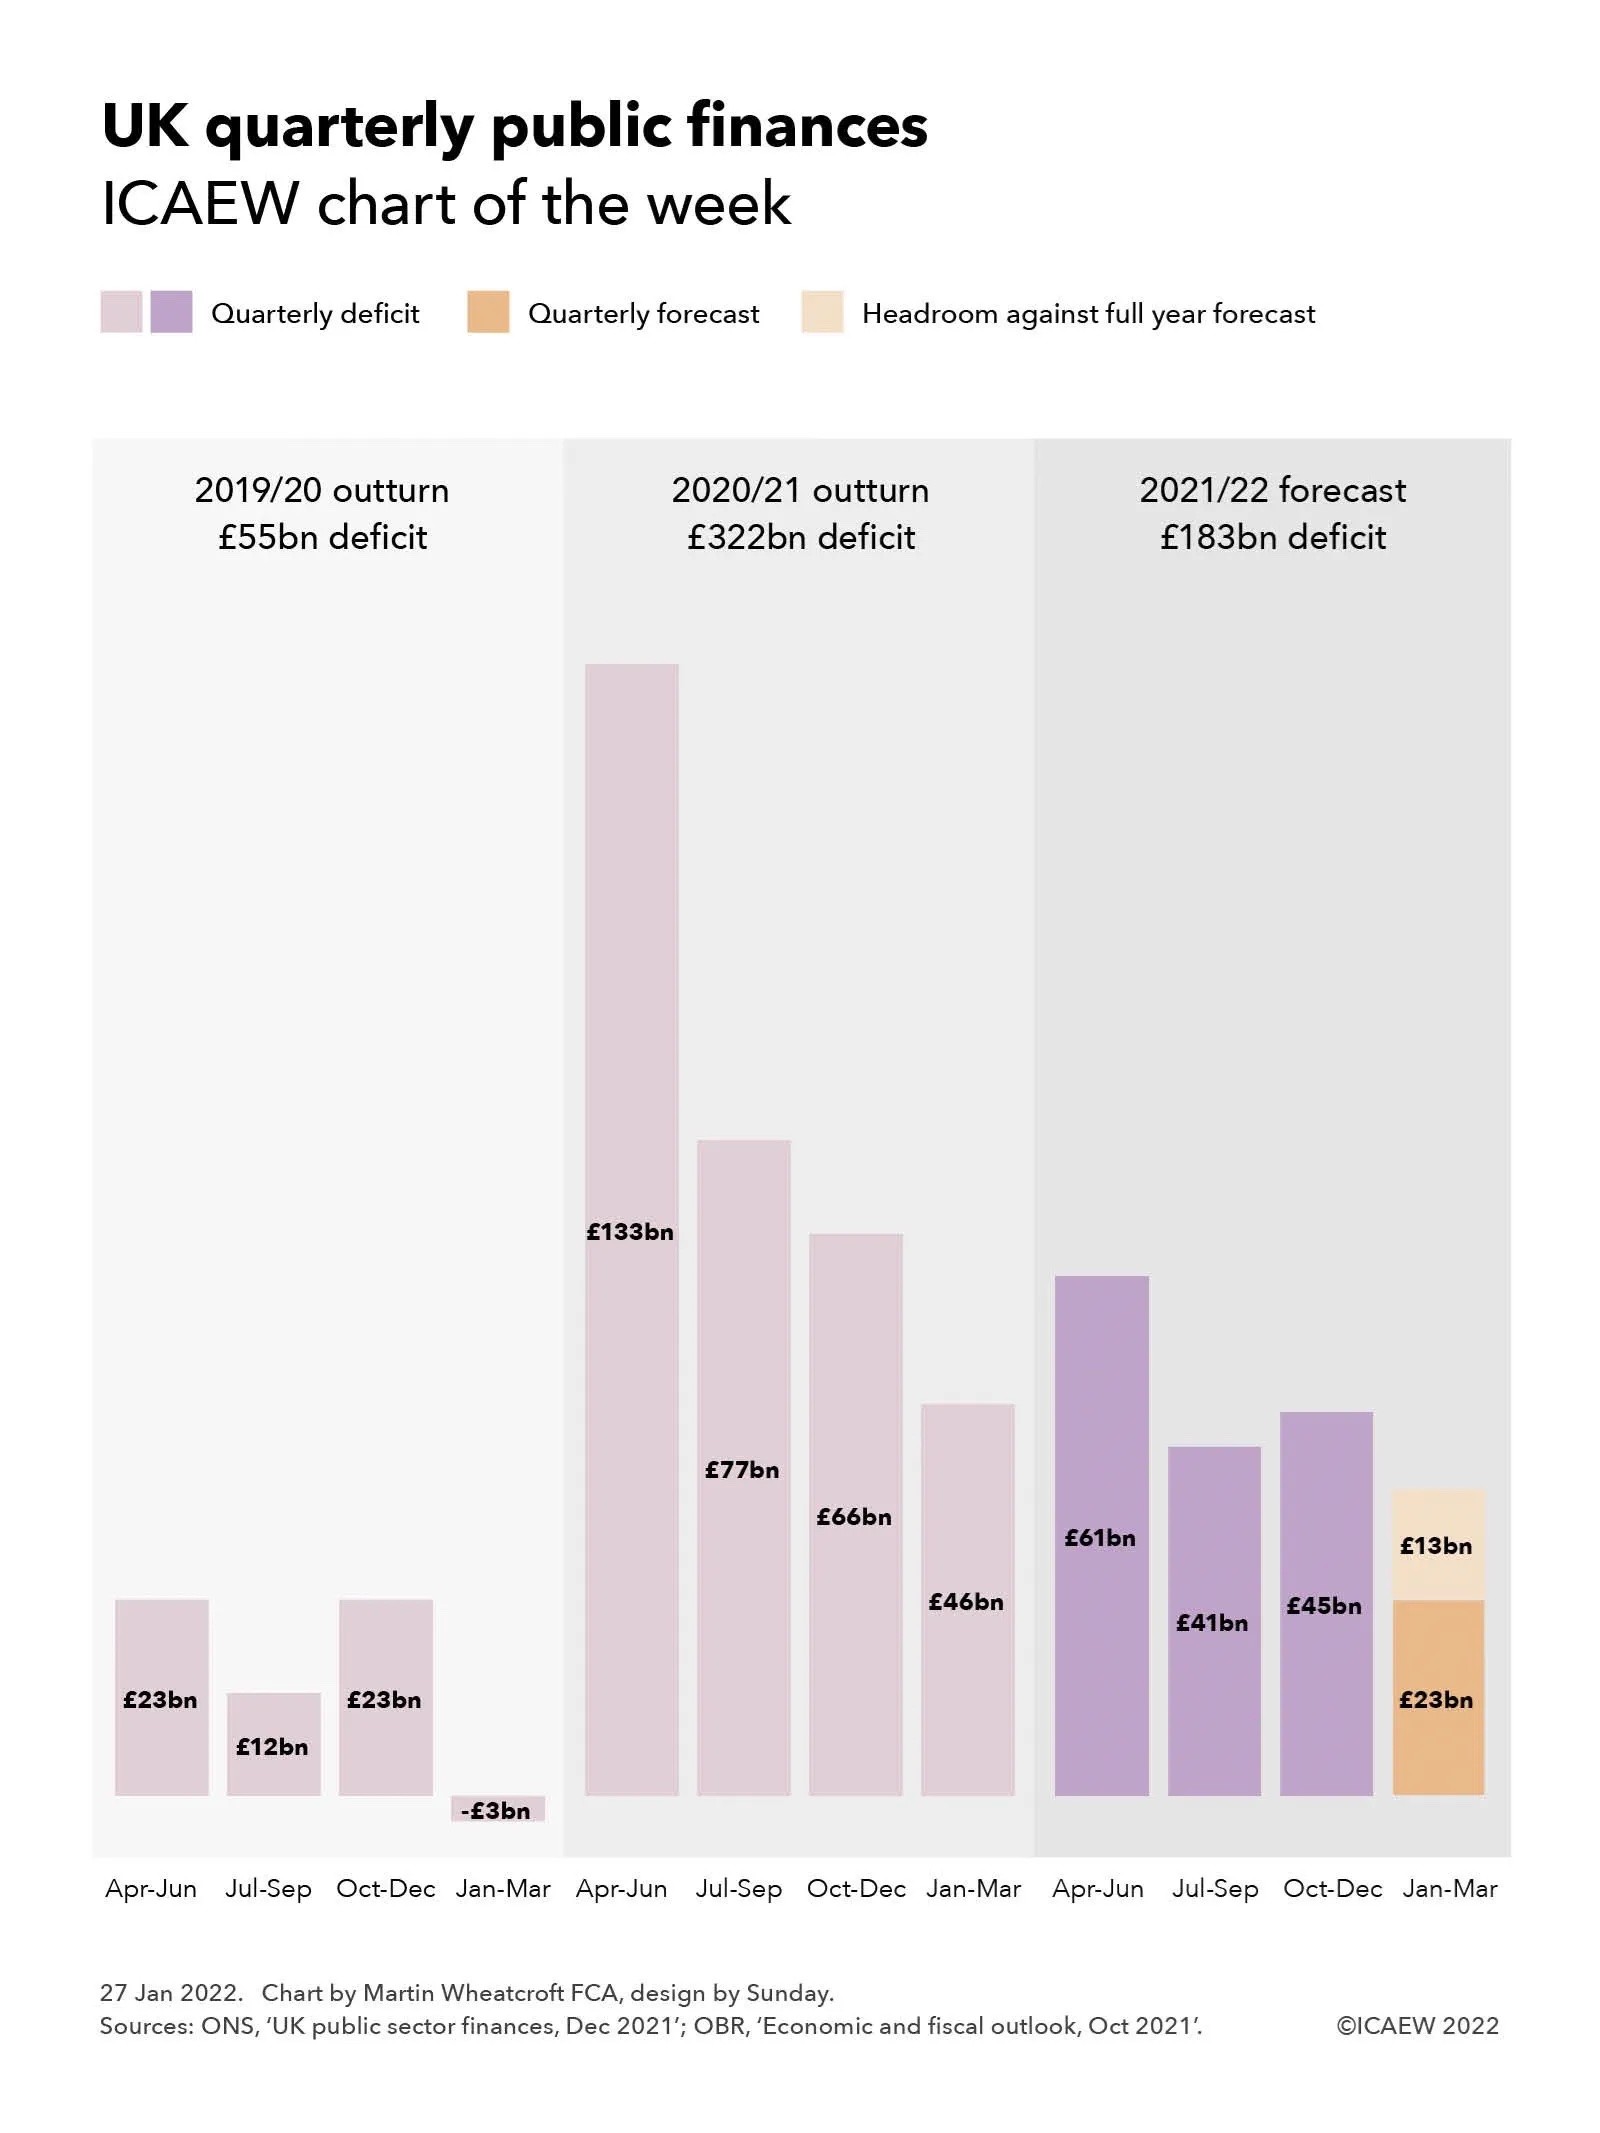
Our chart this week looks at the fiscal forecast for the final quarter of the government’s financial year ending in March 2022.
The December 2021 public sector finances published by the Office for National Statistics (ONS) on Tuesday 25 January provided numbers for the first three quarters of the current financial year. As our chart this week illustrates, this leaves the final quarter still to go, with £13bn of headroom against the official forecast prepared by the Office for Budget Responsibility (OBR) at the time of the Autumn Budget and Spending Review 2021 back in October.
To put the current fiscal year into context, our chart shows how the deficit of £55bn in 2019/20 comprised quarterly deficits of £23bn for April to June 2019, £12bn for July to September 2019 and £23bn for October to December 2019 less a surplus of £3bn for January to March 2020. Although there was some impact from the pandemic on the last month of that financial year, it broadly provides an indication of a ‘normal’ pattern of deficits across the year, with the second quarter and more especially the fourth quarter benefiting from self assessment tax receipts – the latter despite typically higher levels of capital expenditure in the run up to the end of the financial year.
This was followed by the first full year of the pandemic and associated lockdowns which saw tax receipts fall significantly and expenditures rise dramatically, resulting in an unprecedented peacetime deficit of £322bn in 2020/21, comprising £133bn, £77bn, £66bn and £46bn for the four quarters respectively.
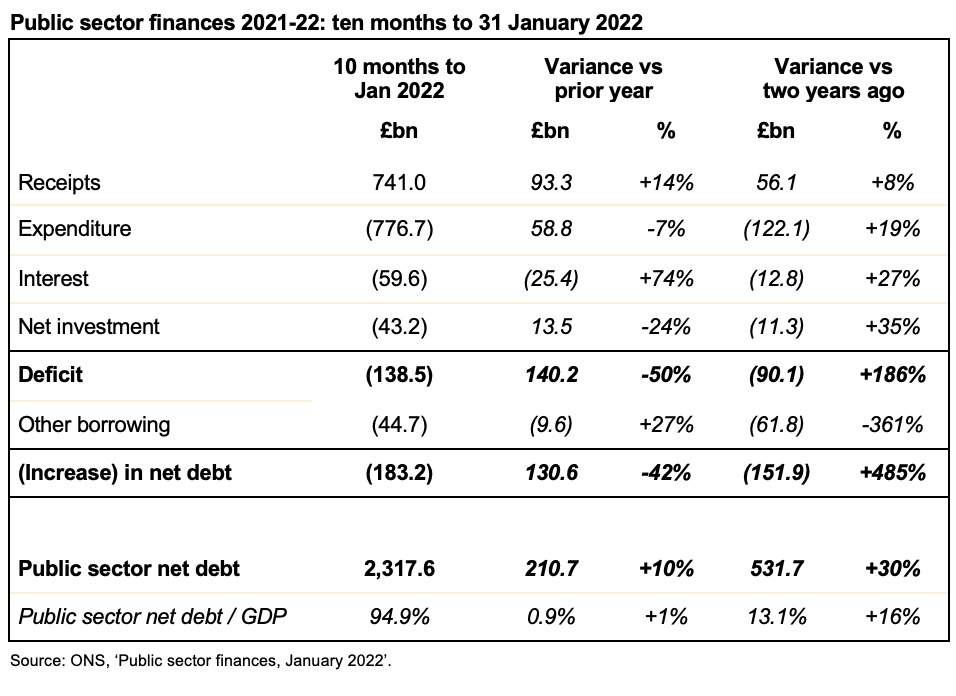
The current forecast is also on course for a pretty eye-watering deficit, which despite being substantially below that seen last year is forecast to be as much as £183bn. The provisional numbers for the first three quarters of 2021/22 of £61bn, £41bn and £45bn respectively are currently £13bn below the October forecast, implying an equivalent amount of headroom for the final quarter, assuming the OBR’s forecast deficit of £23bn for the fourth quarter proves to be accurate.
In practice, it would be surprising if the fourth quarter did come in on target other than by coincidence. Better than expected tax revenues are expected to continue to reduce the deficit over the final quarter but this is likely to be offset to a greater or lesser extent by higher interest costs on index-linked debt driven by rising inflation. There are also significant uncertainties around expenditures given the continuation of pandemic restrictions into January and the potential for further interventions to support businesses and individuals struggling financially as a consequence.
There have been suggestions that this headroom of £13bn is a ‘windfall’ that the Chancellor should use to support households expected to be hit by a greater than 50% rise in energy prices from April 2022 as discussed in last week’s chart of the week.
However, this perspective has also been contradicted by Carl Emmerson, Deputy Director at the Institute for Fiscal Studies (IFS), who is reported to have commented: “While borrowing last month was in line with the Budget forecast, over the first nine months of 2021/22 it is now £13bn below that forecast for the same period in the October Budget – £147bn instead of the £160bn expected in October. The latest improvement to borrowing over this period has been driven by higher-than-expected corporation tax being paid by some very large companies.
“Some have suggested better borrowing figures provide the Chancellor room to act on the cost of living by, for example, delaying the rise in National Insurance contributions planned for April. The truth is these figures make no difference to that calculation. Mr Sunak certainly could find money to delay tax rises or find other one-off ways of supporting living standards such as uprating benefits in April with a more up-to-date measure of inflation. But the long-run pressures on public services, especially health and social care, remain just the same and tax rises are likely to be needed if these are to be met. If he acts now on the cost of living, Mr Sunak will also need to find a credible means of committing to taking tough action on the public finances in the not too distant future.”
Even if the deficit does come in below the official forecast of £183bn, it will still be at a much higher level than that expected before the pandemic, when the forecast deficits for 2019/20, 2020/21 and 2021/22 were £47bn, £55bn and £67bn respectively compared with the much larger numbers reported in our chart. A variance of £13bn is also relatively small in the context of the £547bn increase in public sector net debt between March 2020 and December 2021.
All this suggests that the next fiscal event scheduled for 23 March 2022 is likely to take on even more importance as the Chancellor seeks to navigate between the rock of fiscal responsibility and a hard place of a cost of living crisis.
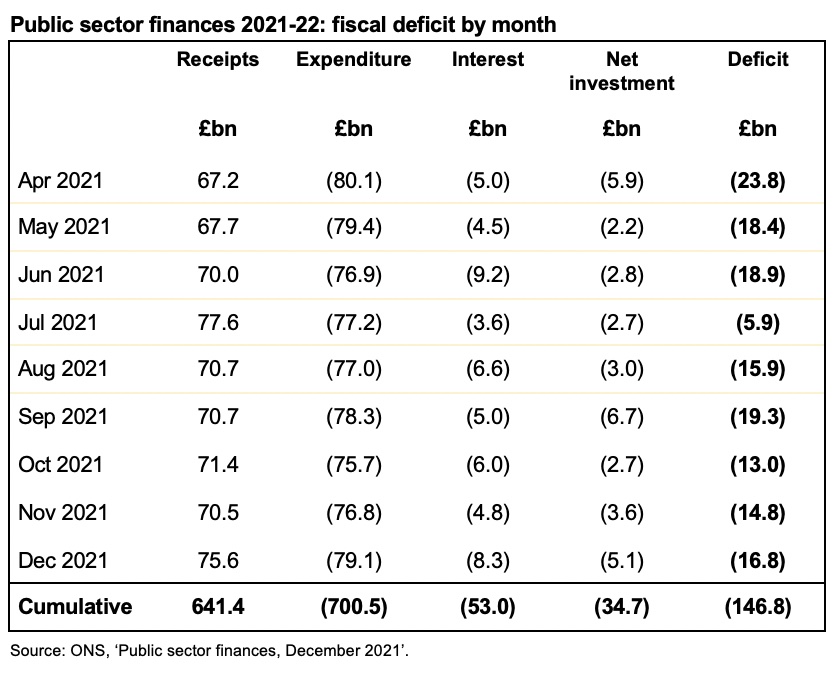
December’s deficit of £16.8bn saw both a rise in tax revenues and in interest on inflation-linked debt as pressure grows on the Chancellor to address energy price hikes and rising prices in the shops. The public sector finances for December 2021 released on Tuesday 25 January 2022 reported a monthly deficit of £16.8bn. This was £7.6bn lower than the £24.4bn reported for December 2020 but £11bn higher than the £5.8bn deficit reported for December 2019.
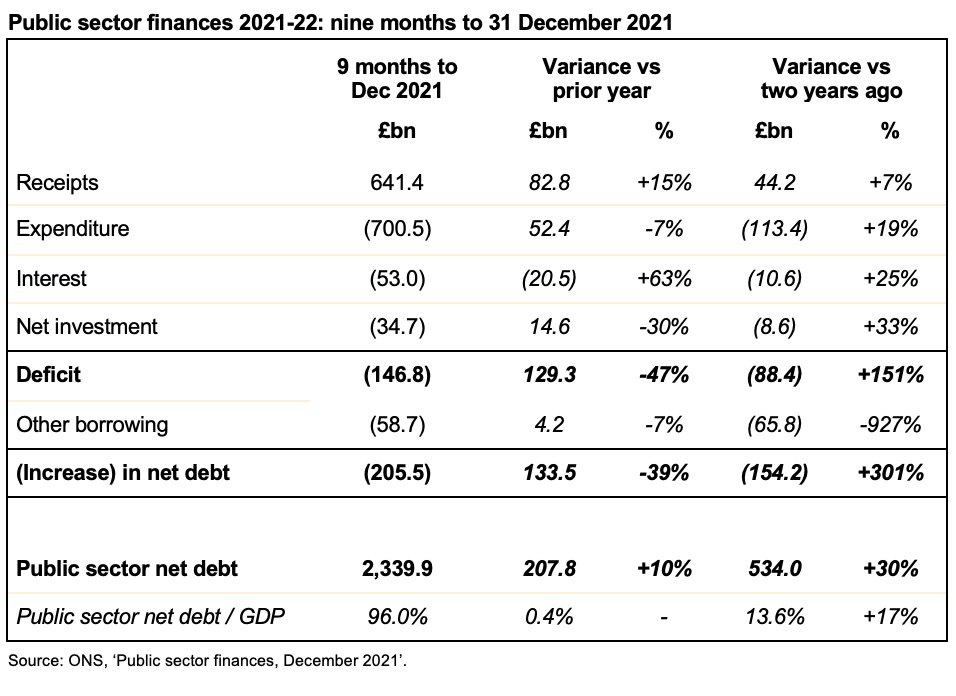
This brings the cumulative deficit for the first nine months of the financial year to £146.8bn compared with £276.1bn and £58.4bn for the same period last year and the year before that respectively.
Public sector net debt increased from £2,321.8bn at the end of November to £2,339.9bn or 96% of GDP at the end of December. This is £205.5bn higher than at the start of the financial year and an increase of £546.8bn from March 2020. As a proportion of GDP, debt is the highest it has been since March 1963, almost 60 years ago.
The deficit for the month was in line with the revised forecast for 2021/22, published by the Office for Budget Responsibility (OBR) alongside last October’s Autumn Budget and Spending Review 2021, although higher than forecast interest charges on index-linked debt offset the benefit of higher than forecast tax revenues.
Cumulative receipts in the first three quarters of the 2021/22 financial year amounted to £641.4bn, £82.8bn or 15% higher than a year previously, but only £44.2bn or 7% above the level seen in the first three quarters of 2019/20. At the same time, cumulative expenditure excluding interest of £700.5bn was £52.4bn or 7% lower than the first nine months of 2020/21, but £113.4bn or 19% higher than the same period two years ago.
Interest amounted to £53bn in the nine months to December 2021, £20.5bn or 63% higher than the same period in 2020/21, principally because of the effect of higher inflation on index-linked gilts. Interest costs were £10.6bn or 25% more than in the equivalent nine months ended 31 December 2019.
Cumulative net public sector investment in the three quarters to December 2021 was £34.7bn. This was £14.6bn or 30% less than the £49.3bn reported for the first nine months of last year, which included around £17bn of COVID-19-related lending that the government does not expect to recover. Investment was £8.6bn or 33% more than two years ago, principally reflecting greater capital expenditures, including on HS2.
The increase in debt of £205.5bn since the start of the financial year comprises the deficit of £146.8bn and £58.7bn in other borrowing. The latter was used to fund lending to banks through the Bank of England’s Term Funding Scheme, lending to businesses overseen by the British Business Bank (including bounce-back and other coronavirus loans), student loans, and other cash requirements, net of the receipt of taxes deferred last year and loan repayments.
Martin Wheatcroft FCA, external advisor on public finances to ICAEW, said: “Today’s numbers highlight the impact inflation is having on the public finances, with higher tax revenues collected in December offset by the rising cost of index-linked debt. We expect interest charges to increase further in the next few months as the time lag on index-linked debt catches up with the current 7.5% rate of RPI.
“With borrowing costs low and headroom in forecasts for the next financial year, the temptation will be to delay fixing the public finances in order to tackle the immediate hit to household budgets from anticipated energy prices hikes and higher prices in the shops, so pressure on the Chancellor to postpone or phase in April’s national insurance rise is likely to grow.”
Caution is needed with respect to the numbers published by the ONS, which are expected to be repeatedly revised as estimates are refined and gaps in the underlying data are filled.
The ONS made a number of revisions to prior month and prior year fiscal numbers to reflect revisions to estimates. These had the effect of decreasing the reported fiscal deficit for the eight months to November 2021 from £136bn to £130bn and the deficit for the year ended 31 March 2021 from £321.9bn to £321.8bn.
While November’s deficit of £17.4bn is in line with expectations, public sector net debt is up by more than half a trillion pounds since the start of the pandemic and as a proportion of GDP, debt is the highest it has been since March 1963.
The public sector finances for November 2021 released on Tuesday 21 December reported a monthly deficit of £17.4bn – £4.8bn lower than the £22.2bn reported for November 2020 but £11.8bn higher than the £5.6bn deficit reported for November 2019.
This brings the cumulative deficit for the first eight months of the financial year to £136.0bn compared with £251.7bn and £52.5bn for the same period last year and the year before that respectively.
Public sector net debt increased from £2,283.0bn at the end of October to £2,317.7bn or 96.1% of GDP at the end of November. This is £183.3bn higher than at the start of the financial year and an increase of £524.6bn over March 2020. As a proportion of GDP, debt is the highest it has been since March 1963, almost 60 years ago.
The increase in public sector net debt of £34.7bn in the month reflects borrowing to finance the deficit of £17.4bn and £26.9bn in the final tranche of the Bank of England’s Term Funding Scheme, offset by repayments in coronavirus lending as well as other net movements.
As in previous months this financial year, the deficit came in below the forecast for 2021-22 prepared by the Office for Budget Responsibility (OBR) in March 2021 but was in line with the OBR’s revised forecast issued in October 2021 alongside the Autumn Budget and Spending Review 2021.
Cumulative receipts in the first eight months of the 2021-22 financial year amounted to £560.7bn, £71.4bn or 15% higher than a year previously, but only £31.2bn or 6% above the level seen a year before that in 2019-20. At the same time cumulative expenditure excluding interest of £622.7bn was £44.4bn or 7% lower than the first eight months of 2020-21, but £102.1bn or 20% higher than the same period two years ago.
Interest amounted to £44.2bn in the eight months to October 2021, £14.6bn or 49% higher than the same period in 2020-21, principally because of higher inflation affecting index-linked gilts. Despite debt being 29% higher than two years ago, interest costs were only £5.0bn or 13% more than the equivalent eight months ended 30 November 2019.
Cumulative net public sector investment in the eight months to November 2021 was £29.8bn. This was £14.5bn less than the £44.3bn reported for the first eight months of last year, which included around £17bn or so of coronavirus lending that is not expected to be recovered. Investment was £7.6bn or 34% more than two years ago, principally reflecting a higher level of capital expenditure, in particular on investment in HS2.
Debt increased by £183.3bn since the start of the financial year, £47.3bn more than the deficit. This reflects funding to cover outflows on lending, including to banks through the Term Funding Scheme, lending to businesses through the British Business Bank, and student loans, offset by the receipt of taxes deferred last year and the repayment of coronavirus loans taken out during the pandemic.
Commenting on the figures Alison Ring, ICAEW Public Sector and Taxation Director, said: “While the numbers for November are in line with expectations, it’s notable that debt has risen both in cash terms and as a proportion of GDP, and at 96.1% is the highest it has been for almost 60 years. The monthly deficit of £17.4bn is below the peaks of last year but still substantially above the pre-pandemic position.
“Despite the rise in interest rates earlier this month, the Chancellor is still able to take advantage of historically-low borrowing costs if he wants to provide support to businesses adversely affected by the Omicron variant and prevent further scarring to the economy. His concern will be how to do so without stoking inflation, which is expected to head even higher over the next few months.”
Caution is needed with respect to the numbers published by the ONS, which are expected to be repeatedly revised as estimates are refined and gaps in the underlying data are filled.
The ONS made a number of revisions to prior month and prior year fiscal numbers to reflect revisions to estimates. These had the effect of decreasing the reported fiscal deficit for the seven months to October 2021 from £127.3bn to £118.6bn and the deficit for the year ended 31 March 2021 from £323.1bn to £321.9bn.
My chart this week is on Bounce Back Loans, one of the principal sources of financial support for businesses during the first year of the pandemic and the subject of a recent investigation by the National Audit Office.
The recent publication of the Department for Business, Energy & Industrial Strategy (BEIS) accounts for 2020-21 contained an assessment of the losses expected on the financial provided to businesses through the Bounce Back Loan Scheme (BBLS), the Coronavirus Business Interruption Loan Scheme (CBILS), the Coronavirus Large Business Interruption Loan Scheme (CLBILS) and the Future Fund. This was followed by an updated report from the National Audit Office (NAO) on the administration of the scheme and the potential losses to the taxpayers.
The largest of these schemes was BBLS, with Bounce Back Loans of up to £50,000 provided to eligible businesses to help them weather the first lockdown in the second quarter of 2020, before being extended to the whole of the 2020-21 financial year. In the end, around a quarter of businesses took out a Bounce Back Loan, comprising 1.5m loans for a total of £47bn at an interest rate of 2.5% repayable over six years. The interest in the first year was covered by the government, with no repayments due in that period.
Businesses can extend the loans to ten years through the Pay As Your Grow option, as well as being allowed up to one six month payment holiday and three interest-only payments to provide flexibility without going into default.
The seven main UK banks provided around 90% of the loans by value, with the rest provided by other banks and non-bank lenders, such as peer-to-peer lenders. Each participating financial institution was provided with a 100% guarantee by the government to cover any amounts not repaid. Half a million or nearly 35% of the loans were for the maximum amount of £50,000 (adding up to £27bn) with £18bn lent out between £10,000 and £50,000 and £2bn lent for amounts between £2,000 (the minimum possible) and £10,000.
As the chart illustrates, the geographical distribution of loans was weighted towards the south and centre of England, with £11bn borrowed by businesses in London, £10bn in the South (£6.5bn South East and £3.6bn South West) and £11bn in the Midlands & East (£3.8bn West Midlands, £2.9bn East Midlands and £4.5bn East of England), a total of £32bn. The balance of £15bn was split between £9bn in the North (£3.2bn Yorkshire & the Humber, £4.8bn North West and £1.3bn North East) and £6bn in the other nations of the UK (£2.7bn Scotland, £1.6bn Wales and £1.3bn Northern Ireland).
More than 90% of the loans, amounting to £40bn, went to micro-businesses, ie businesses with turnover below £632,000.
BEIS have estimated in their 2020-21 financial statements that they do not expect 37% of the loans with a value of £17bn to be repaid, comprising £12bn in estimated bad debts and £5bn in estimated losses from fraud, although the NAO says that these numbers are highly uncertain at this stage. With £2bn already repaid, this leaves £28bn believed to be recoverable over the remainder of the six years of the loans (or 10 years for those that are extended).
The fraud estimate, for 11% of the loans with a value of £4.9bn, was based on a sample of 1,067 loans as at 31 March 2021, but a subsequent analysis in October 2021 suggests that the level of fraud may be lower at around 7.5% of loans and so there is some hope that BEIS and the British Business Bank will be able to reduce the amount they will have to reimburse to participating banks under the 100% guarantees.
However, as the NAO reports, these guarantees mean participating banks have no financial incentive to chase repayment and it has raised concerns that insufficient resources are being dedicated by BEIS and the British Business Bank to recovering outstanding amounts.
The challenge for government is that many businesses have not been able to get back to their pre-pandemic level of operation and so there is a need to be sensitive, whilst at the same time seeking to protect public money and tackle those who made fraudulent claims.
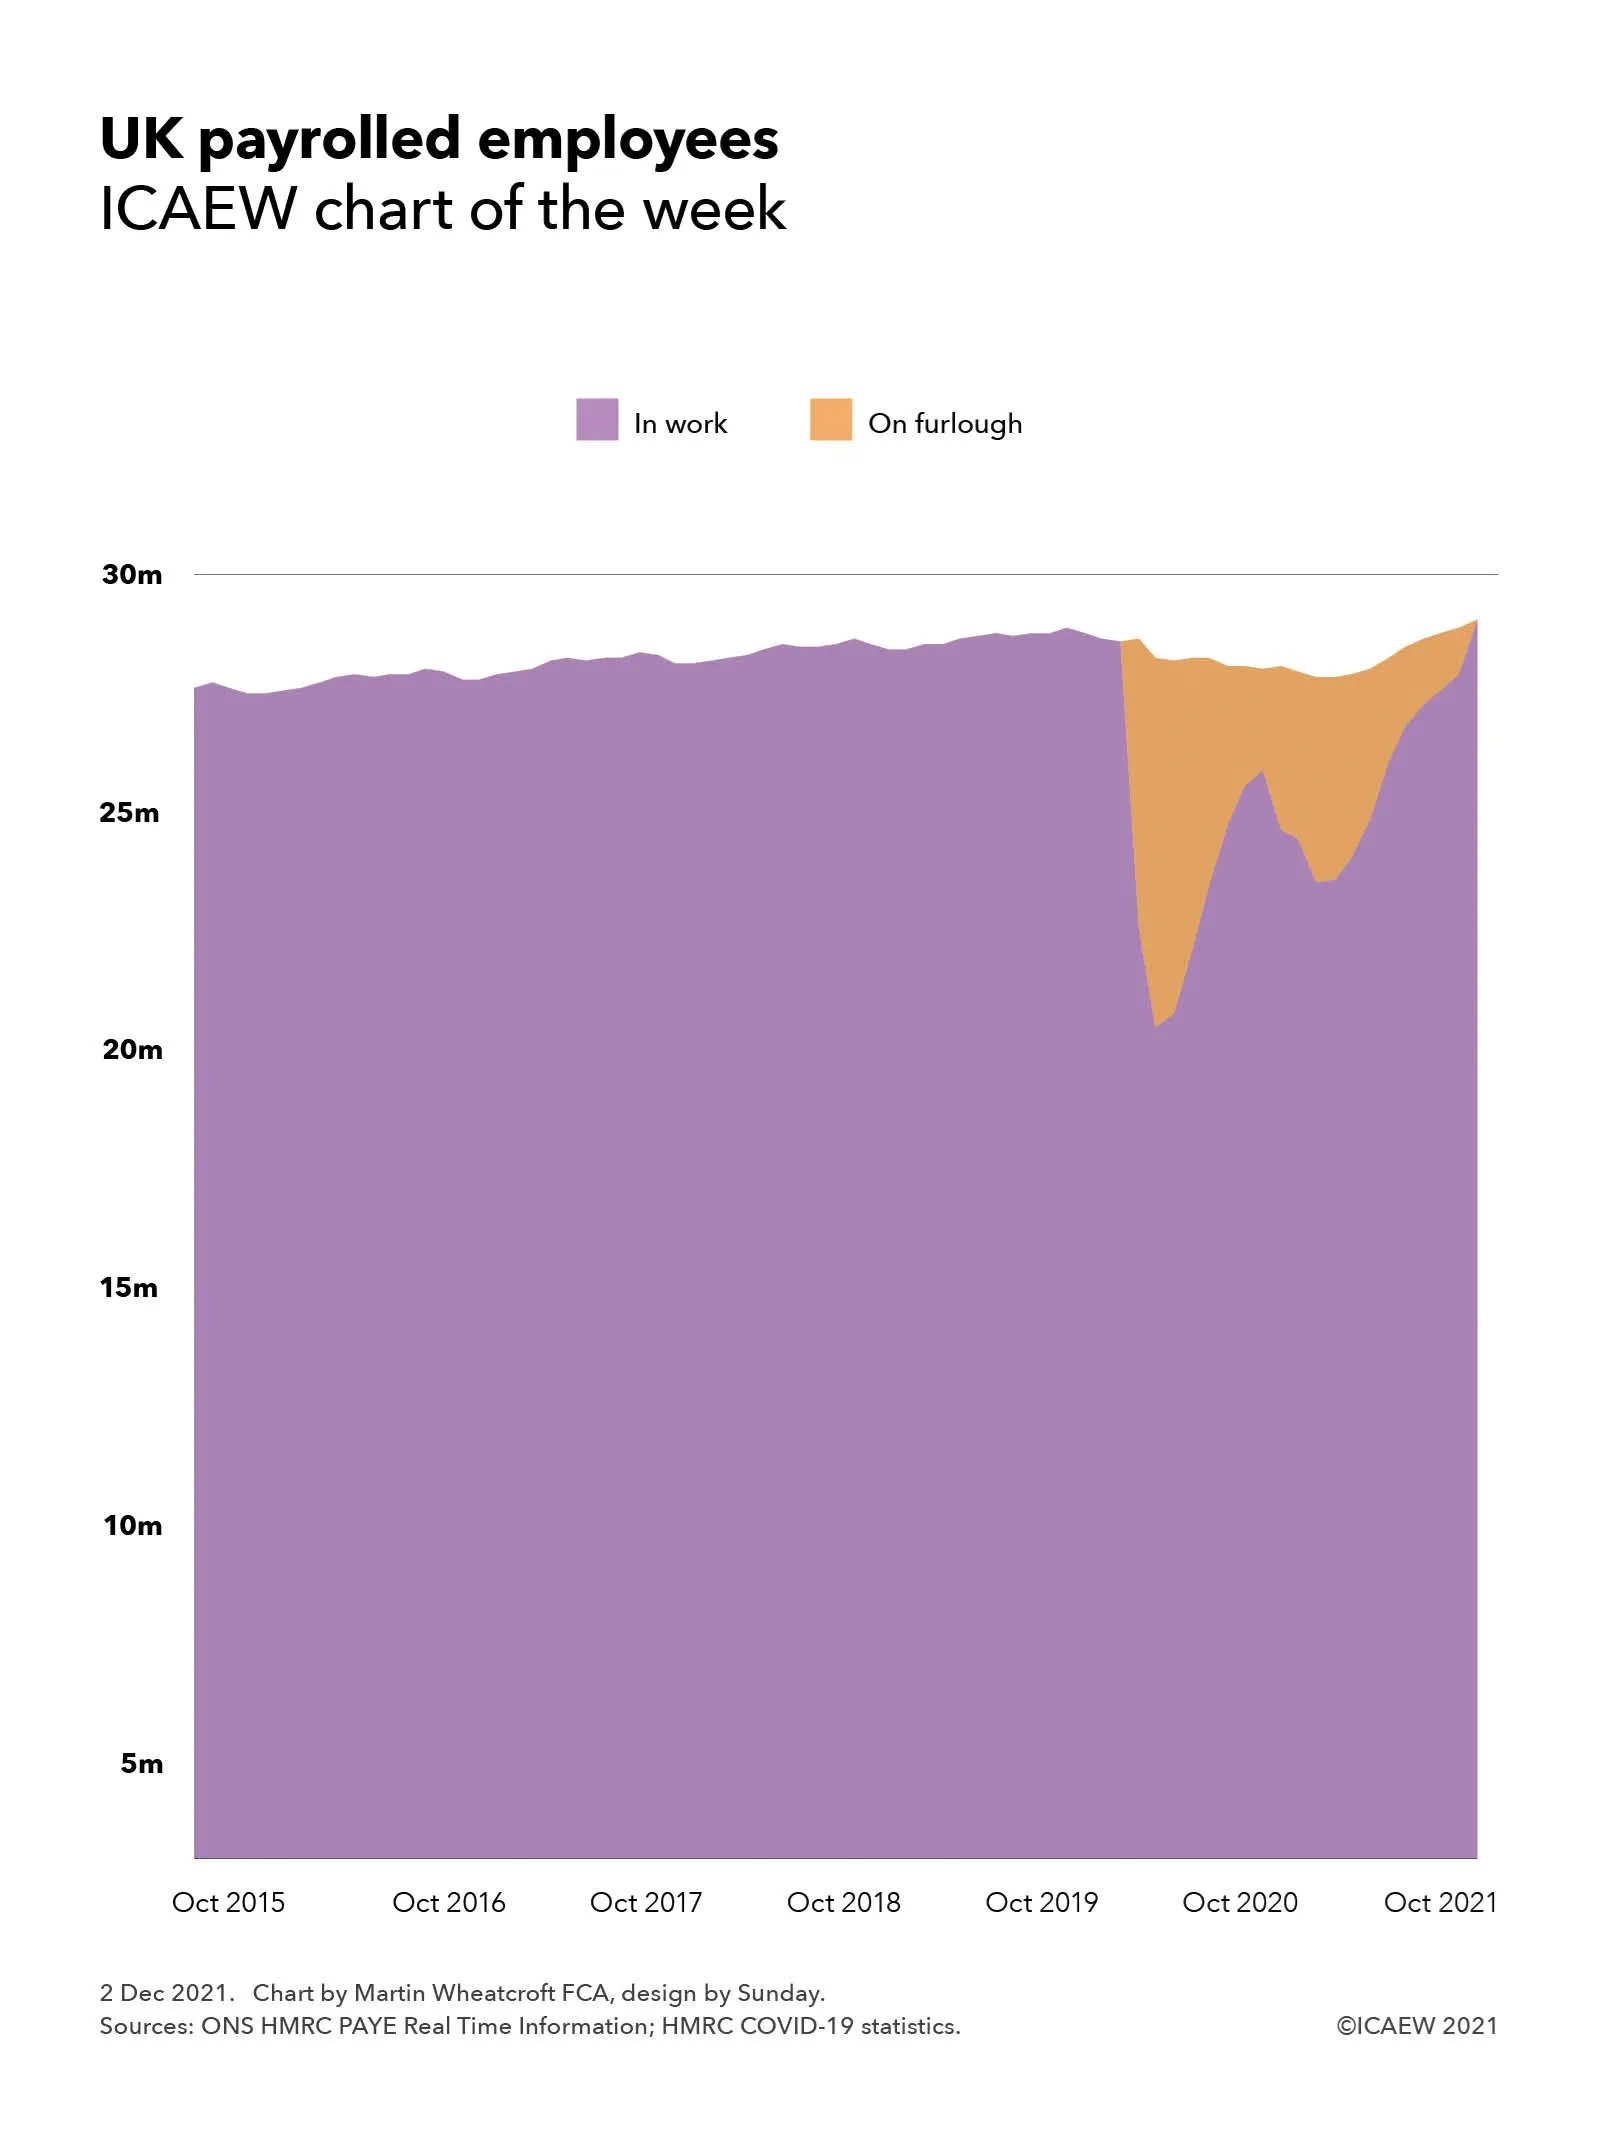
My chart this week looks at how the number of employees on UK payrolls has been supported by the furlough scheme, with more people employed in October 2021 than before the pandemic.
Concerns that the end of the furlough scheme in September 2021 would be followed by a sharp rise in unemployment proved to be unfounded, with the flash estimate of the number of people on UK payrolls increasing to 29.4m in October 2021, an increase of 166,000 from the previous month and greater than before the pandemic. This is positive news as it suggests that the majority of the 1.1m still on the furlough scheme when it ended on 30 September 2021 have been able to retain their jobs or have found work elsewhere.
The chart shows how payrolled employees increased gradually before the pandemic from 27.7m in October 2015 to 28.1m in October 2016, 28.5m in October 2017, 28.8m in October 2018 and 29.0m in October 2019, peaking in November 2019 at 29.1m. Numbers fell to 28.9m in February 2020 although on a seasonally adjusted basis the numbers increased slightly. Those in work fell significantly by the end of March 2020 to 22.0m when 6.8m were placed on furlough under the government’s Coronavirus Job Retention Scheme (CJRS) and to 19.7m at the end of April 2020 when 8.8m were on furlough.
Despite the furlough scheme overall payrolled numbers fell during the pandemic from 28.9m in March 2020 (including 6.8m on furlough) to 28.2m in October 2020 (when 2.4m were on furlough) to 28.0m at its lowest in January and February 2021 (when 4.9m and 4.7m were on furlough), before gradually rising to 29.2m in September 2021 (when 1.1m were on furlough) and 29.4m in October 2021 (when no one was on furlough).
Although the flash numbers for October 2021 are provisional and subject to change, they should be sufficiently reliable for policy makers to take some comfort that the furlough scheme has done its job in stabilising the economy and avoiding significant levels of unemployment. However, with the pandemic still not over, there will be concerns about whether growth in employment can be maintained over the coming months.
According to the ONS, the median monthly pay in October 2021 was £2,005, slightly down on the £2,010 reported for September 2021, but an increase of 4.9% compared with the £1,911 calculated for October 2020. The latter compares with consumer price inflation of 4.2% over the same period.
The idea that we might be emerging from the pandemic with higher levels of employment and wages than before it started might have seemed unlikely at the start of the first lockdown. But then at an estimated total cost of £370bn, of which £70bn was for the CJRS, the eye watering sums incurred by the government in getting to this position have been far from insubstantial.
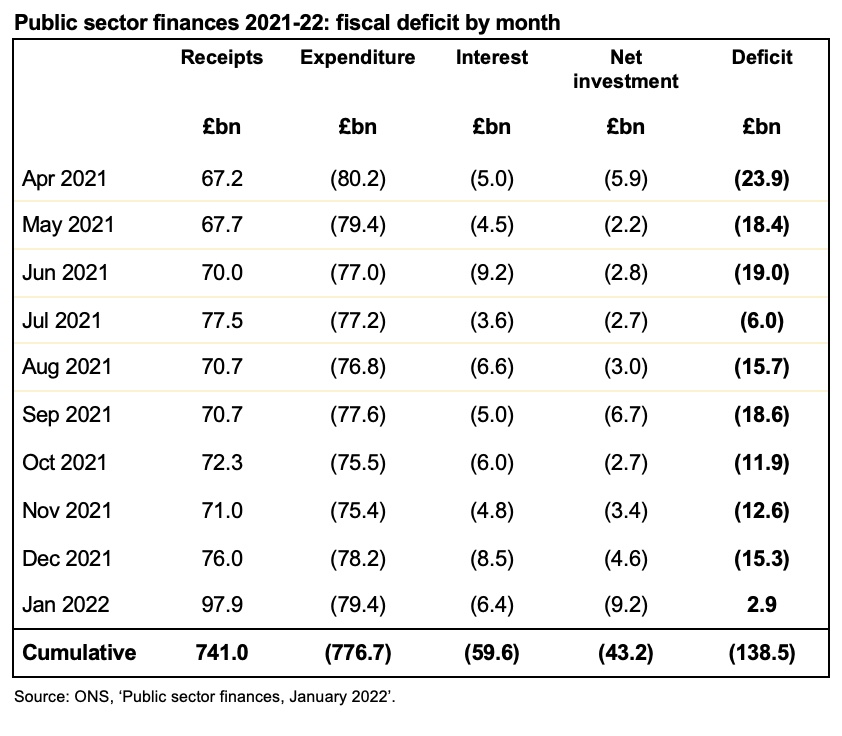
The monthly public sector deficit was flat at £18.8bn in October but a last-minute rush by banks to access cheap finance caused public sector net debt to jump by £68.7bn to £2,277.6bn.
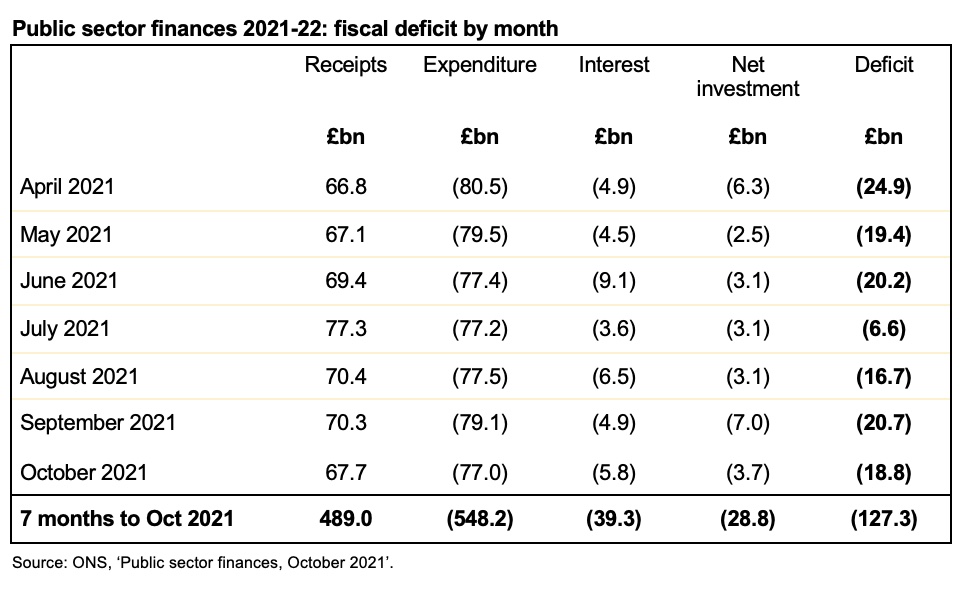
The public sector finances for October 2021 released on Friday 18 November reported a monthly deficit of £18.8bn, slightly better than the £19.0bn reported for October 2020 but higher than the £11.6bn deficit in October 2019.
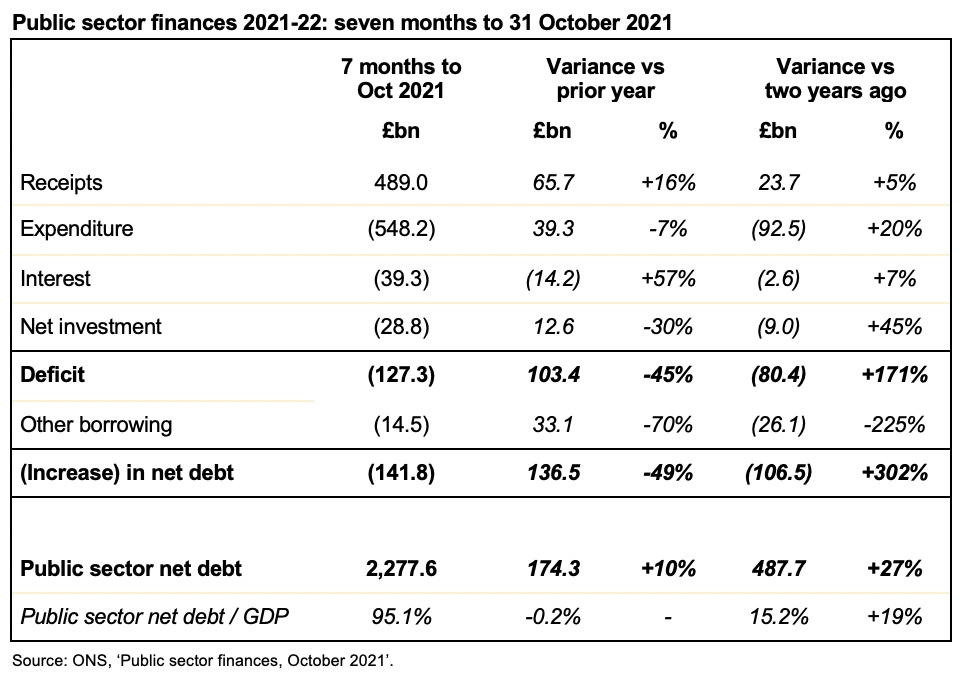
This brings the cumulative deficit for the first seven months of the financial year to £127.3bn compared with £230.7bn last year and £46.9bn for the equivalent period two years ago.
Public sector net debt increased from £2,208.9bn at the end of September to £2,277.6bn or 95.1% of GDP at the end of October. This is £141.8bn higher than at the start of the financial year and an increase of £484.5bn over March 2020.
The increase in public sector net debt of £68.7bn in the month includes £57.3bn to funding lending to banks who rushed to borrow under the ‘Term Funding Scheme with additional incentives for SMEs’ (TFSME) before the extended drawdown period ended on 31 October 2021. A further £26.9bn will be recorded in November for cash movements after the cut-off date, bringing the total amount financed through the TFSME to £193.4bn on 10 November 2021.
As in previous months this financial year, the deficit came in below the forecast for 2021-22 prepared by the Office for Budget Responsibility (OBR) in March 2021 but was in line with the OBR’s revised forecast issued in October 2021 alongside the Autumn Budget and Spending Review 2021.
Cumulative receipts in the first seven months of the 2021-22 financial year amounted to £489.0bn, £65.7bn or 16% higher than a year previously, but only £23.7bn or 5% above the level seen a year before that in 2019-20. At the same time cumulative expenditure excluding interest of £548.2bn was £39.3bn or 7% lower than the first seven months of 2020-21, but £92.5bn or 20% higher than the same period two years ago.
Interest amounted to £39.3bn in the seven months to October 2021, £14.2bn or 57% higher than the same period in 2020-21, principally because of higher inflation affecting index-linked gilts. Despite debt being 24% higher than two years ago, interest costs were only £2.6bn or 7% more than the equivalent seven months ended 31 October 2019.
Cumulative net public sector investment in the seven months to October 2021 was £28.8bn. This was £12.6bn less than the £41.4bn in the first seven months of last year, which included around £17bn on coronavirus lending that is not expected to be recovered. Investment was £9.0bn or 45% more than two years ago, principally reflecting a higher level of capital expenditure.
Debt increased by £141.8bn since the start of the financial year, £14.5bn more than the deficit. This reflects funding to cover outflows on lending to business, including to banks through the Term Funding Scheme, and student loans offset by the receipt of taxes deferred last year and the repayment of coronavirus loans taken out during the course of the pandemic.
Alison Ring, ICAEW Public Sector Director, said: “Today’s public finance numbers show a deficit of £18.8bn in October, which is in line with the revised forecasts published by the Office for Budget Responsibility last month. The deficit has stopped growing now that the furlough and other pandemic support schemes have finished.
“However, a last-minute rush by banks to obtain cheap loans for small and medium enterprises, before the application deadline on 31 October, caused government debt to jump by £68.7bn last month. These loans should help businesses navigate choppy economic waters with rapidly rising inflation, as well as supply chain and staffing challenges. Nonetheless, the Chancellor will need to continue watching events closely to see if he will need to reintroduce any pandemic support schemes.”
Caution is needed with respect to the numbers published by the ONS, which are expected to be repeatedly revised as estimates are refined and gaps in the underlying data are filled.
The ONS made a number of revisions to prior month and prior year fiscal numbers to reflect revisions to estimates. These had the effect of increasing the reported fiscal deficit for the six months to September 2021 from £108.1bn to £108.5bn and the deficit for the year ended 31 March 2021 from £319.9bn to £323.1bn.
Chancellor of the Exchequer Rishi Sunak found some extra money to supplement the Spending Review 2021, turning a very tough settlement for government departments into a moderately tough one.
The Chancellor had already announced an increase in the health budget from the proceeds of the health and social care levy, but as highlighted by our chart last week, this implied a very tough budget settlement for most other departments, including cuts for some. Instead, Rishi Sunak was able to use some of the upward revisions in the economic forecasts from the Office for Budget Responsibility to add to departmental resource budgets, ensuring that each department receives a real term spending increase in their combined resource and capital budgets even with higher levels of inflation in the coming year.
However, there was a sting in the tail, as supplementary COVID-19 funding ceases at the end of this financial year, leaving departments to absorb further COVID-related expenditure within their budgets from next April onwards. This will include catching up on backlogs built up during the pandemic in addition to any incremental costs that may continue into the Spending Review period.
The chart starts by highlighting how departmental resource and capital budgets of £346bn and £70bn in 2019-20, increased to £355bn and £88bn in 2020-21 and to £385bn and £99bn in the current year. This is before £127bn in COVID-19 supplementary budgets last year and £70bn this year.
The Spending Review period itself covers the three financial years 2022-23, 2023-24 and 2024-25, with the combination of funding from the health and social care levy and the Spending Review seeing departmental resource budgets increase to £435bn, £443bn and £454bn respectively. This is more than the spending envelope originally set out by the Chancellor last month.
Capital investment budgets remained broadly unchanged at £107bn, £111bn and £112bn respectively, continuing the significant jump from the £70bn invested in 2019-20 in the coming financial year before flattening out in the following two years.
Over the three years, the resource budget settlement implies annualised average real terms growth in the health & social care budget of 4.1% and in the education budget of 2.2%, while the defence budget is broadly frozen in cash terms and cut by 1.4% in real terms. This assumes average inflation over the three years of 2.2%, with higher inflation in the coming financial year offset by much lower rates in the following two years.
Other departments are expected to grow by 3.1% on average over the period, with central funding for local government up 9.4%, transport up 6.8%, work & pensions up 4.6% and justice up 4.1%, each receiving larger relative settlements than other departments. International trade (+0.1%), HM Treasury (+0.9%), levelling up, housing & communities (+1.1%), HMRC (+1.2%), the Cabinet Office (+1.4%), business, energy & industrial strategy (+1.4%), and intelligence (+1.7%) are the departments receiving increases below 2% a year on average.
2021-22 £bn
2022-23 £bn
2023-24 £bn
2023-24 £bn
Average real-terms growth
Education
147.1
167.9
173.4
177.4
+4.1%
Defence
70.7
77.0
79.0
80.6
+2.2%
Transport
31.5
32.4
32.2
32.2
-1.4%
Large departments
249.3
277.3
284.6
290.2
+2.9%
Other departments
70.7
83.9
82.7
82.7
+3.1%
Devolved administrations
56.8
63.0
64.3
65.3
+2.5%
ODA to 0.7% of GDP
–
–
–
5.2
Reserves
8.1
11.0
10.9
10.3
Total excluding covid-19
384.9
435.2
442.5
453.7
+3.3%
HM Treasury, ‘Autumn Budget and Spending Review 2021’
The above growth rates exclude capital budgets, expected to increase in real terms by 1.9% a year on average over the three years of the Spending Review. Departments benefiting from higher capital budgets include small and independent bodies (+16.8%), FCDO (+16.0%), digital, culture, media & sport (+11.8%), and intelligence (+9.1%), albeit mostly from relatively small bases in each case. The 3.8% average real terms increase in health & social care capital investment is much less proportionately, but much larger in cash terms.
Perhaps just as important as the monetary amounts provided to departments as the Chancellor opened his proverbial cheque book, is the certainty that a three-year budgetary settlement provides. This will help departments plan ahead with confidence and hopefully help them obtain better value for the money they spend on our behalf.
The Chancellor used tax rises to start repairing the public finances but spending pressures could derail his hopes for a pre-election tax giveaway in 2023 or 2024. Wednesday’s Autumn Budget and Spending Review saw total public spending settle permanently above a trillion pounds a year, as additional spending increases more than offset the end of temporary COVID-19 interventions.
A ‘Boris Budget’ – full of fizz and capital spending announcements
Despite Rishi Sunak’s avowed commitment to a small state and low taxes, the Autumn Budget reality featured both higher taxes and higher spending, and the Spending Review focused on addressing the many pressures bearing down on public services.
The Chancellor benefited from a faster rebound in the economy due to the vaccination programme, as well as being helped by the time lag between inflation benefiting the revenue line and when it starts to feed through into public spending. Combined with the health and social care levy and other tax rises, this provided him with the budgetary capacity to increase spending on health, reverse previously announced cuts in departmental spending, and still reduce borrowing.
This led the Resolution Foundation to label this a ‘Boris Budget’, reflecting the reputedly more generous instincts of Prime Minister Boris Johnson as compared with his Chancellor.
The Office for Budget Responsibility (OBR)’s high-level analysis was that the Chancellor used around half the £50bn net benefit from forecast revisions and tax rises in 2022-23 to increase spending, with the balance reducing the deficit from £107bn to £83bn. However, the Institute for Fiscal Studies (IFS) points out that, apart from health and social care, the additional spending mostly reversed planned cuts made during the November 2020 and March 2021 Budgets that were always going to be difficult to achieve in practice.
The good news from better economic forecasts, including the OBR’s revision of its estimate of the permanent scarring effect on the economy from 3% to 2%, was offset by concerns over the impact of inflation on living standards and the impact of the ending of the temporary uplift in universal credit on those on low incomes.
Higher inflation will also put public sector budgets under pressure as higher wage settlements and supplier costs start to eat into the spending increases awarded as part of the Spending Review. Clearing backlogs built up over the course of the pandemic will absorb further amounts, while there is also a risk that construction worker shortages and rising construction costs will make it difficult to deliver on the capital programmes announced in such a flurry over the weekend before the Budget announcement.
Unemployment – the dog that didn’t bark
One of the key reasons for the better economic situation than was expected at the start of the pandemic is that unemployment has not gone up significantly. The contribution of the furlough schemes and business support has been hugely significant to this outcome, not only by supporting workers and businesses during successive lockdowns but more importantly preserving businesses and the jobs for workers to return to as pandemic restrictions have been lifted.
Unemployment may still increase following the ending of the furlough schemes in September, but any increase is likely to be significantly smaller than the potential more than doubling in unemployment rates that some had anticipated at the start of the first lockdown.
Modest tax reforms overshadowed by higher tax rates, fiscal drag and a major ‘tax’ cut
Perhaps the most radical ‘tax’ change announced in the Autumn Budget was not a formal tax at all. The reduction in the universal credit taper rate from 63% to 55% is in effect a significant tax cut on those on the lowest incomes, even if it still leaves poorer households on higher effective marginal rates than those earning over £150,000 a year. It also does not make up for the removal of the temporary £20 a week boost to universal credit that has already started to hit many of the poorest households this month.
Higher inflation benefits the public finances by increasing fiscal drag as tax allowances reduce in value in real terms, bringing more people into the scope of income tax or onto higher tax bands. This is a hidden tax increase that brings in more for the government without it needing to increase headline rates.
Of course, the government did that as well. The headline rates of employee national insurance, employer national insurance and dividend tax were increased by 1.25% in the coming year, even if in subsequent years the health and social care levy will appear on payslips and PAYE statements as a separate tax in its own right.
Modest reforms to business rates (principally more frequent revaluations), alcohol duties, and air passenger duties were relatively light touch compared with the previously announced health and social care levy and the planned 6% increase in the main corporation tax rate, even if banks saw a reduction of 5% in the bank levy on corporate profits to offset some of that increase.
More money for health and the criminal justice system, but less for the armed forces
The Spending Review saw extra money for health (funded by the new health and social care levy) where demographic pressures continue to drive demand in addition to dealing with the costs of the pandemic and the backlog of treatments that have built up.
The criminal justice system also received a substantial settlement (4.1% on average over three years), but this will not be sufficient to restore spending to the level before austerity. Indeed, the IFS has calculated that with the exception of the Department for Health & Social Care, the Home Office and the Department for Education, all other departments will continue to spend less in real terms than they did in 2009-10.
One surprise in the detail was the flat current spending settlement for the Ministry of Defence over the coming three years, implying a further cut in spending in real terms on the armed forces, which are expected to contract even further than they have done already. While equipment spending is up as part of a ‘more drones, fewer soldiers’ policy, this is one area where additional settlements in the next couple of Budgets appear more likely than not.
Higher levels of capital investment targeted at boosting regional economic growth
A big credit to the Chancellor is that despite the many challenges facing the public finances following the pandemic he has not scaled back the government’s capital investment programme. While it is the case that his two immediate predecessors pencilled in the substantial increases that we are now seeing, it is the current Chancellor who is delivering on them. There are significant boosts in investment in economic infrastructure, housing, research & development and digitising government amongst other areas.
Open questions remain in areas such as transport, where the long-awaited Integrated Rail Plan was not published with the Spending Review as expected. However, the £7bn pre-announced for regional rail upgrades demonstrates how much can be done with a bigger pot of money for investment.
The step-change in the level in capital budgets – from £70bn in 2019-20 to £107bn in 2022-23 is remarkable. The one concern will be whether the relatively flat capital budget allocations in subsequent years will mean investment starts to fall in real terms again, possibly ‘pulling the plug’ on the economic benefits of investment just as the economy recovers from the pandemic.
New fiscal rules: a cautious approach to repairing the public finances
The Chancellor announced two new fiscal rules: a current budget balance target and a declining debt to GDP ratio; although they were accompanied by subsidiary rules, including a 3% of GDP cap on investment spending and a commitment to return overseas development assistance to 0.7% of GDP once budget balance is achieved.
In effect, they provide a fiscally conservative framework of generating sufficient tax revenues to cover day-to-day spending, while allowing a certain amount of borrowing for investment. While debt should still grow – and is expected to reach over £2.5tn during the forecast period, the debt to GDP ratio should start to fall as the economy grows over time.
These changes confirm that George Osborne’s ambition to eliminate the fiscal deficit completely has been abandoned, replaced by a Gordon Brown-style current budget balance target. This is calculated under the statistics-based National Accounts fiscal framework, which for example excludes the long-term cost of public sector pensions; the government is still planning to continue to lose money on an accounting basis under IFRS.
The forward-looking current-budget balance accompanies the Chancellor’s other principal fiscal rule with is to reduce the ratio of public sector net debt to GDP, although again this uses a target based on fiscal measures that do not include other liabilities in the public sector balance sheet.
Even there, the Chancellor adopted a non-GASP (non-Generally Accepted Statistical Practice) measure to target (public sector net debt excluding the Bank of England) that excludes some central bank liabilities, which rather strangely means that money used to finance premiums paid to private investors for gilts purchased by the Bank of England is excluded from the formal fiscal targets.
Irrespective of the precise KPIs used in the fiscal rules, the overall approach is one of repairing the public finances gradually over time. Higher rates of economic growth would enable that to be accelerated, but the government has as yet been unable to identify how to get back onto the pre-financial crisis levels of productivity improvements that would be required to make this possible. In the meantime, the fiscal rules provide a framework in which tax rises to fund public spending are more likely, in particular to fund increases in the health, social care and the state pension costs driven by more people living longer.
There are many risks to the Chancellor keeping to his fiscal rules over the forecast period, especially as there is relatively little headroom within the current forecasts according to the OBR and the IFS. There are also risks from recessions over a longer period.
A weaker but more transparent public balance sheet
The pandemic has seen the liability side of the public balance sheet rise significantly, with £2.2tn rising to £2.5tn in debt adding to similar amounts of liabilities for public sector pensions and other obligations including nuclear decommissioning and clinical negligence.
Higher gearing in a balance sheet already in negative territory increases the exposure of the public finances to changes in interest rates and inflation, providing a higher risk profile for the public finances. For example, the OBR has estimated that a 1% increase in interest rates would add £25bn to interest costs each year – approaching more than twice the amount raised by the health and social care levy.
One positive aspect of the Autumn Budget and Spending Review announcement was a greater amount of balance sheet analysis, providing improved insights into how the government is managing the public balance sheet and into the risks facing the public finances. This includes much more granular detail on contingent liabilities.
Pre-election tax cuts have been promised, but will they happen?
The Chancellor was very clear in telling his backbenchers and the country that he would like to cut taxes before the next election, demonstrating his and the government’s commitment to lowering taxes.
For many commentators, this seemed a contradictory statement to make at the same time as presenting a fiscal event where the government is in the process of raising taxes to their highest level since the 1950s.
In practice, the Chancellor has some capacity to cut taxes based on the current forecasts and he will be hoping that the post-pandemic recovery is better than anticipated, enabling him to be even more generous.
However, as our recent article on the long-term pressures facing the public finances highlighted, the prospects of reversing the entirety of recent tax increases are remote. Long-term fiscal pressures continue to imply higher taxes will be needed absent much stronger economic growth than is anticipated, while there are plenty of economic storm clouds on the horizon including a potential cost-of-living crisis this winter.
More tax, more investment, more spending, less borrowing. ICAEW’s Public Sector experts examine the Spending Review and Autumn Budget 2021 announcements. The centre piece of the Spending Review and Autumn Budget 2021 was the already announced major tax and spending increase from the health and social levy, while a series of pre-announcements of (mostly) capital investment programmes obscured some relatively tough spending settlements for departmental current budgets.
As expected, the Office for Budget Responsibility revised its forecasts for economic growth upwards, reducing its estimate of the permanent scarring effect on the economy from 3% to 2%. The revised forecasts were a big contributor in reducing the forecast deficit for the 2022/23 financial year commencing in April by £24bn from £107bn to £83bn.
The reduction in the expected deficit next year was after absorbing £10bn from the effects of higher inflation on debt interest costs and an extra £27bn allocated to the Spending Review in 2022/23 over and above the £15bn provided by the health and social care levy. However, there is no supplementary pot for COVID-19 measures from April 2022 onwards, leaving departments to absorb any further costs arising from within their budget allocations.
By folding COVID-19 funding into the Spending Review for 2022/23 to 2024/25 in this way, the Chancellor was able to report real-terms increases in resource as well as capital departmental budgets. However, spending pressures remain intense and many departments are likely to need to find cuts in specific areas if they are to meet demands on public services, catch up on backlogs built up during the pandemic as well as cover the cost of what are likely to be higher public sector wage settlements than have been seen for many years.
Total departmental resource expenditure (RDEL) in the Spending Review increased from a March 2021 forecast of £393bn, £410bn and £427bn for 2022/23, 2023/24 and 2024/25 to £435bn, £443bn and £454bn respectively. The changes comprise £15bn, £12bn and £14bn from the health and social care levy announced in September 2021 and a further £27bn, £21bn and £13bn in the Spending Review. The total compares with the £385bn allocated in the current financial year excluding £70bn allocated for COVID-related spending.
Capital investment (CDEL) in the Spending Review has been set at £107bn, £111bn and £112bn in each of the three financial years ending 31 March 2023, 2024, and 2025, pretty much in line with previous announcements from earlier in the year. This still reflects a substantial increase when compared with the £99bn estimate for the current year, the £94bn for last year, and the £70bn recorded in 2019-20.
Welfare spending (outside the Spending Review) is expected to increase from £247bn in 2021-22 to £254bn next year, principally a consequence of inflation more than offsetting a £2bn saving from not continuing with the £20 universal credit uplift, and a £5bn saving from suspending the triple lock.
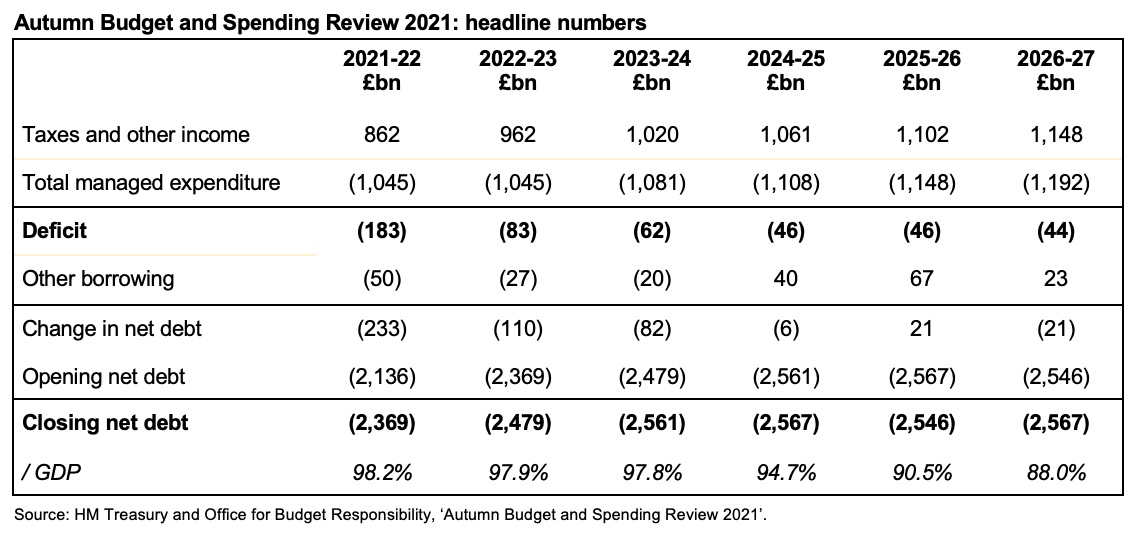
Total managed expenditure (TME) is expected to fall from £1,115bn in the last financial year to £1,045bn in both the current financial year and next year, before rising to £1,081bn in 2023/24, £1,108bn in 2024/25, £1,148bn in 2025/26 and £1,192bn in 2026/27. At the same time tax and other income is expected to increase from a pandemic-low of £795bn last year, to £862bn this year and £962bn next year, before increasing to £1,020bn, £1,061bn, £1,102bn and £1,148bn in the four following years.
The deficit is expected to fall from £320bn in 2020/21 to £183bn this year to £83bn in 2022/23, before falling to £62bn, £46bn, £46bn and £44bn in 2023-24 through 2026/27. Unlike the Chancellor’s two predecessors, the government is no longer planning to eliminate the deficit completely and instead is aiming to target a current budget surplus by 2023/24 – continuing to borrow to fund capital investment.
Public sector net debt is expected to increase from £1,793bn (84% of GDP) before the pandemic in March 2020 to £2,136bn (97%) in March 2021 to £2,369bn (98%) at the end of this financial year, before gradually rising to £2,561bn (98%) in March 2024, before stabilising in cash terms after that point but falling as a proportion of GDP to 88% by March 2027.
Despite the upbeat nature of the Budget announcement in the House of Commons, the Chancellor made some tough choices, while key announcements such as the Integrated Rail Plan and the Levelling Up White Paper were deferred into the future.
Alison Ring, Director of Public Sector and Taxation for ICAEW, commented: “The statement from the Chancellor was full of fizz, with capital investment across the country and additional funding provided for the five key Spending Review priorities of levelling up; net zero; education, jobs and skills; health; and crime and justice; partially offset by falls in COVID-19 funding.
“The tough decision to raise taxes through the health and social care levy gave the Chancellor more money to address some of the more immediate spending pressures of an ageing population, and the consequences of the pandemic. However, despite improved transparency on the government’s balance sheet, the Budget today left many questions about how he plans to get the public finances back under control over the longer-term.”