23 October 2020: The gap between spending and receipts widened to £208bn in the half-year to September 2020, significantly greater than the £80bn in the first half of 2009-10 at the height of the financial crisis.
The #icaewchartoftheweek is on UK public spending and receipts in the light of the September 2020 public finance release that reported a fiscal deficit of £208bn for the six months ended 30 September 2020, comprising public spending of £567bn less receipts of £359bn.
The chart illustrates how the shortfall in receipts and public spending of £26bn (public spending £289bn – receipts £263bn) and £14bn (£303bn – £289bn) in the first and second halves of 2006-07 increased to £80bn (£347bn – £267bn) and £78bn (£375bn – £297bn) in 2009-10 before gradually declining to £31bn (£421bn – £390bn) and £8bn (£433bn – £425bn) in the first and second halves of 2018-19 respectively.
The chart highlights how deficits added up over a decade (a cumulative £1.1tn between 1 April 2008 and 31 March 2018) even as the gap between spending and receipts narrowed as well as how much the shortfall has widened in the first half of 2020-21. With a further £140bn or so shortfall expected in the second of the financial year, it will take a strong economic rebound to prevent another trillion of deficits accumulating over the coming decade.
Although the Spending Review in November will now only cover the 2021-22 financial year for current expenditure, it is expected to set capital expenditure budgets for 2022-23 as well. This will be important in giving departments confidence to get infrastructure spending projects underway as quickly as possible next year if there is to be an investment-led economic recovery.
22 October 2020: Public finances remain on track for the worst peace-time deficit ever, thanks to lower receipts and large-scale coronavirus interventions.
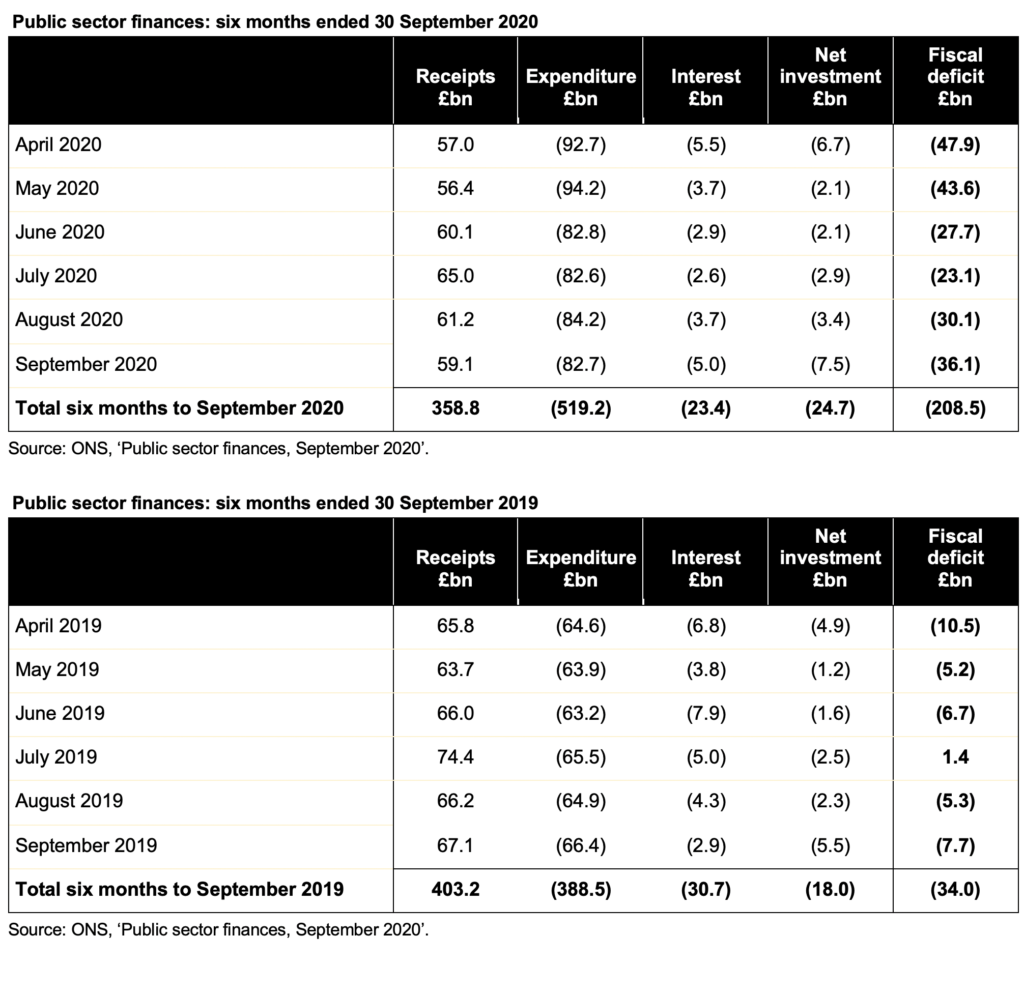
The latest public sector finances reported a deficit of £36.1bn in September 2020, a cumulative total of £208.5bn for the first six months of the financial year.
Falls in VAT, corporation tax and income tax drove lower receipts, while large-scale fiscal interventions resulted in much higher levels of expenditure. Net investment is greater than last year, as planned, while the interest line has benefited from ultra-low interest rates.
Public sector net debt increased to £2,059.7bn or 103.5% of GDP, an increase of £259.2bn from the start of the financial year and £274.0bn higher than in September 2019. This reflects £50.7bn of additional borrowing over and above the deficit, most of which has been used to fund coronavirus loans to business and tax deferral measures.
Commenting on the figures Alison Ring, ICAEW Director for Public Sector, said: “The deficit of £208bn is already more than the full-year deficit at the height of the financial crisis a decade ago and remains on track to be the largest ever outside the two world wars.
“The economic damage caused by the pandemic in the first half of the fiscal year was not as bad as originally feared, thanks in part to the extraordinary level of financial support provided by the Chancellor. However, the second wave is putting further strain on the public finances as new regional restrictions are placed on economic activity.
To help the recovery the Chancellor must take the opportunity at the Autumn Statement and Spending Round to invest in preparing infrastructure projects to start as soon as possible.”
The combination of receipts down 11%, expenditure up 34% and net investment up 37% has resulted in a deficit for the six months to September 2020 that is approaching four times the budgeted deficit of £55bn for the whole of the 2020-21 financial year set in the Spring Budget in March. This is despite interest charges being lower by 24%. The cumulative deficit is more than six times as much as for the same six-month period last year.
Cash funding (the ‘public sector net cash requirement’) for the six months was £257.8bn, compared with £7.1bn for the same period in 2019.
Interest costs have fallen despite much higher levels of debt, with extremely low interest rates benefiting both new borrowing to fund government cash requirements and borrowing to refinance existing debts as they have been repaid.
The Institute for Fiscal Studies’ recent IFS Green Budget 2020 annual pre-Budget report indicated that the deficit for the full year to March 2021 could reach £350bn or 17% of GDP.
Some caution is needed with respect to the numbers published by the ONS, which are expected to be repeatedly revised as estimates are refined and gaps in the underlying data are filled. In particular, the OBR points out that the ONS has yet to record any allowance for losses that might arise on the more than £100bn of tax deferrals, loans and guarantees provided to support businesses through the pandemic.
The ONS made a number of revisions to prior month and prior year fiscal numbers to reflect revisions to estimates and changes in methodology. These had the effect of reducing the reported fiscal deficit in the first five months from the £173.7bn reported last time to £172.4bn and reducing the reported deficit for 2019-20 from £55.8bn to £54.5bn.
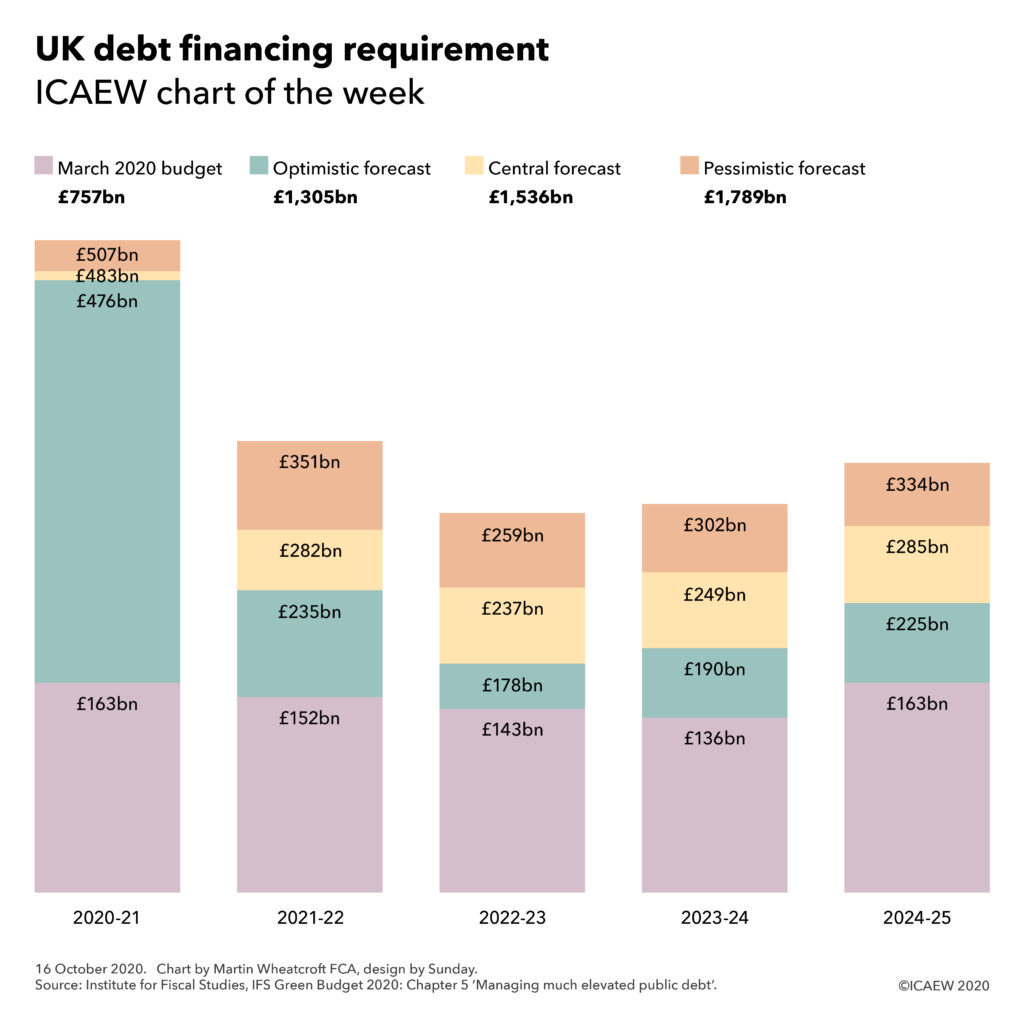
16 October 2020: The Institute for Fiscal Studies annual pre-Budget report forecasts a doubling to £1.5tn in the amount of debt to be raised by the UK Government over the next five years.
Although the Budget itself may have been delayed, the IFS Green Budget 2020 has been published on schedule, with a wealth (if that is the right word in the current context) of analysis on the economy and the public finances.
With £201bn in discretionary measures and a £95bn economic impact from the coronavirus pandemic, the IFS is forecasting that the deficit will reach £350bn in the current financial year. At 17% of GDP, this is a level never before seen in the UK outside of the two world wars.
Unfortunately, the effect of the pandemic on public finances will not be restricted to this financial year. Even if the economy recovers in 2021, or more likely in 2022, tax revenues will be significantly lower and spending significantly higher than they were previously expected to be.
This is perhaps best highlighted by looking at the UK Government’s gross financing requirement – the amount that the UK Debt Management Office (DMO) will be tasked with raising from external debt investors over the next five years to finance the shortfall in taxes compared with spending (the deficit), to finance business and other lending and to repay existing debts as they fall due. This is forecast by the IFS to double to £1.5tn in their central forecast, within a range from £1.3tn in a more optimistic scenario to £1.8tn in a more pessimistic scenario.
As the IFS points out, the enormous amount of debt being issued means that even small differences in financing costs will have a very large impact on the public finances. This is despite the sizeable proportion of debt being issued with long maturities (as long as 50 years in some case) that are locking in extremely low interest rates for decades to come.
Reducing interest costs on debt has provided the Chancellor with room to provide the unprecedented levels of financial support to the UK economy that we saw over the summer. The prospect of negative nominal rates could see investors paying the Government rather than the other way round, providing headroom for further interventions.
There is a downside, of course. The ‘good times’ of ultra-low interest rates may not last for ever, and with a central debt forecast at 31 March 2025 of 112% of GDP significantly higher than the 35% of GDP before the financial crisis a dozen years ago the exposure to changes in interests is that much more significant.
To find out more about the latest forecasts for the economy and the impact that will have on the public finances, please do read the IFS Green Budget 2020.
29 September 2020: Recently published figures show that the Government burnt through £224bn in the five months to August 2020. This should not stand in the way of an investment-led economic recovery, according to ICAEW’s Public Sector team.
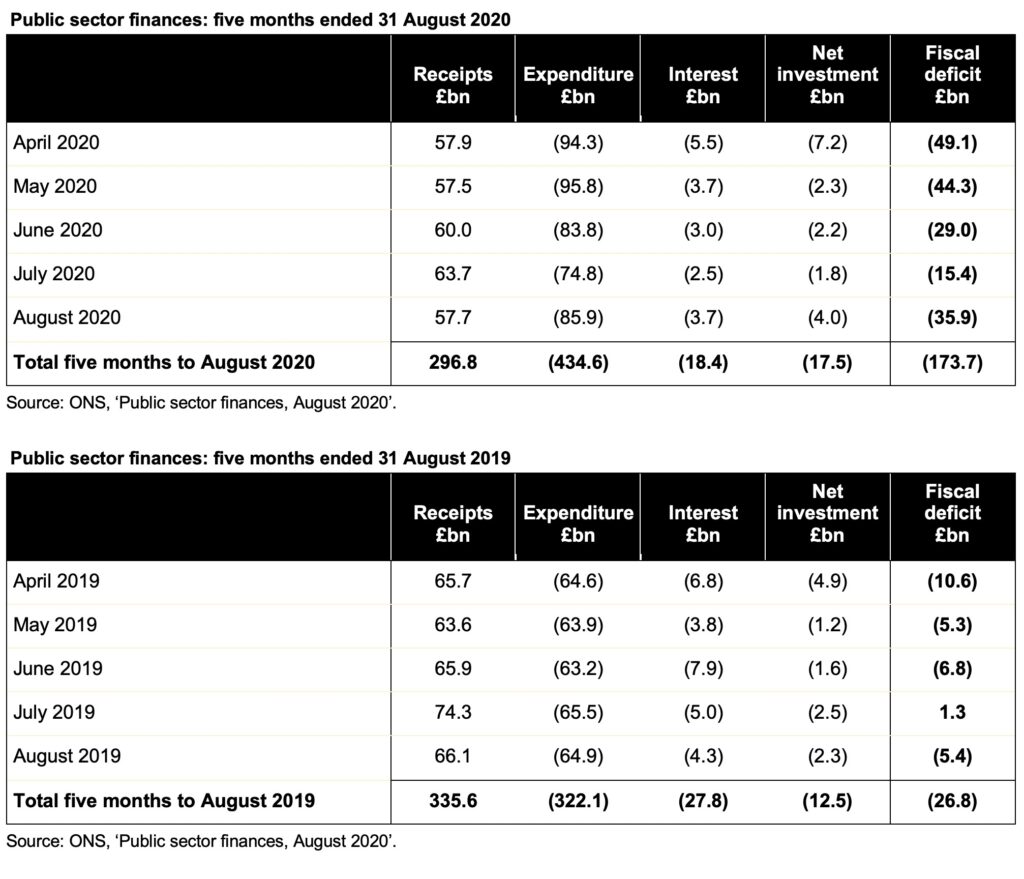
The latest public sector finances for August 2020 published by the Office for National Statistics (ONS) on Friday 25 September 2020 reported a deficit of £35.9bn in August 2020, a cumulative total of £173.7bn for the first five months of the financial year.
Falls in VAT, corporation tax and income tax drove lower receipts, while large-scale fiscal interventions resulted in much higher levels of expenditure. Net investment is greater than last year, as planned, while the interest line has benefited from ultra-low interest rates.
Public sector net debt increased to £2,023.9bn or 101.9% of GDP, an increase of £223.4bn from the start of the financial year and £249.5bn higher than in August 2019. This reflects £49.7bn of additional borrowing over and above the deficit, most of which has been used to fund coronavirus loans to business and tax deferral measures.
The combination of receipts down 12%, expenditure up 35% and net investment up 40% has resulted in a deficit for the five months to August 2020 that is more than three times the budgeted deficit of £55bn for the whole of the 2020-21 financial year set in the Spring Budget in March, despite interest charges being lower by 34%. The cumulative deficit is more than six times as much as for the same five-month period last year.
Cash funding (the ‘public sector net cash requirement’) for the five months was £224.0bn, compared with £5.8bn for the same period in 2019.
Interest costs have fallen despite much higher levels of debt, with extremely low interest rates benefiting both new borrowing to fund government cash requirements and borrowing to refinance existing debts as they have been repaid.
Some caution is needed with respect to the numbers published by the ONS, which are expected to be repeatedly revised as estimates are refined and gaps in the underlying data are filled. In particular, the OBR points out that the ONS has yet to record any allowance for losses that might arise on the more than £100bn of tax deferrals, loans and guarantees provided to support businesses through the pandemic.
Alison Ring FCA, director for public sector at ICAEW, commented: “The government continued to haemorrhage cash in August, despite furloughed employees returning to work and the warm weather encouraging people to spend money outside their homes. The Chancellor’s Eat Out to Help Out subsidy may have hit the headlines, but at £522m it was only a fraction of the total spending in the year to date of £470.5bn. Large sums were also spent on Test & Trace and PPE, as well on fiscal interventions such as the coronavirus job retention scheme.
While the decision to postpone the Budget until the Spring is understandable given the economic uncertainties as we enter the next phase of the pandemic, we hope that this will not mean further delays for the National Infrastructure Strategy and the green-lighting of infrastructure projects across the country, which will be vital for an investment-led economic recovery.”
The ONS made several revisions to prior month and prior year fiscal numbers to reflect revisions to estimates and changes in methodology and classification. These had the effect of reducing the reported fiscal deficit in 2019/20 from £59.7bn to £55.8bn and in 2018/19 from £41.0bn to £38.8bn. There was a reduction of £12.7bn in the estimated deficit in the first four months of the current financial year from that reported last month primarily because of overestimating central government procurement in those months.
22 September 2020: Physical cash use is declining fast, leaving the fixed cost base for processing cash transactions at risk of stranding. As cards and digital forms of payment become more prevalent, what will happen to those who still need access to cash?
The National Audit Office (NAO) issued a report on 18 September 2020 on the production and distribution of cash. It looks at what the Bank of England, the Royal Mint, HM Treasury and financial regulators are doing in response to a 59% decline in the volume of cash transactions between 2008 and 2019, as well as efforts to improve the efficiency of cash production and reduce counterfeiting.
According to data from UK Finance, cash payment values fell from £267bn in 2008 to £141bn in 2019 and were (prior to the pandemic) forecast to fall to £59bn by 2028.
Coin production has fallen significantly, with 383m coins manufactured for circulation in 2019-20 compared with 1.1bn in 2010-11. Notes in circulation have continued to increase (to 4.4bn notes with a monetary value of £76.5bn in July 2020), but only around 20%-24% of these are used for cash transactions and 5% used for savings, leaving over £50bn whose location is uncertain – a point which the NAO believes deserves further investigation.
A key finding from the report is that there is no single body in government responsible for overseeing how well the cash system is performing, despite the establishment of a Joint Authorities Cash Strategy Group (JCAS) focused on access to cash for those that need it, in particular for the million or so UK adults who do not have a bank or building society account.
The UK’s entire cash infrastructure across the public and private sectors is estimated to cost around £5bn a year, with many of these being fixed costs that with declining usage are putting pressure on the cash system.
The number of ATMs fell by 12% over the two years to December 2019 to around 60,000, with a fall of 17% in the number that were free-to-use to around 45,000. The Payment Systems Regulator (PSR) has been working with the industry to maintain free-to-use ATMs in geographic areas where provision is most limited, although the NAO recommends greater attention is given to more deprived areas.
Demand for notes and coins declined by 71% between early-March and mid-April 2020 during the COVID-19 lockdown but has since recovered. The NAO believes it is still too early to assess the longer-term impact on cash access and usage but moves amongst some retailers to suspend acceptance of cash during the pandemic could further accelerate the switch to non-cash forms of payment.
The NAO is positive about the steps the Royal Mint and the Bank of England have taken against counterfeiting. In 2016, about one in 30 £1 coins was a counterfeit, but surveys since 2018 have found very low counterfeiting rates for the new £1 coin. The introduction of the polymer £20 note, traditionally the denomination favoured by counterfeiters, should also help reduce the cost of fraud to consumers and businesses.
The Royal Mint reported a reduced loss of £3.9m on its coin-making activities in 2019-20, with actions to improve efficiency including a 22% headcount reduction within its currency division and the mothballing of two of its six plating lines. The Bank of England has also worked with De La Rue to improve efficiency, albeit each polymer banknote costs 60% to 80% more than a paper one, even if they are expected to last at least 2.5 times longer.
The NAO recommends that HM Treasury takes another look at the roles and responsibilities of the bodies involved in the cash system, setting out more clearly the specific outcomes it wants to deliver for consumers and small businesses and how this should be balanced against the cost of doing so. It also believes that a plan is needed to take action if some groups become left behind as the cash system changes.
Martin Wheatcroft FCA, adviser to ICAEW on public finances, commented: “The NAO has provided some extremely useful insights into how the UK’s cash system is coping with declining usage and it makes a number of sensible recommendations for improvements.
“However,” continued Wheatcroft, “the report does not answer the more fundamental issue of whether cash has a long-term future at all, and in particular whether the multi-billion costs of running cash and other legacy payment systems could be better deployed.
“Ultimately, is it now time to look beyond a managed decline of the cash system and explore more radical options?”
21 September 2020: The National Audit Office COVID-19 cost tracker provides critically important data about the current £210bn cost of the pandemic but disappoints in the way it presents this financial information.
Page 10 of the NAO covid-19 cost tracker
The National Audit Office (NAO) has published a COVID-19 cost tracker comprising details of over 190 different measures announced by government departments in response to the coronavirus pandemic. This is an extremely valuable exercise in seeking to track the huge amounts being spent in the absence of any centrally collated financial tracking by the Government itself.
As of 7 August 2020, the NAO has identified around £210bn of measures, of which around £70bn has been confirmed as having been incurred. A number of the measures are unquantified and many of the numbers are broad-brush estimates that may individually turn out to be significantly different.
The largest items in the list are the £47bn estimated cost of the coronavirus job retention scheme (CJRS), £16bn in bounce back loans, £15bn for the self-employed income support scheme, £15bn on personal protection equipment, £13bn for the devolved administrations under the Barnett formula, £12bn on business grants, £12bn in waived business rates and £10bn on testing and tracing. Together these eight items amount to around two-thirds of the total.
Unfortunately, the NAO has provided this data as a 22-page table with very limited summarisation or categorisation, making it extremely challenging to analyse the information which it provides. For example, costs are not analysed between tax cuts, public spending or lending activities, making it difficult to work out their impact on the public finances.
Admittedly, the NAO has had to put this information together itself, which it shouldn’t have had to do. A well-run central government finance function would have already collated and analysed this information, allowing the auditors to concentrate on providing assurance on the data through their audit work.
Despite those criticisms, the NAO COVID-19 cost tracker will help improve the quality of our understanding of the financial impact of the pandemic and will no doubt inform the next iteration of the Office for Budget Responsibility (OBR) coronavirus analysis.
16 September 2020: The National Audit Office has issued a report on the £20m cost of exiting the failed Magnox contract to decommission nuclear research sites and power stations.
The National Audit Office (NAO) report covers the handling by the Nuclear Decommissioning Authority (NDA) of the failed Magnox contract to decommission two nuclear research sites and 10 Magnox power stations and the estimated £20m cost incurred on exiting the contract.
The NDA is a statutory body established in 2005 to take ownership of the decommissioning programme for the UK’s oldest fleet of nuclear power stations and other nuclear facilities. At 31 March 2020, the NDA had an estimated liability of £135bn in its accounts for the costs of decommissioning still to be incurred.
The NDA has awarded a series of contracts to clean up nuclear sites and deal with radioactive materials, including fuel. This includes the 14-year Magnox contract awarded in 2014 to Cavendish Fluor Partnership (CFP) which the High Court decided was wrongly awarded, with the NDA agreeing a £97m settlement with a bidder in 2017.
The NDA then decided to terminate the contract with CFP nine years early, and an earlier report by the NAO stated how £122m had been lost by that point. The Public Accounts Committee reported in 2018 that the NDA needed to improve its understanding of the state of the sites, its ability to monitor work carried out on them, and the capability and expertise of its executive team.
Since 2017, a revised contract has been agreed with CFP and further litigation avoided, with £2.7bn of decommissioning work completed before the contract ended in August 2019.
The NAO says there have been further costs to the taxpayer, including an estimated termination cost of £20m to negotiate the early exit from the contract and incentivise a smooth handover of sites without further legal challenge. This is a relatively small amount in the context of the £6.9bn to £8.7bn estimated cost for decommissioning the Magnox sites.
The NAO report stated: “With the NDA now taking more direct control over the management of its sites, it will be critically important that it builds and retains better knowledge of the condition of its sites to enable it to plan and deliver decommissioning work efficiently and effectively. The NDA considers that it will be better placed to achieve this under its revised delivery model, but it is too early for us to assess the effectiveness of these arrangements.”
Martin Wheatcroft FCA, adviser to ICAEW on public finances, commented: “The huge sums being spent on decommissioning nuclear facilities can hide many sins, but we are fortunate that the National Audit Office is able to dig around and analyse what is going on.
“On this occasion, the £20m cost of exiting the Magnox contract appears a relatively small price to pay for a second chance at getting the decommissioning of the Magnox fleet right. There are much larger sums – in the billions – riding on the as-yet unproven new delivery model being put in place by the Nuclear Decommissioning Authority.”
11 September 2020: The UK’s highly regarded diplomatic service in the FCO was combined last week with the UK’s highly respected international development department DfID to form a new government department – the FCDO.
The newly established Foreign, Commonwealth & Development Office (FCDO) is the subject of the #icaewchartoftheweek, illustrating the amounts spent by its predecessor departments in the financial year ended 31 March 2020. The Foreign & Commonwealth Office (FCO) incurred net expenditure in the order of £2,750m, while the Department for International Development (DfID) spent £10,350m, a combined total of £13.1bn.
Although DfID was the bigger department in financial terms, the FCO was larger operationally with 13,751 staff in 2019-20 (5,263 in the UK and 8,488 abroad) compared with the 3,535 employed by DfID (2,628 in the UK and 773 abroad). As a consequence, net operational spending amounted to somewhere in the region of £1,250m for the FCO, while DfID cost in the order of £350m to run.
The FCO spent approximately £700m in 2019-20 on international programmes, including grants to the British Council and the BBC World Service amongst others. The other big element of its spending of just under £800m was on conflict prevention, stability and peacekeeping.
DfID spent around £2,150m on international development programmes and organisations, policy, research and evidence and humanitarian aid and £750m on conflict, security and stabilisation. Around £3,000m was spent on economic development, while £4,100m went to regional programmes, including approximately £900m in west and southern Africa, £1,300m in east and central Africa, £850m in the Middle East and north Africa and £1,050m in Asia and elsewhere in the world.
DfID has provisionally calculated that total development spending across the UK Government, including by the FCO, DfID, Home Office, Business, Energy & Industrial Strategy and Department for Environment, Food and Rural Affairs departments, amounted £15.2bn in total in the 2019 calendar year. This was in line with the UK Government’s legally binding commitment to spend 0.7% of Gross National Income on development. This includes a proportion of the EU’s spending on international development but excludes the UK’s contributions towards development within the EU, in particular in eastern European member states.
The coronavirus pandemic has reduced the size of the economy this year and hence the 0.7% calculation will result in a smaller amount to spend in 2020-21, hence the combined budget for the FCDO will be smaller than the amount spent in the last financial year.
The new department is abbreviated to FCDO in writing, which the Government is insisting should be spoken out loud as ‘focado’ (similar to the online grocery store), no doubt in a valiant attempt to prevent other forms of short-form pronunciations becoming popular.
21 August 2020: The fiscal deficit of £150.5bn for the four months to July 2020 is almost triple the £55bn budgeted for the entire financial year.
The latest public sector finances for July 2020 published by the Office for National Statistics (ONS) on Friday 21 August 2020 reported a deficit of £26.7bn in July 2020, following on from £123.8bn for the three months to June 2020 (revised from £127.9bn reported last time).
Public sector net debt increased to £2,004.0bn or 100.5% of GDP, an increase of £198.3bn from the start of the financial year and £227.6bn higher than in July 2019. This is the first time this measure has exceeded £2tn, a major milestone that has arrived several years earlier than anticipated as a consequence of the pandemic.
The combination of lower tax receipts and much higher levels of public spending has resulted in a deficit for the four months to July 2020 that is almost triple the budgeted deficit of £55bn for the whole of the 2020-21 financial year set in the Spring Budget in March, and almost seven times as much as the same period last year.
Cash funding (the ‘public sector net cash requirement’) for the four months was £199.1bn, compared with £5.4bn for the same period in 2019.
Interest costs have fallen despite much higher levels of debt, with extremely low interest rates benefiting both new borrowing to fund government cash requirements and borrowing to refinance existing debts as they have been repaid.
Some caution is needed with respect to the numbers published by the ONS, which are expected to be repeatedly revised as estimates are refined and gaps in the underlying data are filled. In particular, the OBR points out that the ONS has yet to record any allowance for losses that might arise on the more than £100bn of tax deferrals, loans and guarantees provided to support businesses through the pandemic.
Commenting on the latest figures Alison Ring FCA, director for public sector at ICAEW, said:
“The positive news for the Government is that despite debt reaching £2tn, low interest rates have reduced its cost, and its growth is slowing as the exceptional support measures to deal with the pandemic are withdrawn and furloughed employees return to work.
“The big question is how much permanent damage is being done to the economy, with accelerating job losses a concerning sign as we approach the autumn. How quickly debt continues to grow will also depend on any additional support that the Government might provide to sectors that are still struggling.”
21 August 2020: Ministers insulated older employees from public sector pension reforms in 2015, despite advice saying not to. The courts found this was age discrimination, resulting in a £31bn charge in the Whole of Government Accounts.
When the Hutton review on public sector pensions reported in 2011, it recommended retaining the defined-benefit pensions provided to public sector employees. However, it wanted to reform how public sector pensions are calculated to reduce the cost to taxpayers, while at the same making them fairer for lower-paid employees.
Recommendations included switching from final salary to career average for calculating pension entitlements, aligning the retirement age for most public sector employees with the state pension age, and increasing employee contributions.
The Hutton reforms followed a major cost saving already achieved in switching from RPI to CPI-linked increases for pensions in retirement, which resulted in a one-off gain of £126bn in the 2010-11 Whole of Government Accounts (equivalent to a 10% reduction in the gross pension liability at that time) as well as reducing the cost of providing pensions going forward.
To protect existing employees, Hutton recommended that accrued rights at the date of the switch should still be calculated on final salaries, with only subsequent years of service accruing on an average salary basis. Retaining existing rights meant there was no significant gain or loss recorded when the reforms to existing pension arrangements were implemented in 2014 and 2015, with any cost savings arising in future years.
Despite the Hutton report explicitly stating that “age discrimination legislation … means that it is not possible in practice to provide protection from change for members who are already above a certain age”, the Government decided to provide transitional protection for older members. Full transitional protection was offered to workers 10 years or less away from retirement in 2012, with partial protection on a sliding scale tapering away to zero for those with 14 or more years to go until retirement at that point.
As might have been expected, given the clear advice in the Hutton review that this would constitute unlawful age discrimination, the UK Government lost in the Supreme Court in 2019 in the McCloud and Sargeant cases. As a consequence, employees that have lost out because the transitional protections did not apply to them will receive an uplift in their pensions when they reach retirement.
Illustrative example
To illustrate the issue, consider the case of fictional civil servants Sarah and Maxine who were 20 and 10 years away from retirement respectively in 2012 and who were moved into the new career-average ‘alpha’ pension scheme in 2015. Each is expected to retire with 30 years’ service on a final year salary of £80,000, following rapid promotions in their final 10 years of service.
In this illustration, Maxine, who in 2012 had 10 years to go before retirement, should receive an initial pension of £40,000 a year when she retires in 2022, including a £500 transitional protection uplift.
Without transitional protection, Sarah would expect to receive £34,000 a year when she retires in 2032. Although the precise details of the remedy in response to the court judgements is still being worked out (see HM Treasury consultation), it is likely that Sarah will now receive a transitional protection uplift covering the period from 2015 to 2022, potentially adding around £4,000 (based on our illustrative assumptions) to her pension on retirement, but still below what she would have received without the changes.
The court ruling will only affect employees who would have got more under the final salary arrangements. For a significant proportion of public sector workers, the faster accrual rate on a career average basis will provide them with a higher pension than they would have received under the slower accrual rate applied to final salary under the old arrangements. They will not have lost out from not having had transitional protection.
Spotlight on the £2.2tn public sector pension liability
The £31bn past service cost recorded in the Whole of Government Accounts in 2018-19 added 1.4% to the amounts owed to current and former public sector employees for their accrued pension rights, increasing the gross liability recorded to £2.2tn at 31 March 2019. (The Government separately reported that the court judgements would cost £17bn but did not explain how this number reconciled with the £31bn reported in the accounts.)
£2.2tn is a huge amount of money, equivalent to around £80,000 for each household in the UK. Most public sector schemes are unfunded (£1,756bn out of the £2,244bn gross liability) with pension payments funded out of future taxation. Local authority and other funded public sector schemes (£488bn) do have pension fund investments (£350bn at 31 March 2019) set aside to pay pensions, but they will need to increase their contributions to those funds to cover the cost of extending transitional protections to affected employees.
There are no doubt many morals to be drawn from this story, but what it does highlight is the sheer scale of the pension obligations that public sector employers have built up over the years, and just how much a single ministerial decision can end up costing taxpayers.