ICAEW chart of the week: Controlling for debt

My chart for ICAEW this week shows how the high level of public debt is the main factor shaping next week’s Autumn Budget.

ICAEW chart of the week: Controlling for debt. 

Seven column chart showing public sector net financial liabilities and public sector net debt, with the difference (the add back of non-liquid financial assets net of other financial liabilities) shown without numbers. 

Public sector net financial liabilities: £300bn, £460bn, £867bn, £1,384bn, £1,585bn, £2,439bn and £2,919bn in Mar 2000, 2005, 2010, 2015, 2020, 2025 and 2030 respectively. 

Public sector net debt: £353bn, £461bn, £1,028bn, £1,552bn, £1,816bn, £2,810bn and £3,391bn in Mar 2000, 2005, 2010, 2015, 2020, 2025 and 2030 respectively. 

21 Nov 2025. Chart by Martin Wheatcroft FCA. 
Source: OBR, 'Public finances databank', Oct 2025.

In the run up to next week’s Autumn Budget it has become clear that the Chancellor has very little room for manoeuvre. 

In past fiscal events, a moderate downgrade in the economic and fiscal forecasts (see last week’s chart of the week) would typically be dealt with by allowing borrowing to rise, albeit in combination with a small cut in planned public spending (often to capital expenditure) and perhaps some minor tax rises. 

This time is different. Borrowing – the normal safety valve for adverse forecast changes – is constrained by the existing high level of debt and by government’s existing plan to borrow substantial sums over the next five years, as illustrated by our chart of the week.

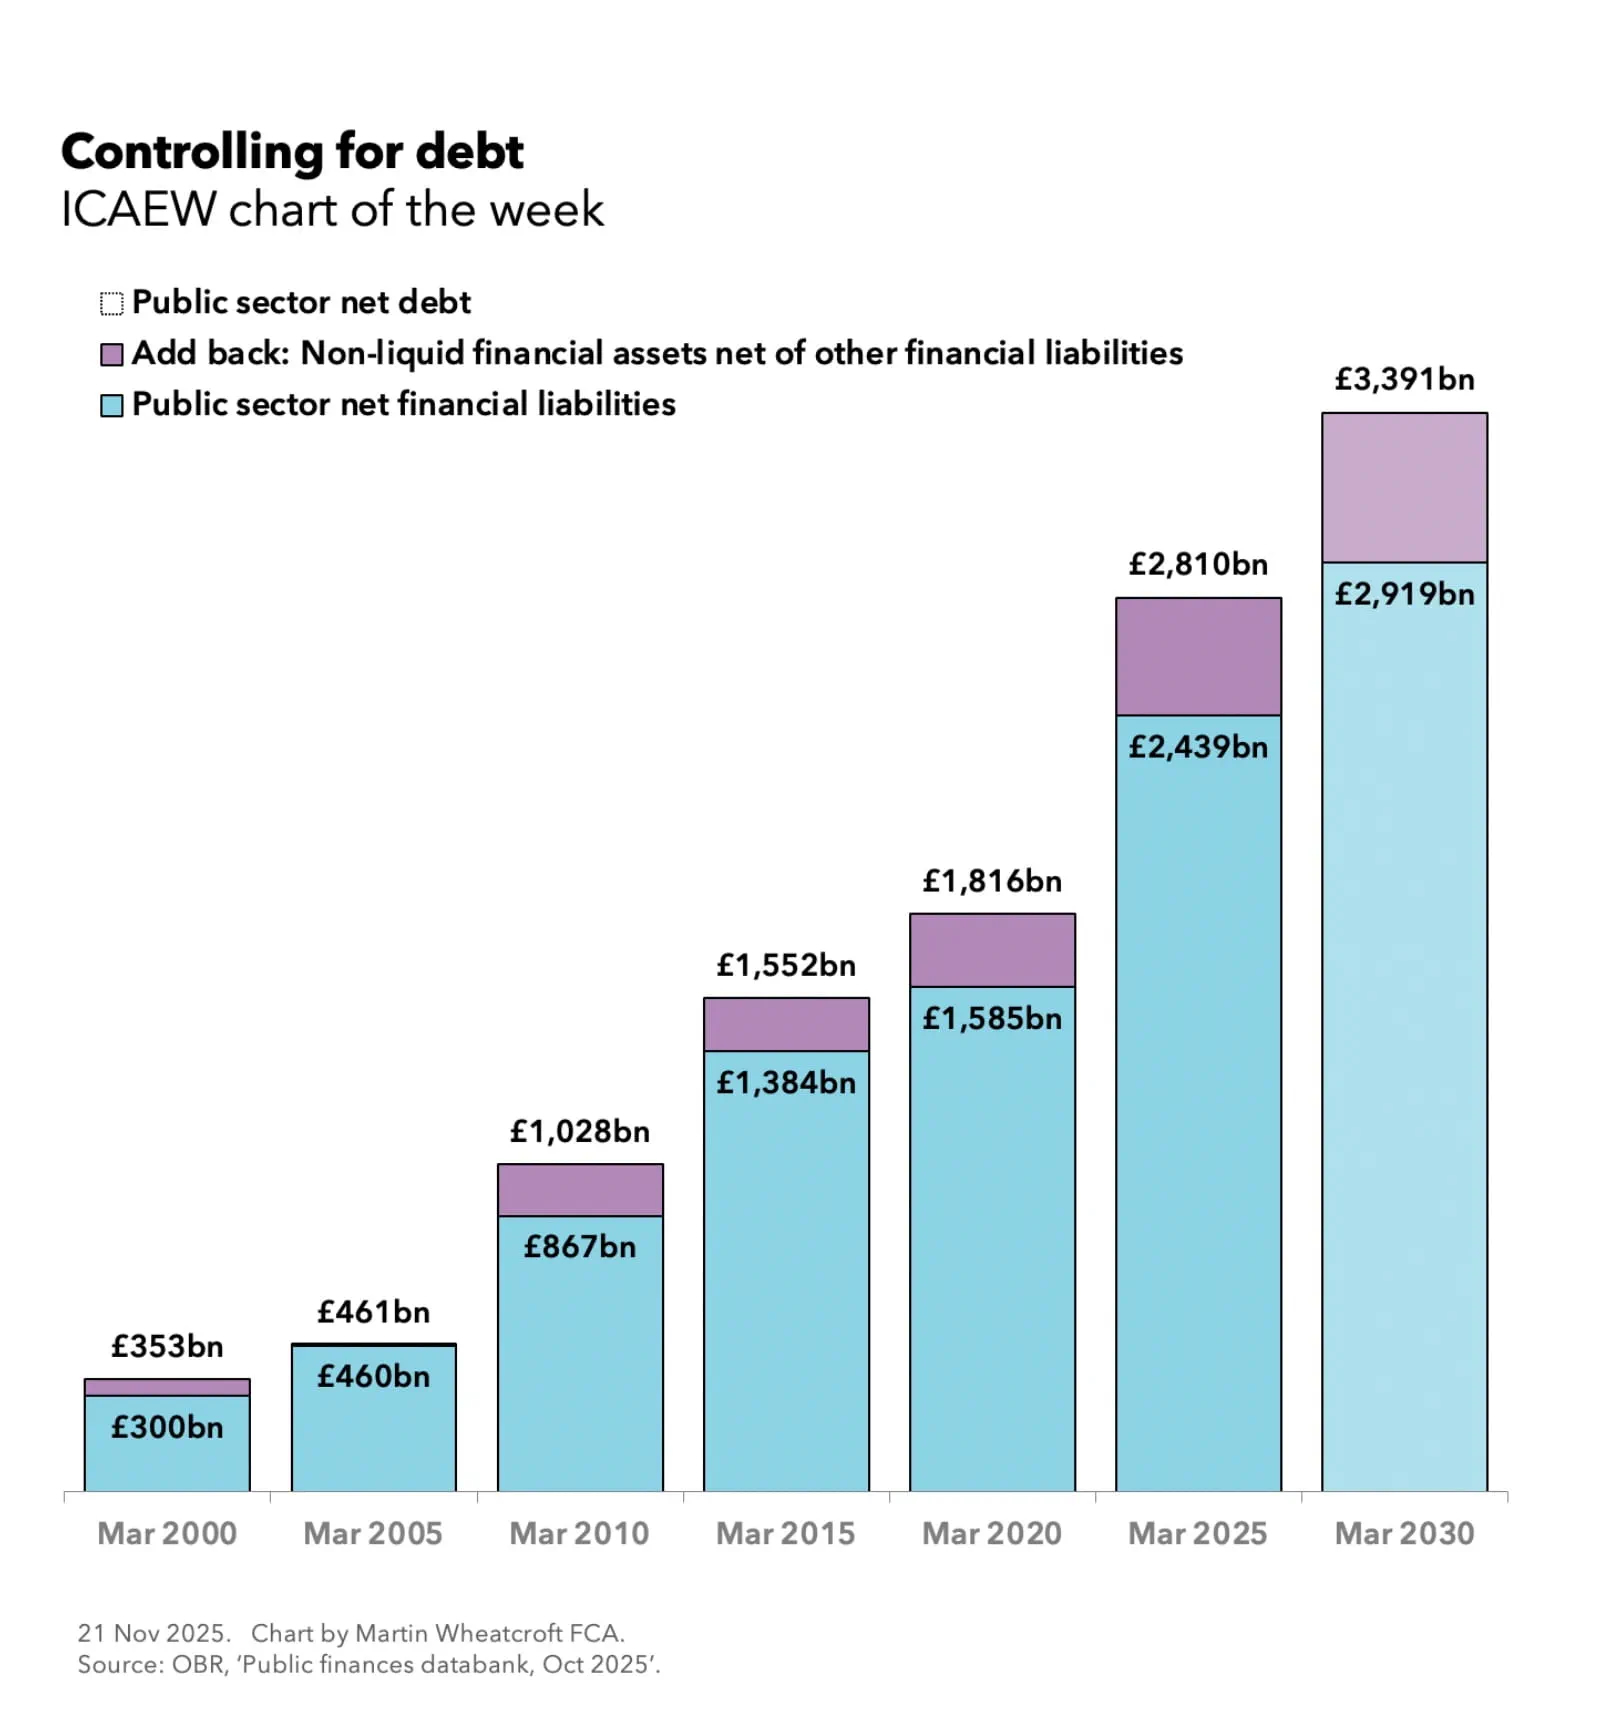
As my chart for ICAEW sets out, public sector net debt has risen over the past quarter of a century from £353bn on 31 March 2000 to £461bn in 2005, £1,028bn in 2010, £1,552bn in 2015, £1,816bn in 2020 and £2,810bn in 2025. It is forecast to rise further to £3,391bn on 31 March 2030.

Although the planned increase of £581bn over the coming five years is less than the £994bn increase over the previous five years, the latter included both the pandemic and an unexpected energy crisis.

The chart also shows how public sector net financial liabilities (PSNFL), the measure of debt that the Chancellor uses for her fiscal rules, increased from £300bn on 31 March 2000 to £2,439bn on 31 March 2025, with a planned rise of £480bn to £2,919bn due to take place on 31 March 2030.

The Chancellor’s debt fiscal rule is for the ratio of PSNFL to GDP starting to fall by 2029/30, or – in other words – for the rate at which debt is increasing to be slower than the rate of growth in the economy in four years’ time. The hope is that the borrowing the government is doing now to invest in infrastructure and economic development will speed up economic growth over that time, but unfortunately that is not yet showing up in the forecasts, which are going in the opposite direction.

With higher borrowing ruled out, the next option would be to look at spending. This also looks difficult as the Spending Review earlier this year locked in departmental budgets for the next few years (to 2028/29 for current spending and to 2029/30 for capital investment). Likewise, significant cuts in welfare spending also appear unlikely given the government’s failure to persuade its MPs to back a plan to cut back on disability and illness benefits and hints that the government wants to lift the two-child benefit cap. The Chancellor could potentially re-open the Spending Review, but that would risk spending going up not down given the continued pressures on health and the criminal justice systems, not to mention the international pressure from President Trump and others to accelerate increases in defence spending.

With other options such as raising the level of net inward migration also ruled out, that leaves taxation as the only real lever available to the Chancellor. 

The flood of speculation ahead of next week’s Autumn Budget 2025 has ranged from manifesto-busting increases in one of the ‘big three’ taxes (income tax, VAT and national insurance) and fiscal drag (from the extension of freezes in tax allowances), to a long list of tax raising ideas to bring in just a little bit more money here and there that might together add up to a substantial amount.

At this point it seems that little can be ruled out.

This chart was originally published by ICAEW.

First quarter fiscal deficit in line as Chancellor ponders tax rises

Despite borrowing to fund the deficit in the first three months of the financial year of £58bn being in line with expectations, it was still the third-highest first quarter result on record.

The monthly public sector finances release for June 2025 published by the Office for National Statistics (ONS) on 22 July reported a provisional deficit of £21bn for the month of June and £58bn for the three months then ended. This is £4bn more and in line with budget respectively, and £7bn and £8bn more in each case than the first fiscal quarter a year ago.

Alison Ring OBE FCA CPFA, ICAEW Director of Public Sector and Taxation, says: “Even if borrowing to fund the deficit in the month of June was only a little higher than expected and was in line with expectations in the first three months of the financial year, the first quarter was still the third highest since monthly records began. This trajectory will not have lightened the Chancellor’s mood as she decides which taxes to put up in the Autumn Budget later this year. 

“The government has two big problems with the public finances: the short-term outlook – which is bad – and their long-term prospects – which are worse. Public spending continues to outpace tax receipts by a significant margin, while the OBR has reiterated its conclusion that the public finances are unsustainable over the next 25 to 50 years if this and future governments continue on the current path. 

“Unfortunately, the major challenges facing the public finances over the next quarter of a century and beyond means that this will not be the last time a chancellor of the exchequer needs to come back asking for more. Now is the time to stop kicking the can down the road and develop a comprehensive long-term fiscal strategy to put the public finances onto a sustainable path.”

Month of June 2025

The fiscal deficit for June 2025 was £21bn, £4bn more than budgeted and £7bn more than a year previously. According to the ONS, this was the second-highest June deficit since monthly records began in 1993, with only June 2020 during the pandemic being higher.

First quarter to June 2025

The deficit for the first three months of the 2025/26 financial year was £58bn, £8bn more than a year previously. Despite being in line with budget, this is the third-highest first quarter deficit since monthly records began (after the first quarter deficits in 2020/21 and 2021/22). 

Table 1 highlights how total receipts and total current spending in the three months to June 2025 of £278bn and £323bn were up 7% and 8% respectively, compared with the same period last year.

Receipts were boosted by the employer national insurance increase from April 2025 onwards in addition to the effect of fiscal drag on income tax caused by the continued freeze in personal tax allowances. Meanwhile, the increase in current spending over the past year was primarily as a consequence of public sector pay rises, higher supplier costs and rises in welfare benefits.

The increase in debt interest of £5bn to £42bn consisted of a £6bn increase in indexation on inflation-linked debt as inflation returned less a £1bn reduction in interest on variable and fixed-interest debt. The latter was primarily the effect of a lower Bank of England base rate offsetting a higher level of debt compared with a year ago.

Net investment of £13bn in the first quarter of 2025/26 was £1bn or 8% higher than the same period last year. Capital expenditure of £22bn was up by £1bn and capital transfers (capital grants, research and development funding, and student loan write-offs) of £9bn were up by £1bn, less depreciation of £18bn up by £1bn.

Table 1: Summary receipts and spending

3 months to June2025/26
£bn
2024/25
£bn
Change
%
Income tax6460+7%
VAT5250+4%
National insurance4841+17%
Corporation tax2624+8%
Other taxes5756+2%
Other receipts3130+3%
Current receipts278261+7%
Public services(178)(165)+8%
Welfare(77)(72)+7%
Subsidies(8)(8)
Debt interest(42)(37)+14%
Depreciation(18)(17)+6%
Current spending(323)(299)+8%
Current deficit(45)(38)+18%
Net investment(13)(12)+8%
Deficit(58)(50)+16%

Borrowing and debt

Table 2 summarises how the government borrowed £64bn in the first quarter to take public sector net debt to £2,874bn on 30 June 2025. The movements comprised £58bn in public sector net borrowing (PSNB) to fund the deficit and £6bn to fund government lending activities and working capital movements.

The table also illustrates how the debt to GDP ratio increased from 95.2% of GDP at the start of the financial year to 96.3% on 30 June 2025, with the incremental borrowing partly offset by the ‘inflating away’ effect of inflation and economic growth adding to GDP, the denominator in the net debt to GDP ratio.

Table 2: Public sector net debt and net debt/GDP

3 months to June2025/26
£bn
2024/25
£bn
PSNB5850
Other borrowing6(3)
Net change6447
Opening net debt2,8102,686
Closing net debt2,8742,733
PSNB/GDP2.0%1.8%
Other/GDP0.2%(0.1%)
Inflating away(1.1%)(1.5%)
Net change1.1%0.2%
Opening net debt/GDP95.2%95.6%
Closing net debt/GDP96.3%95.8%

Public sector net debt on 30 June 2025 of £2,874bn comprised gross debt of £3,286bn less cash and other liquid financial assets of £412bn. 

Public sector net financial liabilities were £2,504bn, comprising net debt of £2,874bn plus other financial liabilities of £706bn less illiquid financial assets of £1,076bn. Public sector negative net worth was £878bn, being net financial liabilities of £2,504bn less non-financial assets of £1,626bn.

Revisions

Caution is needed with respect to the numbers published by the ONS, which are repeatedly revised as estimates are refined and gaps in the underlying data are filled. This includes local government where the numbers are only updated in arrears and are based on budget or high-level estimates in the absence of monthly data collection.

The latest release saw the ONS revise the previously reported deficit for the two months to May 2025 down by £1bn and revise public sector net debt on 31 May 2025 up by £7bn.

For further information, read the public sector finances release for June 2025.

This article was originally published by ICAEW.