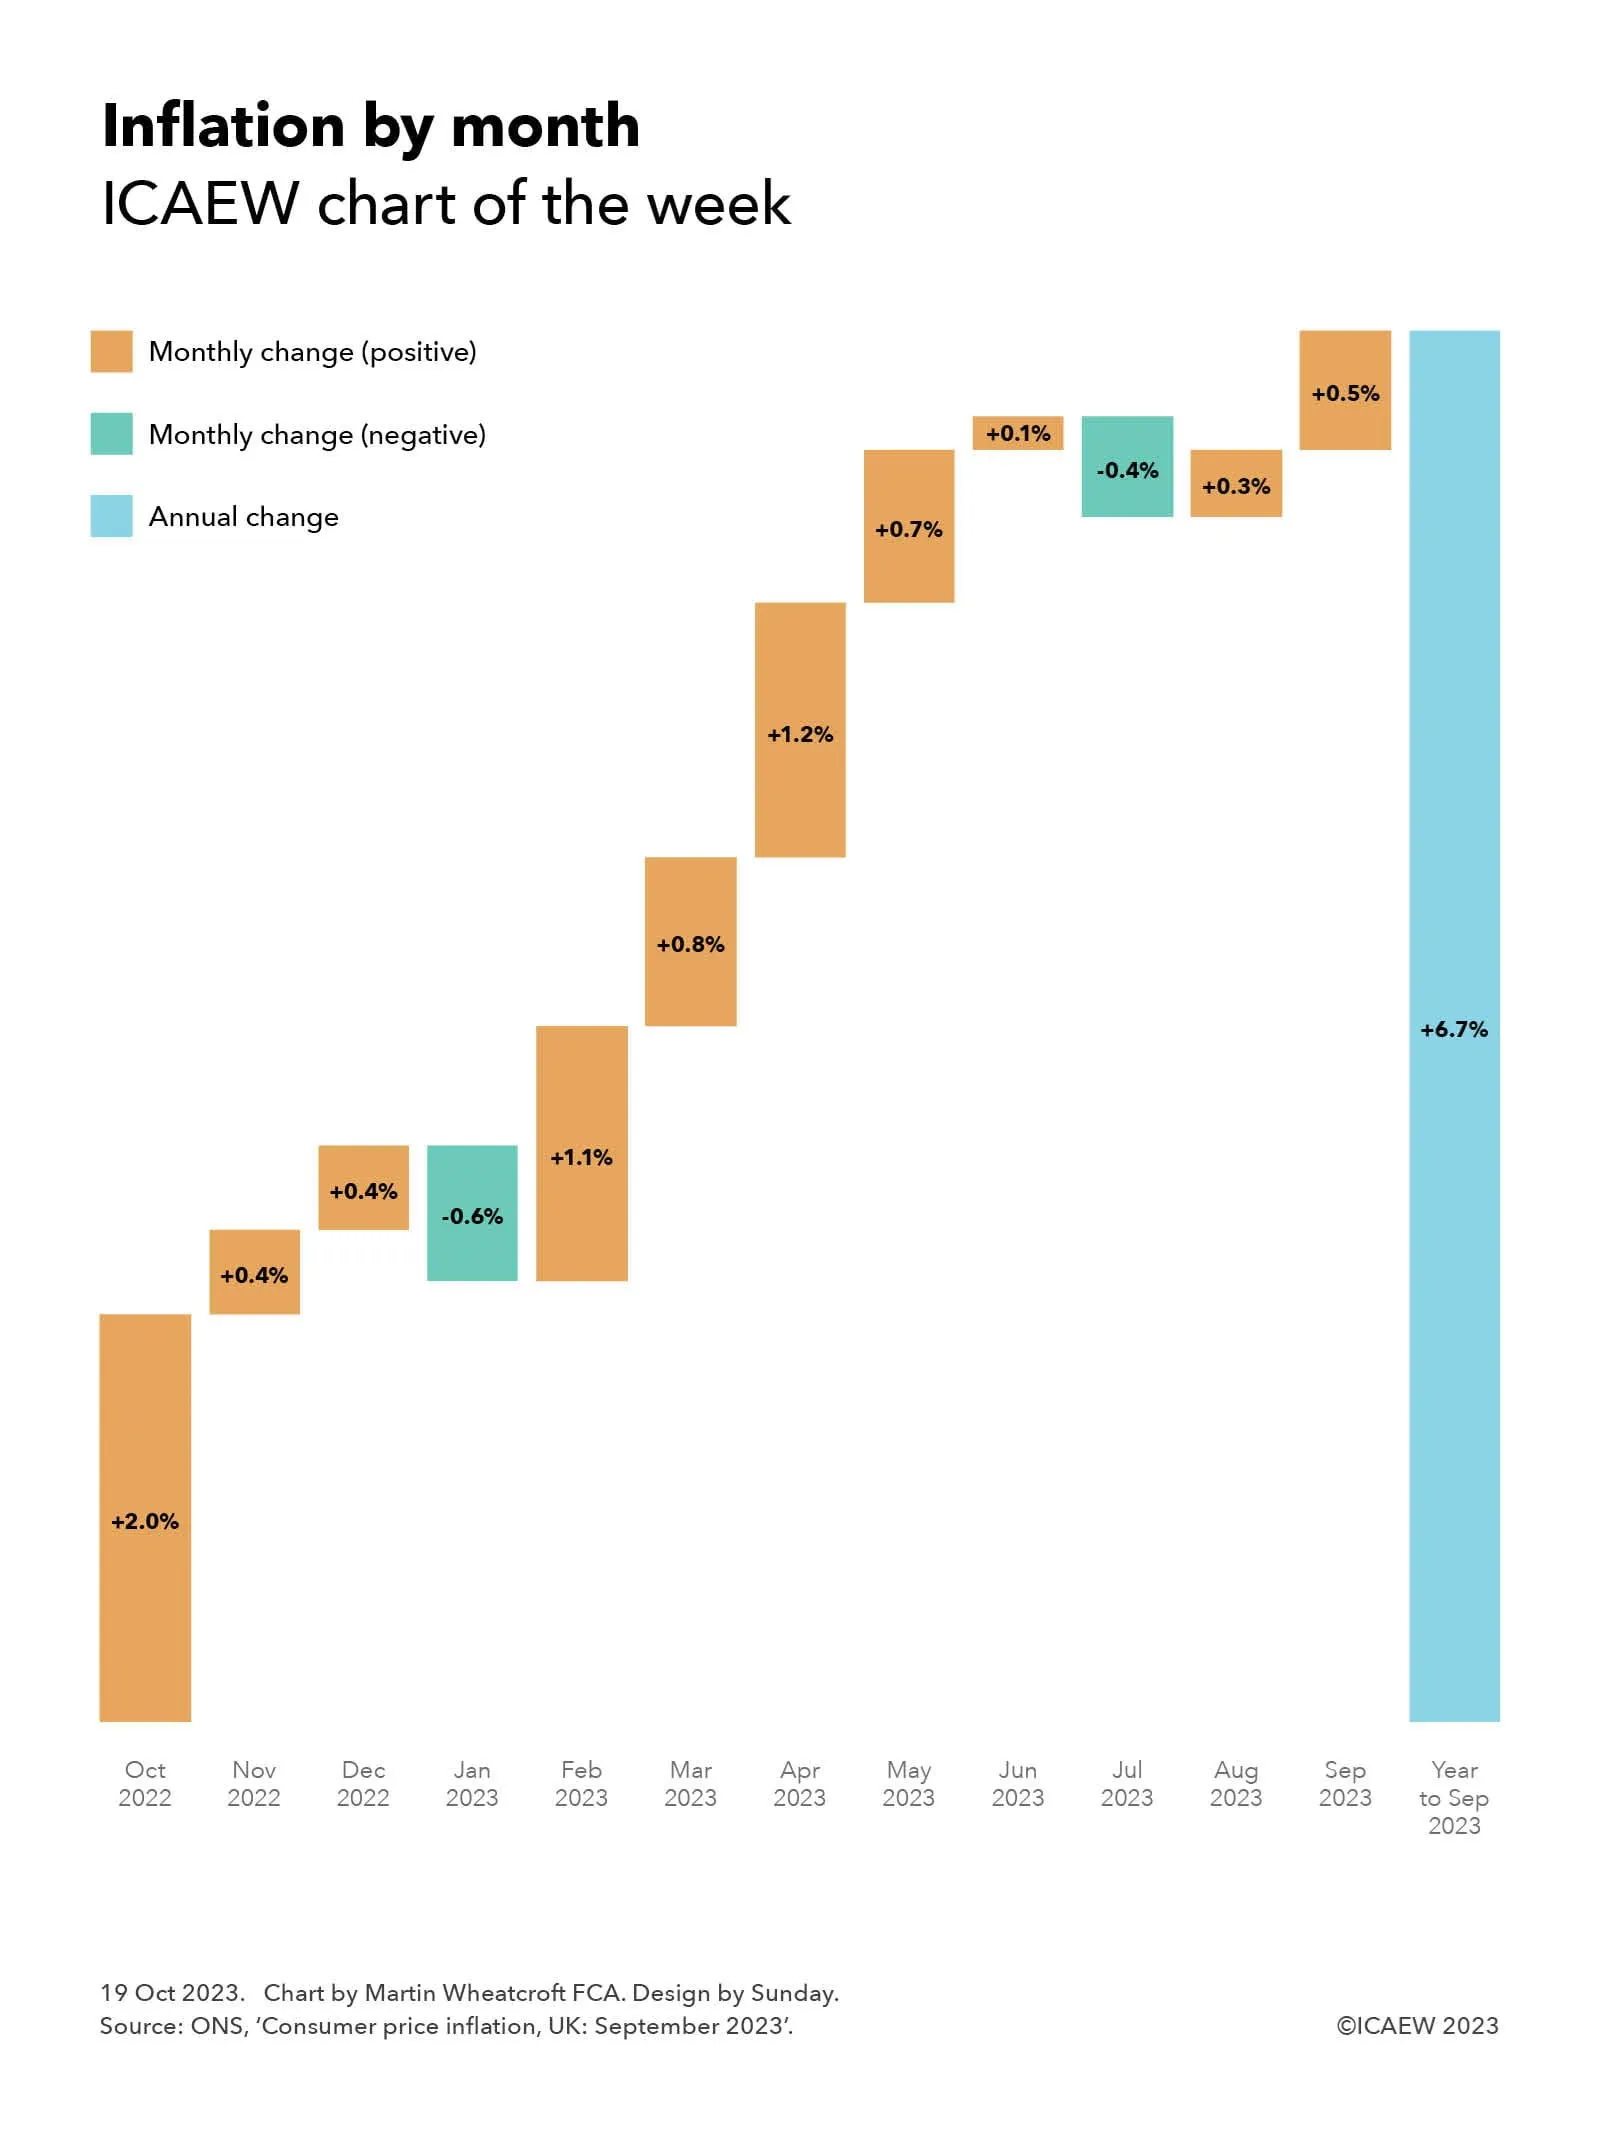
My chart this week looks at how September’s inflation rate of 6.7% is made up by month, and why a big drop in the annual rate is predicted next month.
The Office for National Statistics (ONS) reported on 18 October 2023 that the annual rate of consumer price inflation (CPI) for the year to September 2023 was 6.7%.
Our chart this week illustrates how this is made up of monthly inflation rates from October 2022 through September 2023 of +2.0%, +0.4%, +0.4%, -0.6%, +1.1%, +0.8%, +1.2%, +0.7%, +0.1%, -0.4%, +0.3% and +0.5% respectively.
As well as highlighting how the monthly inflation rate can bounce around from month to month, including a couple of times where prices went down, it shows how a big jump in the consumer prices index of +2.0% in October 2022 is a significant component in the annual rate reported for the year to September 2023.
This provides an insight into what is likely to happen to inflation when it is reported next month. Instead of a large rise in domestic energy prices (a 17% increase in the cost of electricity and a 37% increase in the cost of domestic gas between September and October 2022 according to the ONS) that drove the +2.0% reported a year ago, the expectation is that energy prices will drop between September and October 2023 following Ofgem’s decision to reduce the energy price cap by 7% for the current quarter.
When the +2.0% monthly increase from October 2022 drops out of the index to be replaced by a much smaller monthly increase for October 2023 (or even potentially a monthly decrease), the annual rate of inflation should reduce significantly – potentially to as low as the 5.3% ‘halved’ rate of inflation aspired to by the Prime Minister.
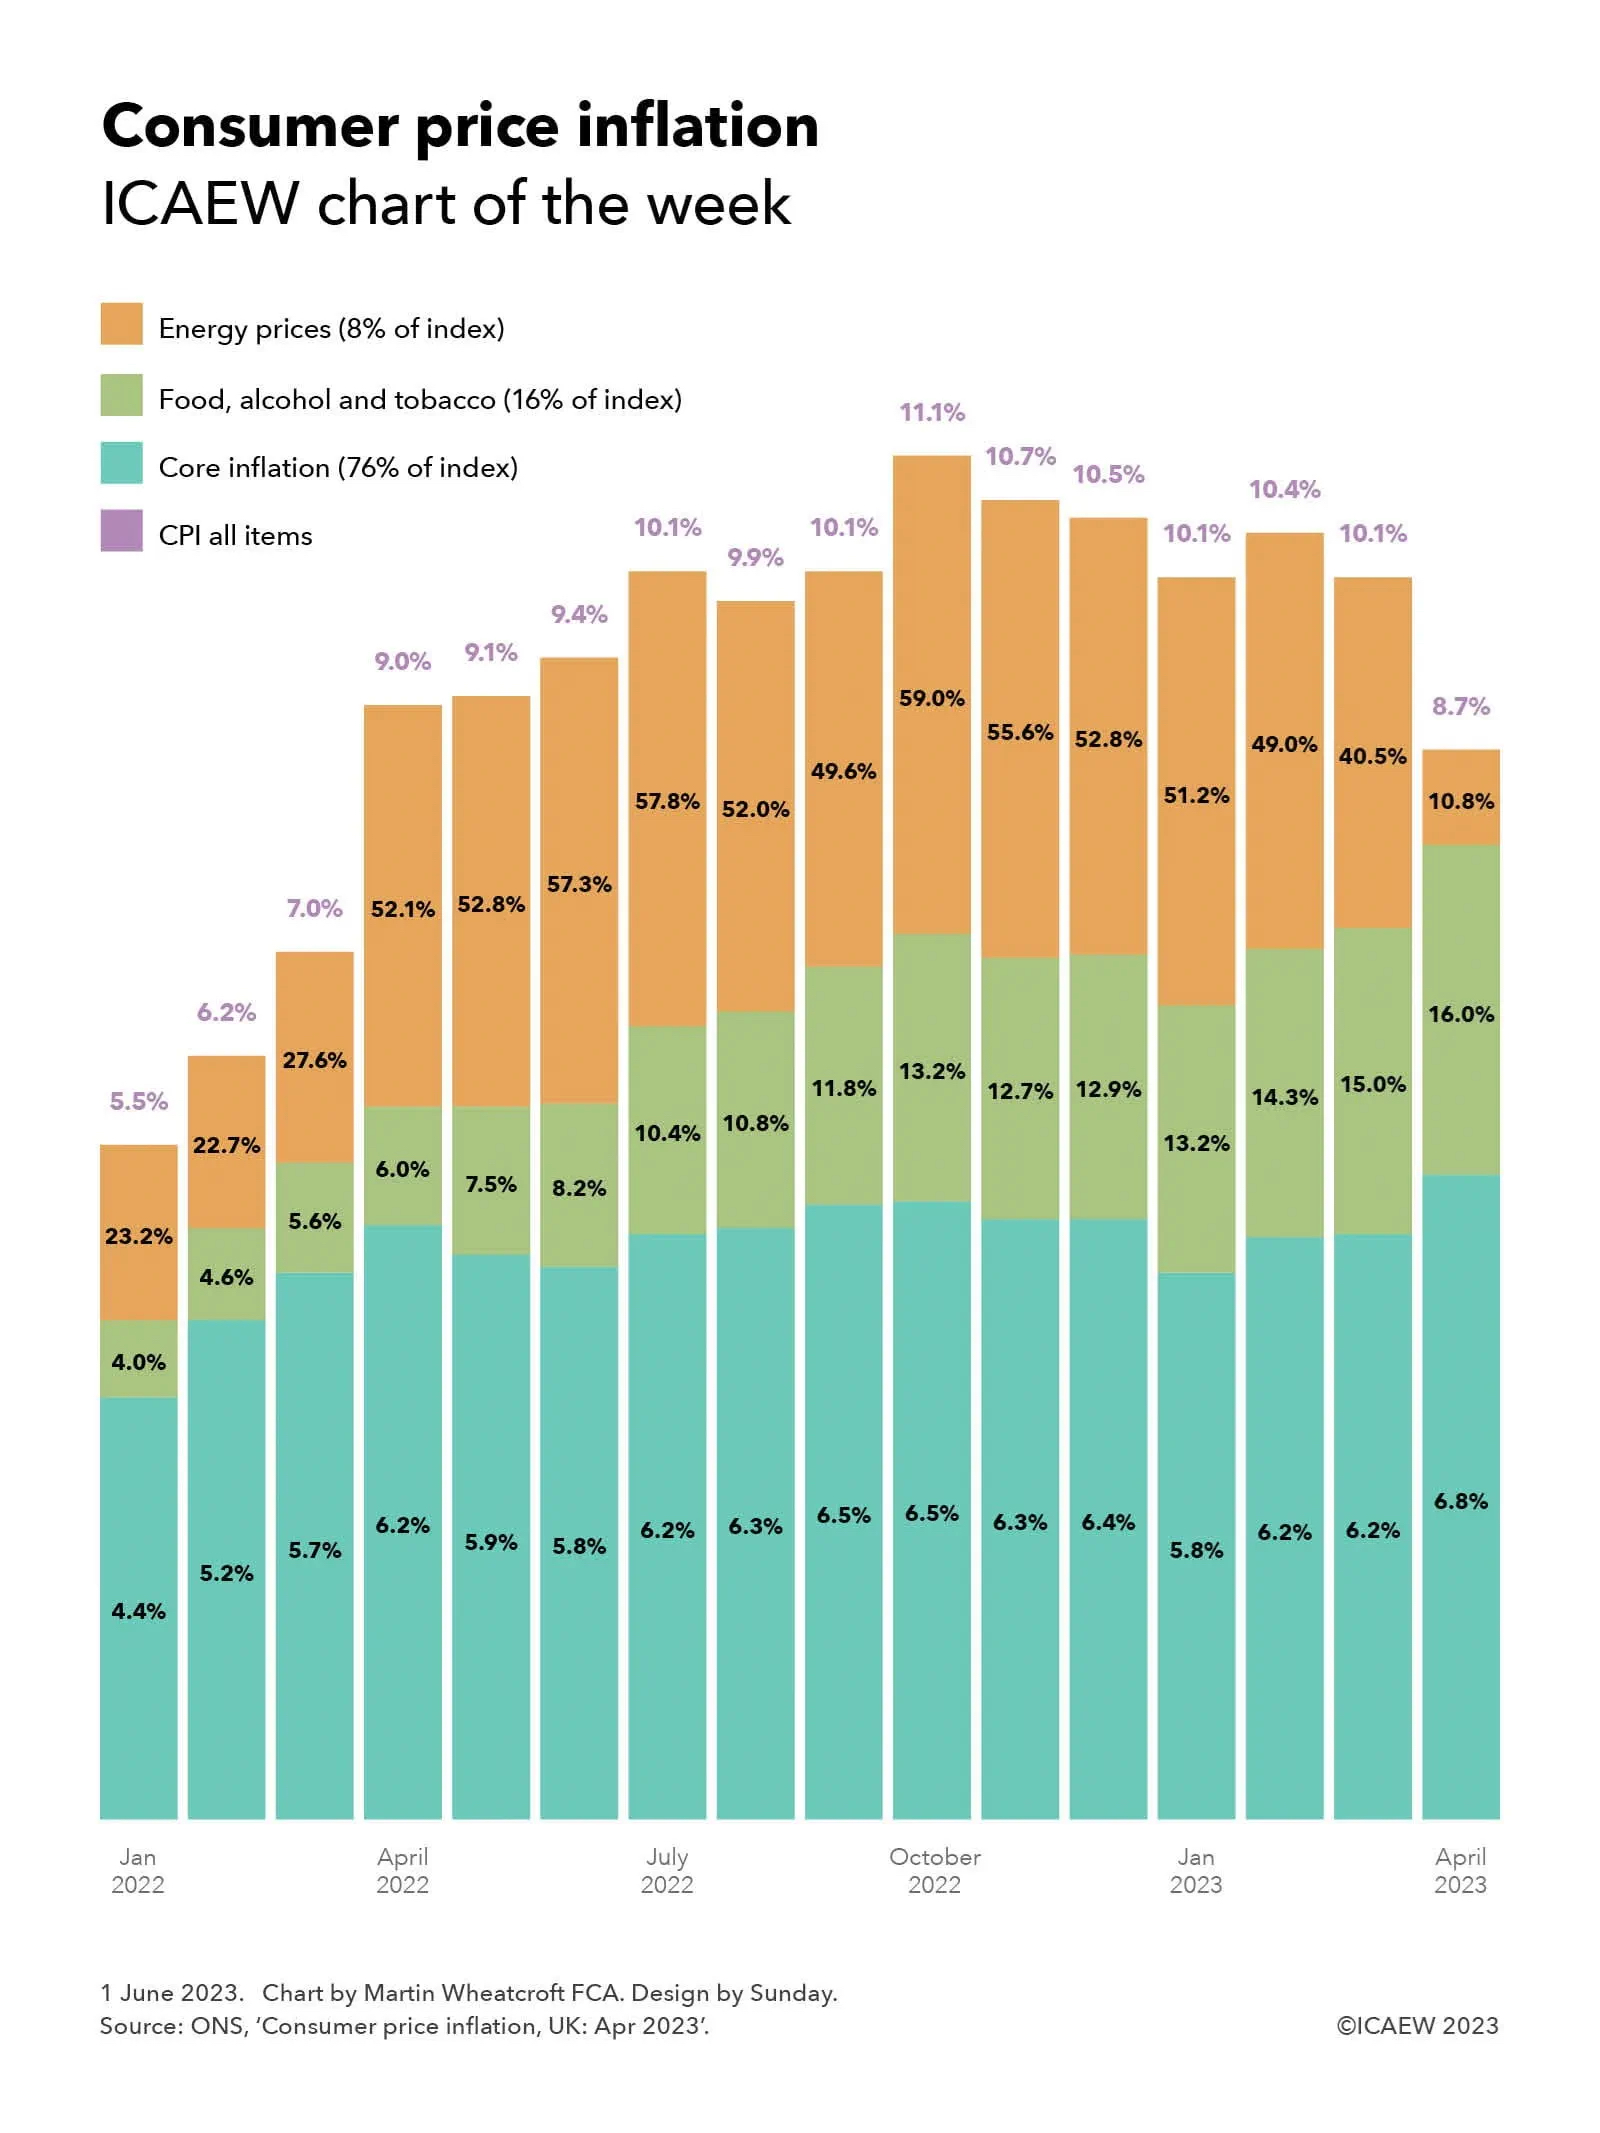
Our chart illustrates how ‘core inflation’, energy price rises, and food, alcohol and tobacco price inflation contributed to a lower than expected fall in the overall rate of inflation in April 2023.
The annual rate of consumer price inflation (CPI) fell from 10.1% in March 2023 to 8.7% in April 2023, but this fall was not considered very good news by economists, policymakers or the financial markets.
The response to April’s inflation statistics has been dramatic, with financial markets now predicting that the Bank of England could increase its base interest rate to as much as 5.5%, instead of sticking at the 4.5% rate announced in May that many commentators had previously suggested might be the peak needed to bring inflation under control.
The reasons why there are these concerns can be illustrated by our chart this week, which analyses CPI into three component sub-indices: energy price inflation, food, alcohol and tobacco, and core inflation. Our chart highlights how core inflation and the annual rate of food, alcohol and tobacco price rises both unexpectedly increased in April 2023, partially offsetting the anticipated slowdown in energy price inflation as the huge rises in domestic energy costs that took effect in April 2022 fell out of the year-on-year comparison.
Energy price inflation, comprising both domestic energy and fuels such as petrol and diesel, currently represent just 8% of the overall consumer price inflation index, but the rises over the past 15 months have been so large they have contributed significantly to the overall headline CPI rate. Annual energy price inflation in January 2022 was already high at 23.2% as the constrained energy supply drove prices high while the global economy started to recover from the pandemic. This was followed by 22.7% in February 2022 and 27.2% in the year to March 2022, before jumping to 52.1% in April 2022. The annual rate of increase in energy prices remained high over the following months rising to 52.8%, 57.3% then 57.8% in July, 52.0%, 49.6% to a peak of 59.0% in October. The rate of increase decelerated to 55.6%, 52.8% and then 51.2% in January, to 49.0% and 40.5% in February and March 2023, before dropping to 10.8% in April 2023 when compared with the higher base of April 2022.
Food, alcohol and tobacco prices represent about 16% of the CPI index and were 4.0% higher than a year previously in January 2022. Since then the annual rate of increase has gradually increased each month, to 4.6%, 5.6% and then 6.0% in April 2022, to 7.5%, 8.2% and 10.4% in July 2022, and then to 10.8%, 11.8% and 13.2% in October 2022. The annual rate of increase moderated to 12.7% and 12.9% in November and December, before returning to 13.2% in January 2023. The annual rate of price increases accelerated to 14.3% in February, 15.0% in March and to 16.0% in April.
Not shown in the chart is the sub-subindex of food and non-alcoholic beverages, which was running at 19.1% in the year to March 2023 and 19.0% in the year to April 2023, with the jump in April coming from alcohol and tobacco prices, which rose from 5.3% in March to 9.1% in April.
Perhaps more worrying than the jump in alcohol and tobacco prices is what is happening to ‘core inflation’, which is defined as CPI excluding energy, food, alcohol and tobacco. Representing just over three quarters (76%) of consumer spending, annual core inflation was running at 4.4% in January last year, rising to 5.2%, 5.7% and then 6.2% in April 2022, 5.9%, 5.8% then 6.2% in July, 6.3%, 6.5% then 6.5% in October, 6.3%, 6.4% then 5.8% in January, 6.2%, 6.2% and then 6.8% in April 2023.
By excluding more volatile components of the CPI index, core inflation is generally more stable than overall CPI. By hovering within the 5.7% to 6.5% range for the past year, the hope was that core inflation was – while pretty high – at least not out of control. The unexpected rise to 6.8% in April is worrying for the Bank of England, which is concerned that inflation could become embedded into the UK economy at a rate much higher than its 1%-3% mandated target range.
The good news is that planned cuts to domestic energy prices in July, together with other price rises last summer falling out of the year-on-year comparison, should feed through to a much lower headline rate of inflation over the next few months, reducing the pressure on wage settlements and other input costs that are currently driving up prices across the whole economy.
Despite that, the markets believe that further interest rate rises may still be necessary on top of the actions already taken by the Bank of England, potentially risking overtightening that could worsen the cost-of-living crisis and the squeeze on businesses.
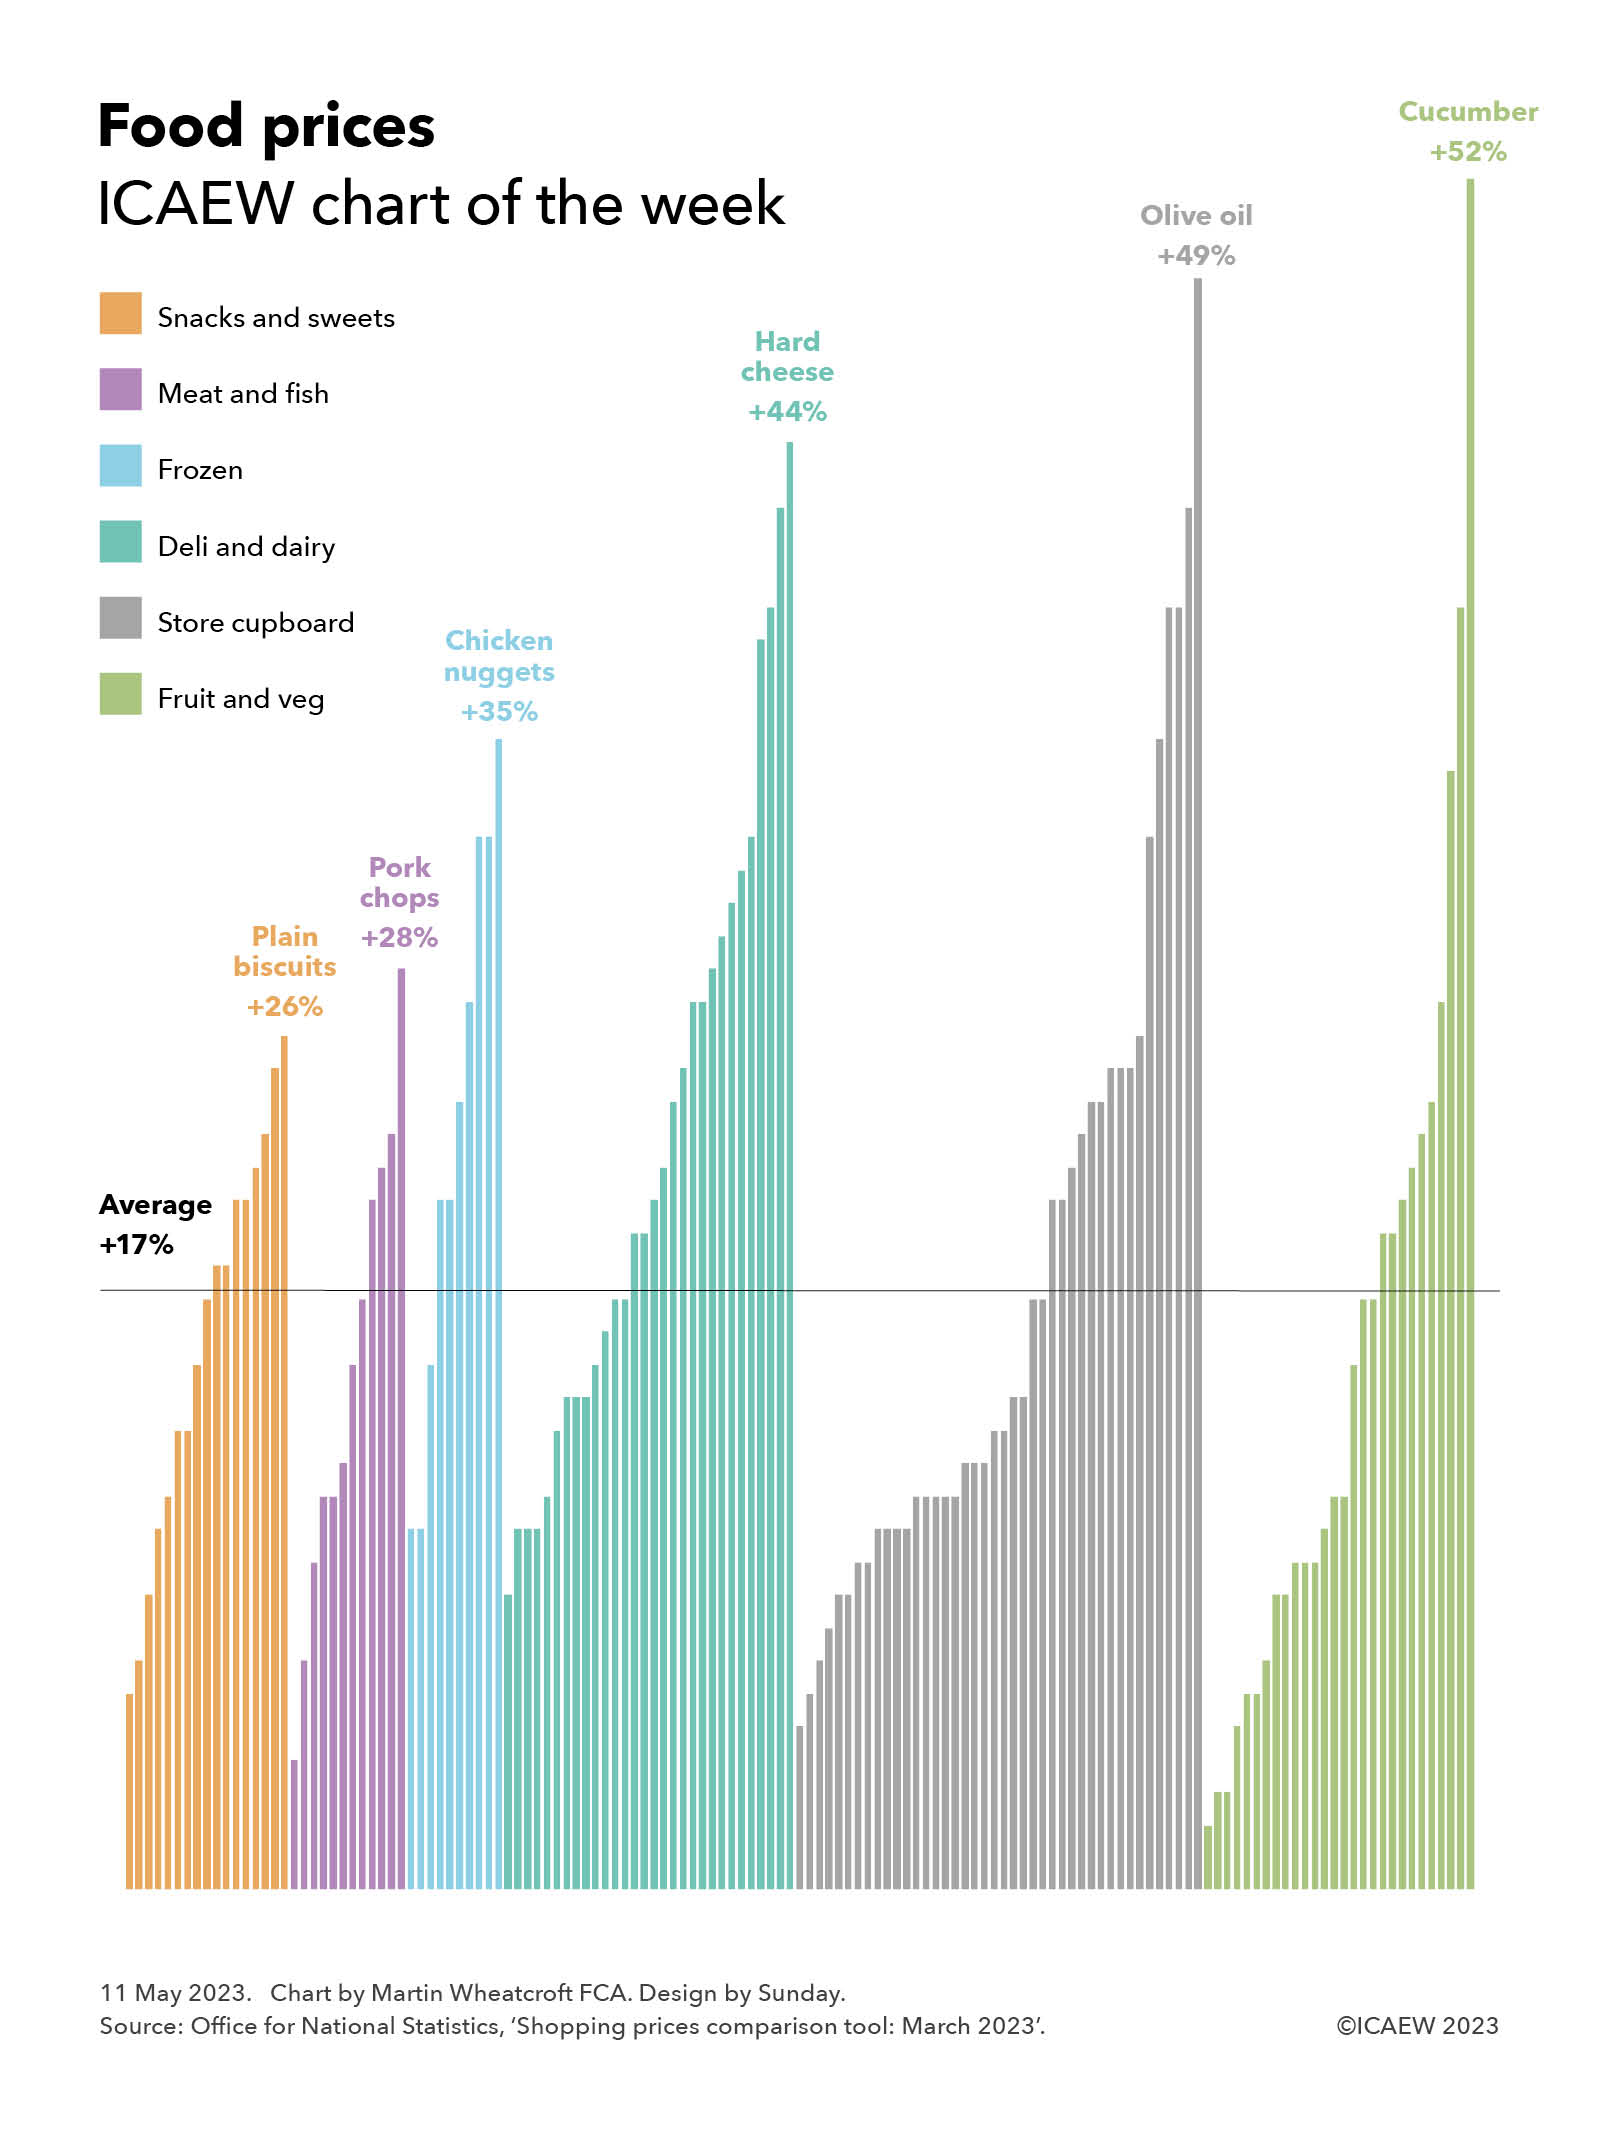
An inflation rate of 10.1% in the year to March 2023 conceals a huge variation in individual price rises, as illustrated by this week’s chart on food prices.
One of the problems in measuring inflation is that a weighted average of thousands of different prices is very different from our individual experience of inflation. Not only are we unique in terms of the basket of goods and services that we buy, but we also tend to notice some price changes more than others – making our personal experience very different from everyone else’s.
Nowhere is this more pronounced than in our regular trips to the shops to buy groceries, where we can see higher prices both on the shelves and when we come to pay at the till. This can be much more visible to us than bills paid by direct debit, for example, where money just disappears from our bank account and we need to make an effort to work out what is going on.
The Office for National Statistics has recently launched a shopping prices comparison tool that allows you to choose a basket of goods and see how retail prices have increased across different types of purchases: food and drink, clothing and footwear, restaurants and bars, health, household items, recreation and culture, services, and transport. Even there, the prices they quote are averages from many different retail outlets, specific products, and brands – and so won’t exactly match what is happening to your individual basket.
For our chart this week, we have chosen to look at food prices, choosing a basket that in total has increased by 17% over the past year, rising from £422.40 if you had bought everything on the list in March 2022 to £495.43 in March 2023. We have allocated these into six different categories to give a bit more flavour (pun intended) to what is going on.
There is a huge amount of variation between different foodstuffs, with our chart illustrating how in the snacks and sweets category the average price of 200-300g of plain biscuits has increased by 26% (from 98p to £1.24), while in meat and fish, pork loin chops have gone up by 28% (from £6.35 per kg to £8.12 per kg). In the frozen category, chicken nuggets are up 35% (from £1.79 to £2.41), while in deli and dairy, hard cheese has gone up the most on average, by 44% (from £6.92 per kg to £9.98 per kg). Olive oil tops our store cupboard classification, up 49% (from £3.87 to £5.78 on average between 500ml and 1 litre), but the king of food price inflation is the humble cucumber, up a massive 52% over a one year period from 55p to 84p each.
Not highlighted in the chart are the smallest price rises in each category, with peanuts up 5% (from £1.23 to £1.29 for 150-300g), lamb loin chop/steaks up 4% (from £15.49 to £16.13 per kg), frozen vegetable burgers up 11% (£1.99 to £2.21), sliced ham up 9% (£2.41 to £2.64 for 100-200g), low-sugar/non-chocolate breakfast up 6% (£2.08 to £2.20), and sweet potato up a mere 2% (from £1.17 to £1.19 per kg).
The Bank of England continues to tighten the screws on inflation, raising its base rate to 4.5% on 11 May 2023, and the projections are that inflation overall should start to reduce quite rapidly over the next few months.
However, as ICAEW Economies Director Suren Thiru recently said in a TV interview on BBC Breakfast, inflation is now becoming embedded into the everyday things that we buy. This makes the challenge for the Bank of England to bring inflation back down to its target range of 1% to 3% that much harder.
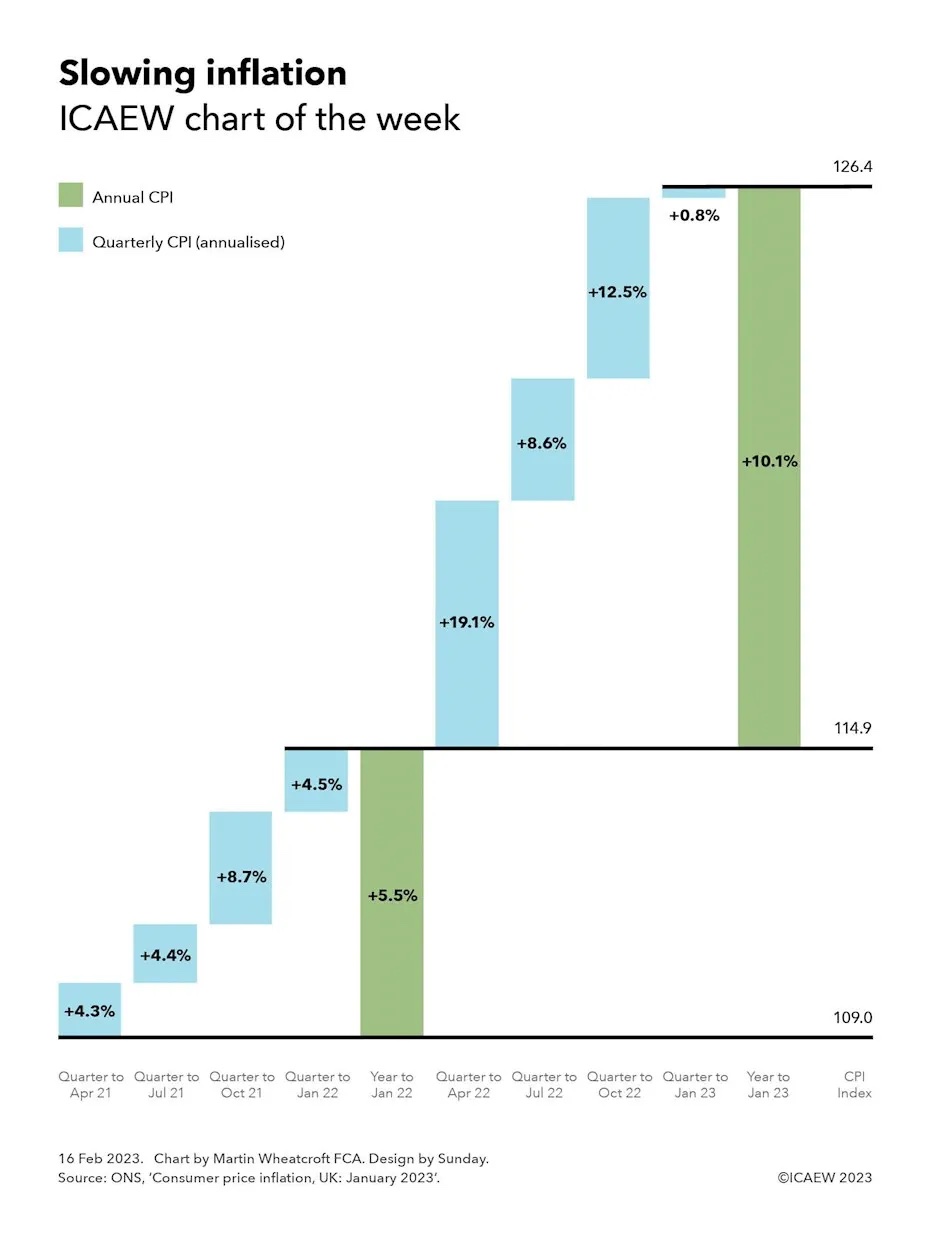
My chart this week illustrates the slowing rate of inflation and how it should fall further once a big surge in prices between February and April 2022 falls out of the year-on-year comparison.
The Office for National Statistics (ONS) reported that the annual rate of consumer price inflation (CPI) was 10.1% in January 2023, falling from 10.5% last month and down from a peak of 11.1% in October 2022, but much higher than the 5.5% annual rate of inflation for the year to January 2022.
Our chart breaks down annual inflation over the past two years to January 2023 into quarters, highlighting how inflation is likely to fall quite rapidly over the next three months as the big surge in prices following Russia’s invasion of Ukraine last year falls out of the year-on-year comparison.
Reported inflation this time last year was 5.5% for the year to January 2022. This can be broken down into quarterly rises (annualised) of 4.3% in the three months to April 2021, 4.4% in the quarter to July 2021, 8.7% in the quarter to October 2021 and 4.5% in the three months to January 2022. Inflation in that period was well above the Bank of England’s target range of 1% to 3%, as supply constraints drove prices higher as the domestic and global economies started to recover from the depths of the pandemic.
Reported inflation for the year to January 2023 of 10.1% can be broken down into quarterly rises (annualised) of 19.1% in the quarter to April 2022, 8.6% in the quarter to July 2022, 12.5% in the quarter to October 2022 and 0.8% in the three months to January 2023. The sharp jump in prices in the period from February to April 2022 was driven by a rapid rise in energy prices following Russia’s invasion of Ukraine that added to existing inflationary pressures, turbo charging the rate of inflation. Since then, prices across the economy have risen rapidly, although with wholesale energy prices retreating from their peak recently, the overall rate of price rises has slowed down significantly in the last quarter.
The chart also shows how the consumer price inflation index (the CPI Index) increased from 109.0 in January 2021 to 114.9 in January 2022 and to 126.4 in January 2023.
The chart doesn’t show the intermediate annual rates of inflation, although these can be calculated using the geometric average of the preceding four quarters. The annual rate increased from 5.5% in January 2022 to 9.0% in April 2022, then to 10.1% in July 2022 before reaching a peak of 11.1% in October 2022, following which it fell to 10.1% in January 2022.
Successively dropping quarters from the previous year out of the year-on-year comparison and replacing them with price rises over the most recent quarter saw inflation rise as quarterly rises (annualised) of 4.3% fell out to be replaced by 19.1%, 4.4% by 8.6%, and 8.7% by 12.5%, before inflation fell over the last three months as 4.5% was replaced by 0.8%.
These ‘base effects’ mean that most commentators expect a sharp slowdown in the annual inflation rate over the next nine months as monthly and quarterly price rises over that time should be much lower than the comparatives falling out of the year-on-year calculation. The biggest fall is expected over the next three months, as even with a sizeable rise in domestic energy prices expected in the month of April 2023 as government support is withdrawn, price rises are expected to be much lower than the 19.1% annualised rate seen in the quarter to April 2022.
While the medicine of higher interest rates is no doubt playing a key part in restraining prices from rising as fast as they did last year, the Bank of England knows that arithmetic should be the biggest contributor to inflation coming down over the course of 2023.
Inflation is believed to have peaked last quarter before being forecast to fall significantly over the course of 2023. We hope.
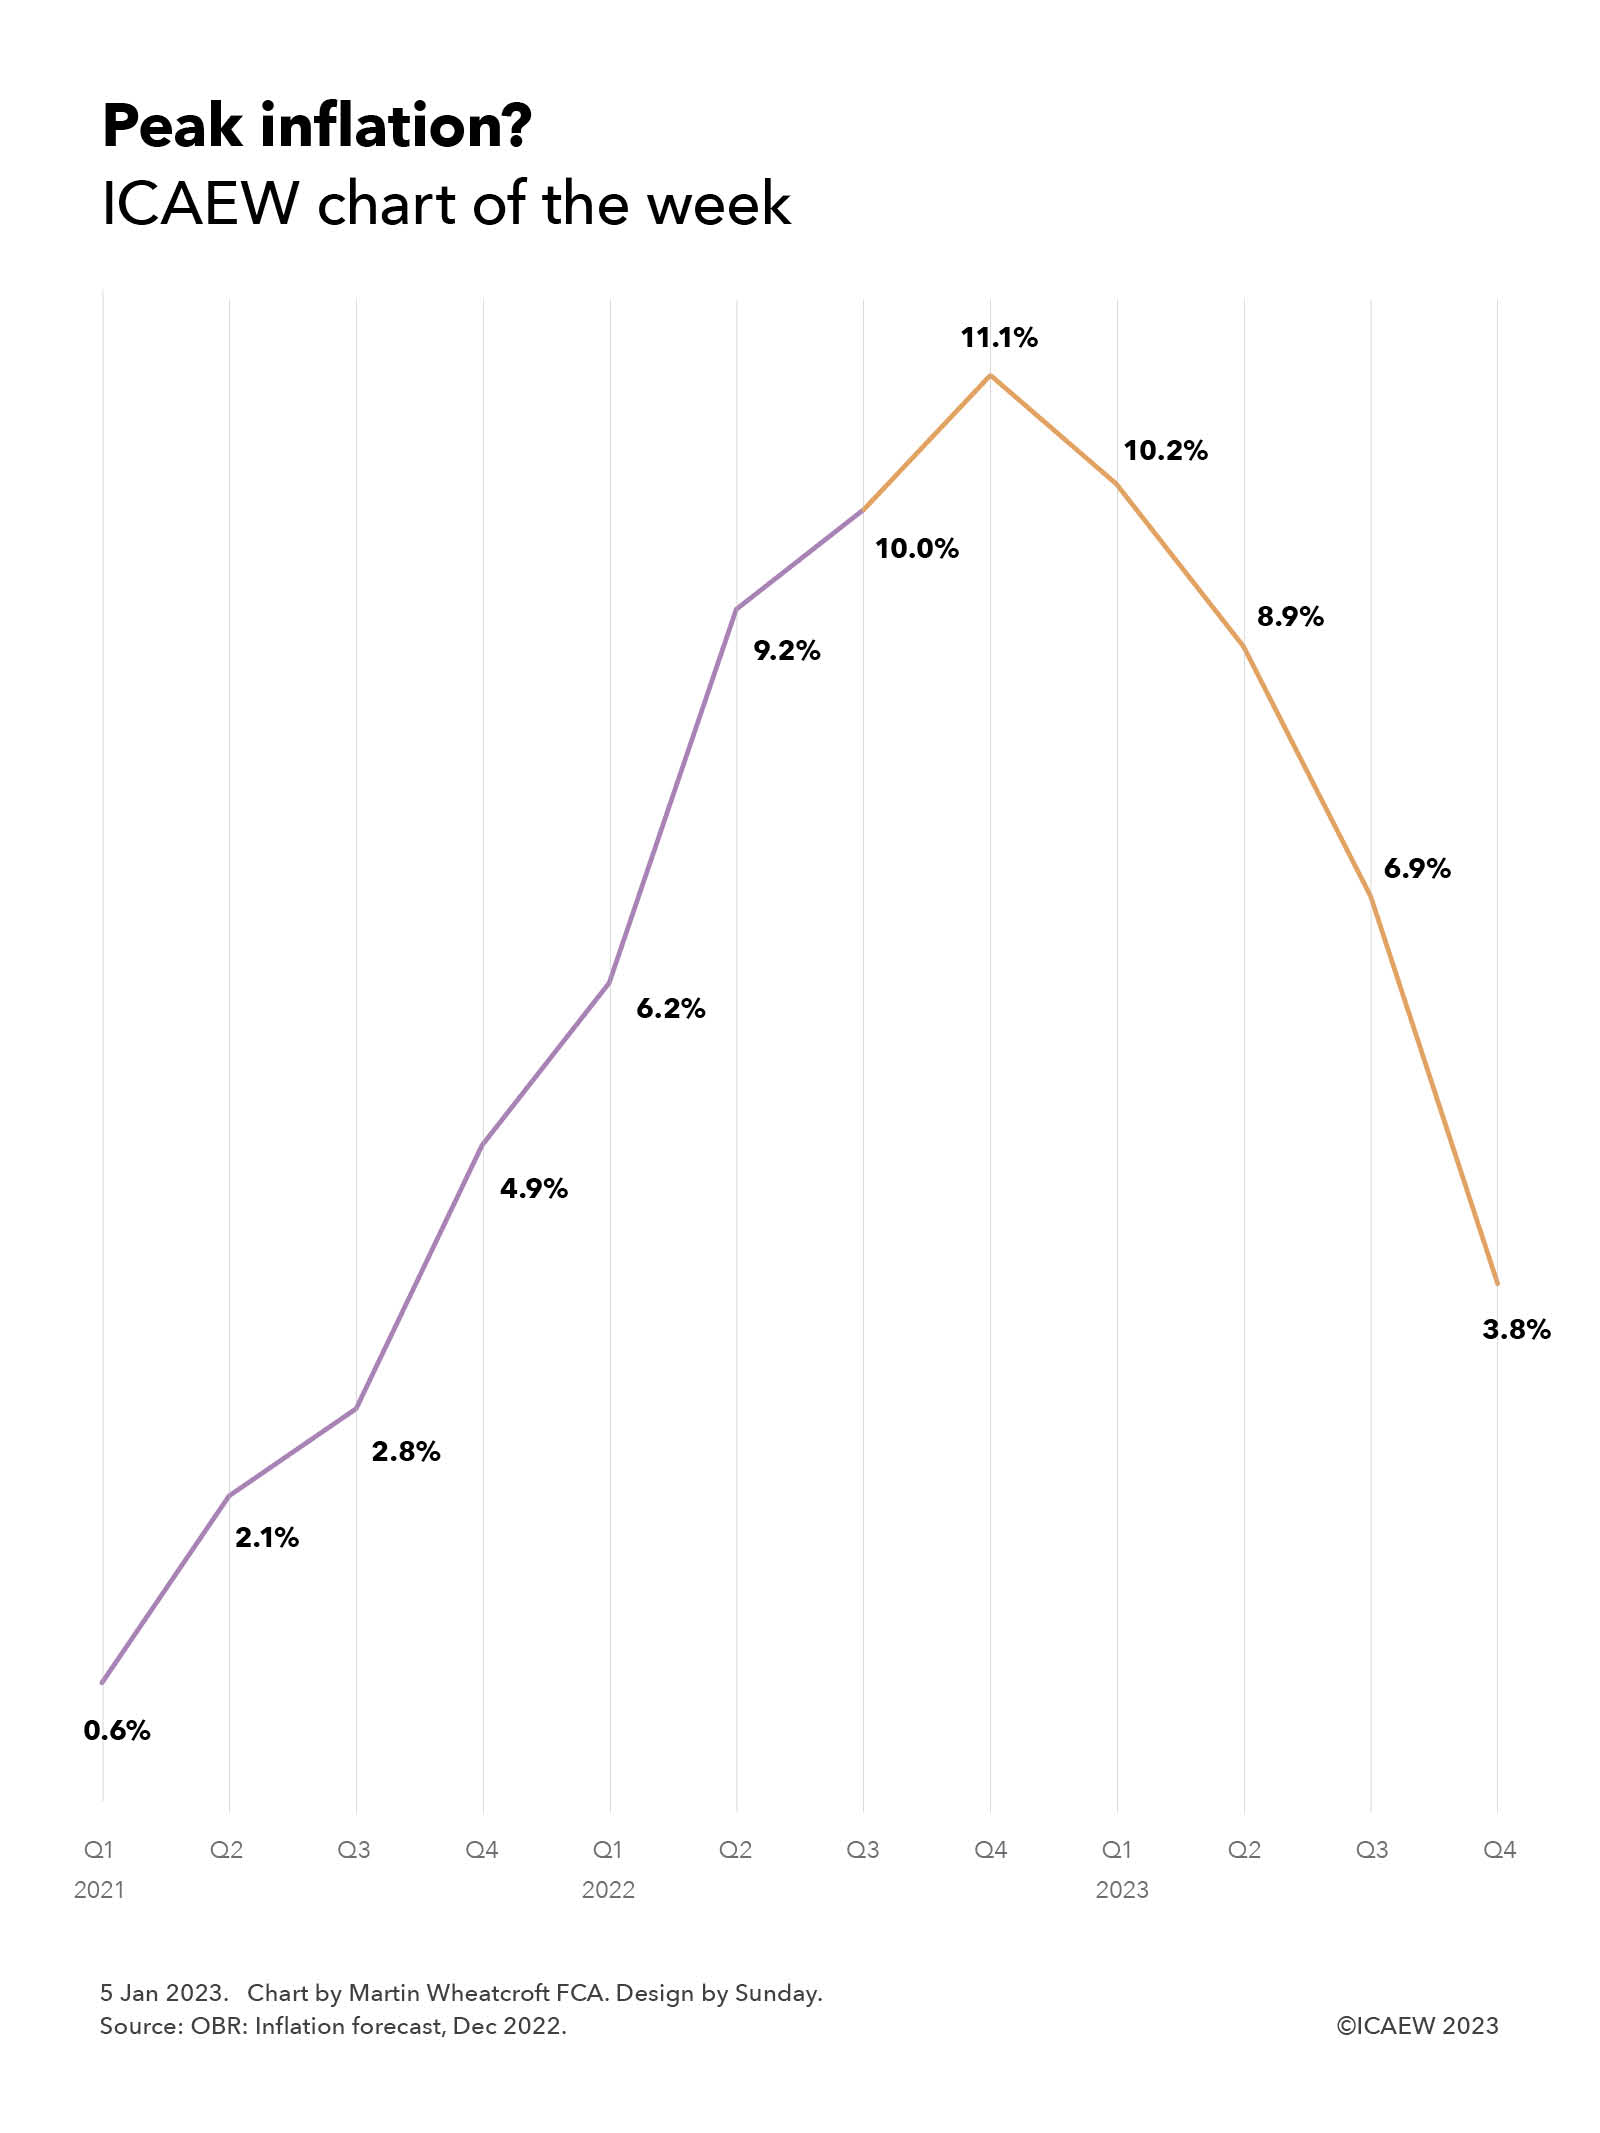
Our first chart of 2023 is on the prospects for consumer price inflation (CPI) over the course of the coming year, based on the latest forecasts for inflation from the Office for Budget Responsibility (OBR) that were released on 21 December 2022.
The OBR’s calculations suggest that CPI should come down significantly over the next four quarters to reach 3.8% by the end of the year, ‘only’ 0.8% above the Bank of England target range of 1% to 3%. The return of inflation to more moderate levels should help stabilise an economy that is currently in a pretty bad place, although it is important to understand that prices will still be rising, just at a slower pace than they have been over the course of the past year.
The chart illustrates how inflation started to rise in 2021, from a below-target 0.6% in Q1, to 2.1% in Q2, then 2.8% in Q3, before jumping to 4.9% at the end of 2021. The Russian invasion of Ukraine in the first quarter of 2022 and its consequences for global energy prices drove the inflation rate even higher, to 6.2% in Q1, 9.2% in Q2 and 10% in Q3, before rising to a forecast peak of 11.1% in Q4 of 2022. The OBR then goes on to forecast that the rate of price increases experienced by consumers will moderate in the coming year, down to 10.2% in Q1, 8.9% in Q2, 6.9% and then 3.8% in the fourth quarter of 2023.
Of course, economic forecasts of this nature are inherently uncertain, especially given the role that volatile energy prices play, both in their own right but also as a cost input to many other products and services. For consumers, the withdrawal of the Energy Price Guarantee will mean energy bills are likely to rise significantly in the second quarter despite falling wholesale prices.
The chart does not extend into 2024, when the forecasts are even more uncertain than for the current year. The OBR suggests that inflation could turn negative during 2024 (Q1: 2.5%; Q2: 0.4%; Q3: -0.2%; Q4: -0.1%) and 2025 (Q1: -0.1%; Q2: -0.6%; Q3: -1.1%; Q4: -1.3%), before heading back to target in 2026 (Q1: -1.0%; Q2: -0.4%; Q3: 0.9%; Q4: 1.2%). Deflation brings with it a whole different set of economic challenges to be faced but, fortunately, forecasts are less accurate the further into the future they go. The hope is that the Bank of England will be able to time its switch in monetary policy actions from countering inflation to countering deflation just right in order to avoid this potential outcome.
Either way, the prospect of inflation coming down over the coming year is a positive amid an otherwise very bleak economic picture for the UK as we begin 2023.
My chart this week looks at how the benchmark percentage used to determine the rise in the state pension and many welfare benefits from next April reached 10.1% in September 2022.
The ICAEW chart of the week is on consumer price inflation, illustrating how the CPI index rose from 106.1 in September 2018 to 108.5 in September 2019, 109.1 in September 2020, 112.4 in September 2021 and 123.8 in September 2022. According to the Office for National Statistics (ONS), this meant that annual consumer price inflation was 1.7%, 0.5%, 3.1% and 10.1% for each of the four years to September 2022.
The percentage increase in the consumer price inflation index to each September is an important number as it is used to uprate most welfare benefits from the following April. In addition, under the triple-lock formula that has just been recommitted to by the government, it will be used to uprate the state pension in place of the statutory requirement for a rise in line with average earnings, which in September 2022 was 5.5%.
There has been speculation that the Chancellor of the Exchequer might try to restrict the uprating of welfare benefits (other than the state pension) to below inflation in order to meet his fiscal objectives. However, there is significant political pressure not to do so during a cost-of-living crisis that means many households are already struggling to pay their bills, even before the large rise in energy prices this month.
In theory, the sharp upward slope in the index over the last year provides some hope for both consumers and the Bank of England, as price increases from a year earlier fall out of the index, at least from November onwards given the energy price guarantee that means domestic energy prices should be flat for the following six months. With petrol and diesel prices appearing to moderate, and the ‘medicine’ of higher interest rates starting to take effect, the hope is that prices will rise less rapidly than they have this year, and so cause the annual rate of inflation to fall in the first half of next year.
Having said that, if recent events have taught us anything it is that our ability to predict the future is far from perfect.
This week we look at how inflation is racing upwards across the world, with the UK reporting in April one of the highest rates of increase among developed countries.
Inflation has increased rapidly over the last year as the world has emerged from the pandemic. A recovery in demand combined with constraints in supply and transportation has driven prices, with myriad factors at play. These include the effects of lockdowns in China (the world’s largest supplier of goods), the devastation caused by the Russian invasion in Ukraine (a major food exporter to Europe, the Middle East and Africa), and the economic sanctions imposed on Russia (one of the world’s largest suppliers of oil and gas).
As the chart shows, the UK currently has – at 9% – the highest reported rate of consumer price inflation in the G7, as measured by the annual change in the consumer prices index (CPI) between April 2021 and April 2022. This compares with 8.3% in the USA, 7.4% in Germany, 6.8% in Canada, 6.0% in Italy, 4.8% in France and 2.4% in Japan.
The UK’s relatively higher rate partly reflects the big jump in energy prices in April from the rise in the domestic energy price cap, which contrasts with France, for example, where domestic energy price rises have been much lower (thanks in part to state subsidies). The UK inflation rate also hasn’t been helped by falls in the value of sterling, making imported goods and food more expensive.
Other countries shown in the chart include Russia at 17.8%, Nigeria at 16.8%, Poland at 12.4%, Brazil at 12.1%, Netherlands at 9.6%, Spain at 8.3%, India at 7.8%, Mexico at 7.7%, South Africa 5.9%, South Korea at 4.8%, Indonesia at 3.5%, Switzerland at 2.5%, Saudi Arabia at 2.3% and China at 2.1%. For most countries, the rate of inflation is substantially higher than it has been for many years, reflecting just how major a change there has been in a global economy that had become accustomed to relatively stable prices in recent years.
This is not the case for every country, and the chart excludes three hyperinflationary countries that already had problems with inflation even before the pandemic, led by Venezuela with an inflation rate of 222.3% in April, Turkey with a rate of 70%, and Argentina at 58%.
Policymakers have been alarmed at the prospect of an inflationary cycle as higher prices start to drive higher wages, which in turn will drive even higher prices. For central banks that has meant increasing interest rates to try and dampen demand, while finance ministries have been looking to see how they can protect households from the effect of rising prices, particular on energy, whether that be by intervention to constrain prices, through temporary tax cuts, or through direct or indirect financial support to struggling households.
Here in the UK, both the Bank of England and HM Treasury have been calling for restraint in wage settlements as they seek to head off a further ramp-up in inflation. They hope that inflation will start to moderate later in the year as price rises in the last six months start to drop out of the year-on-year comparison and supply constraints start to ease, for example as oil and gas production is ramped up in the USA, the Middle East and elsewhere to replace Russia as an energy supplier, and as China emerges from its lockdowns.
Despite that, prices are likely to rise further, especially in October when the energy price cap is expected to increase by 40%, following a 54% rise in April. This is likely to force many to make difficult choices as household budgets come under increasing strain.
After all, inflation is much more than the rate of change in an arbitrary index; it has an impact in the real world of diminishing spending power and in eroding the value of savings.
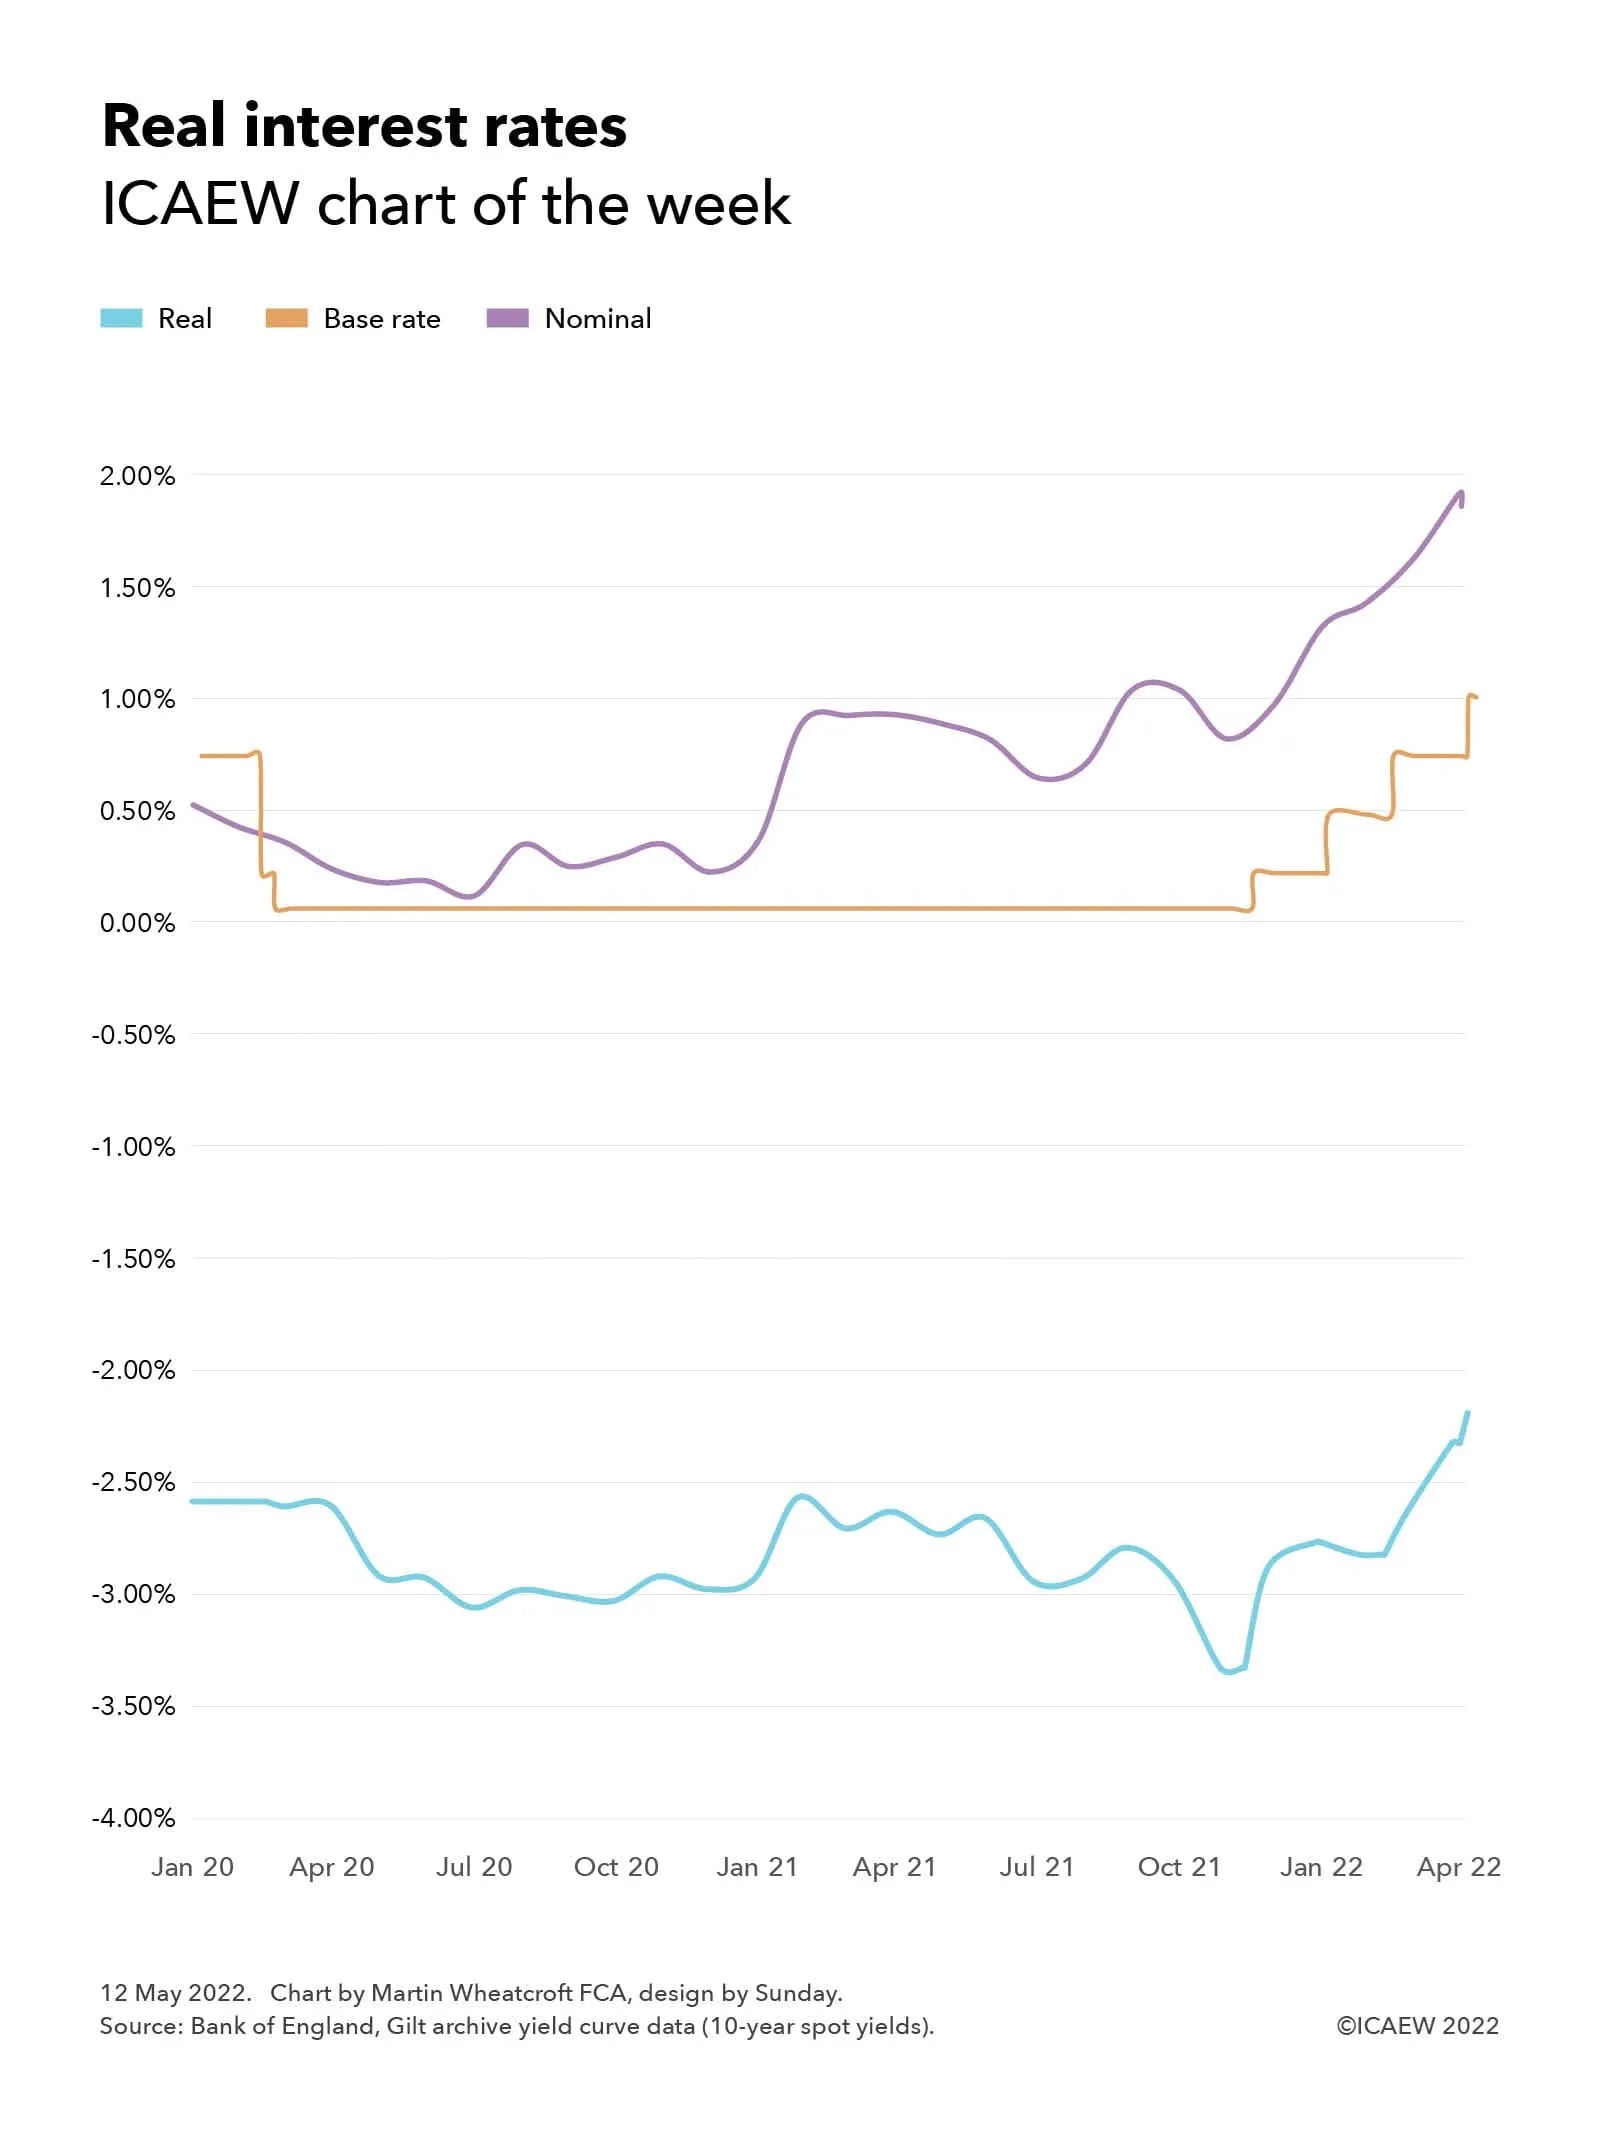
The ICAEW chart of the week looks at how real interest rates – net of inflation – remain stubbornly negative despite recent increases in the Bank of England base rate.
A feature of the economy since the financial crisis has been negative real interest rates, with the Bank of England reporting a -2.33% implied spot yield on 10-year government gilts as of 30 April 2022. This compares with a base rate of 0.75% on that day (since raised to 1%) and a nominal yield of +1.9%. With further increases in interest rates likely as the Bank of England seeks to bring inflation under control it is possible that real interest rates will become less negative over the next few months, at least assuming inflation peaks and doesn’t accelerate out of control.
Negative real interest rates are generally considered to be stimulative to the economy, reflecting the monetary policy support that the Bank of England has been providing since the financial crisis almost a decade and a half ago. Economic theory suggests that this should encourage spending and investment, as the nominal interest earned on savings will not be sufficient to offset the erosion in the value of money as prices rise over time.
The chart highlights how real interest rates were -2.59% in January 2020, before falling to almost -3.08% in June 2020 and bouncing around between -2.50% and -3.00% until November 2021 when they fell to -3.33%. They have since increased to -2.33% in April and to -2.20% as of 10 May 2022. Over that same period, nominal interest rates similarly based on government bond yields have fallen from 0.53% in January 2020 to 0.13% in July 2020 before increasing to between 0.3% and 0.4% until January 2021 after which they bounced between 0.8% and 1.0% until December 2021 since when rates have gradually increased to 1.92% on 30 April 2022, falling slightly to 1.86% on 10 May 2022. During this time, the Bank of England base rate was reduced from 0.75% in January 2020, to 0.25% and then 0.10% in March 2020 where it stayed until increasing to 0.25% in December 2021, to 0.50% in February 2022 to 0.75% in March 2022 and to 1.00% in May 2022.
The yields used in the chart are only one way of measuring real and nominal interest rates, and it is important to note that the former depend on the inflation expectations of market participants at particular points in time, which are not the same as the actual rates of inflation that are or will be experienced.
The challenge for the Bank of England over the next few months in tackling the current surge in inflation is how to take away the economic stimulus theoretically provided by negative real interest rates without causing a collapse in asset prices and a potential recession. A series of tough calls for even the most hardened policy makers.
My chart this week looks at how price rises have accelerated over the last few months, with consumer price inflation reaching 4.2% in October, the highest it has been for a decade.
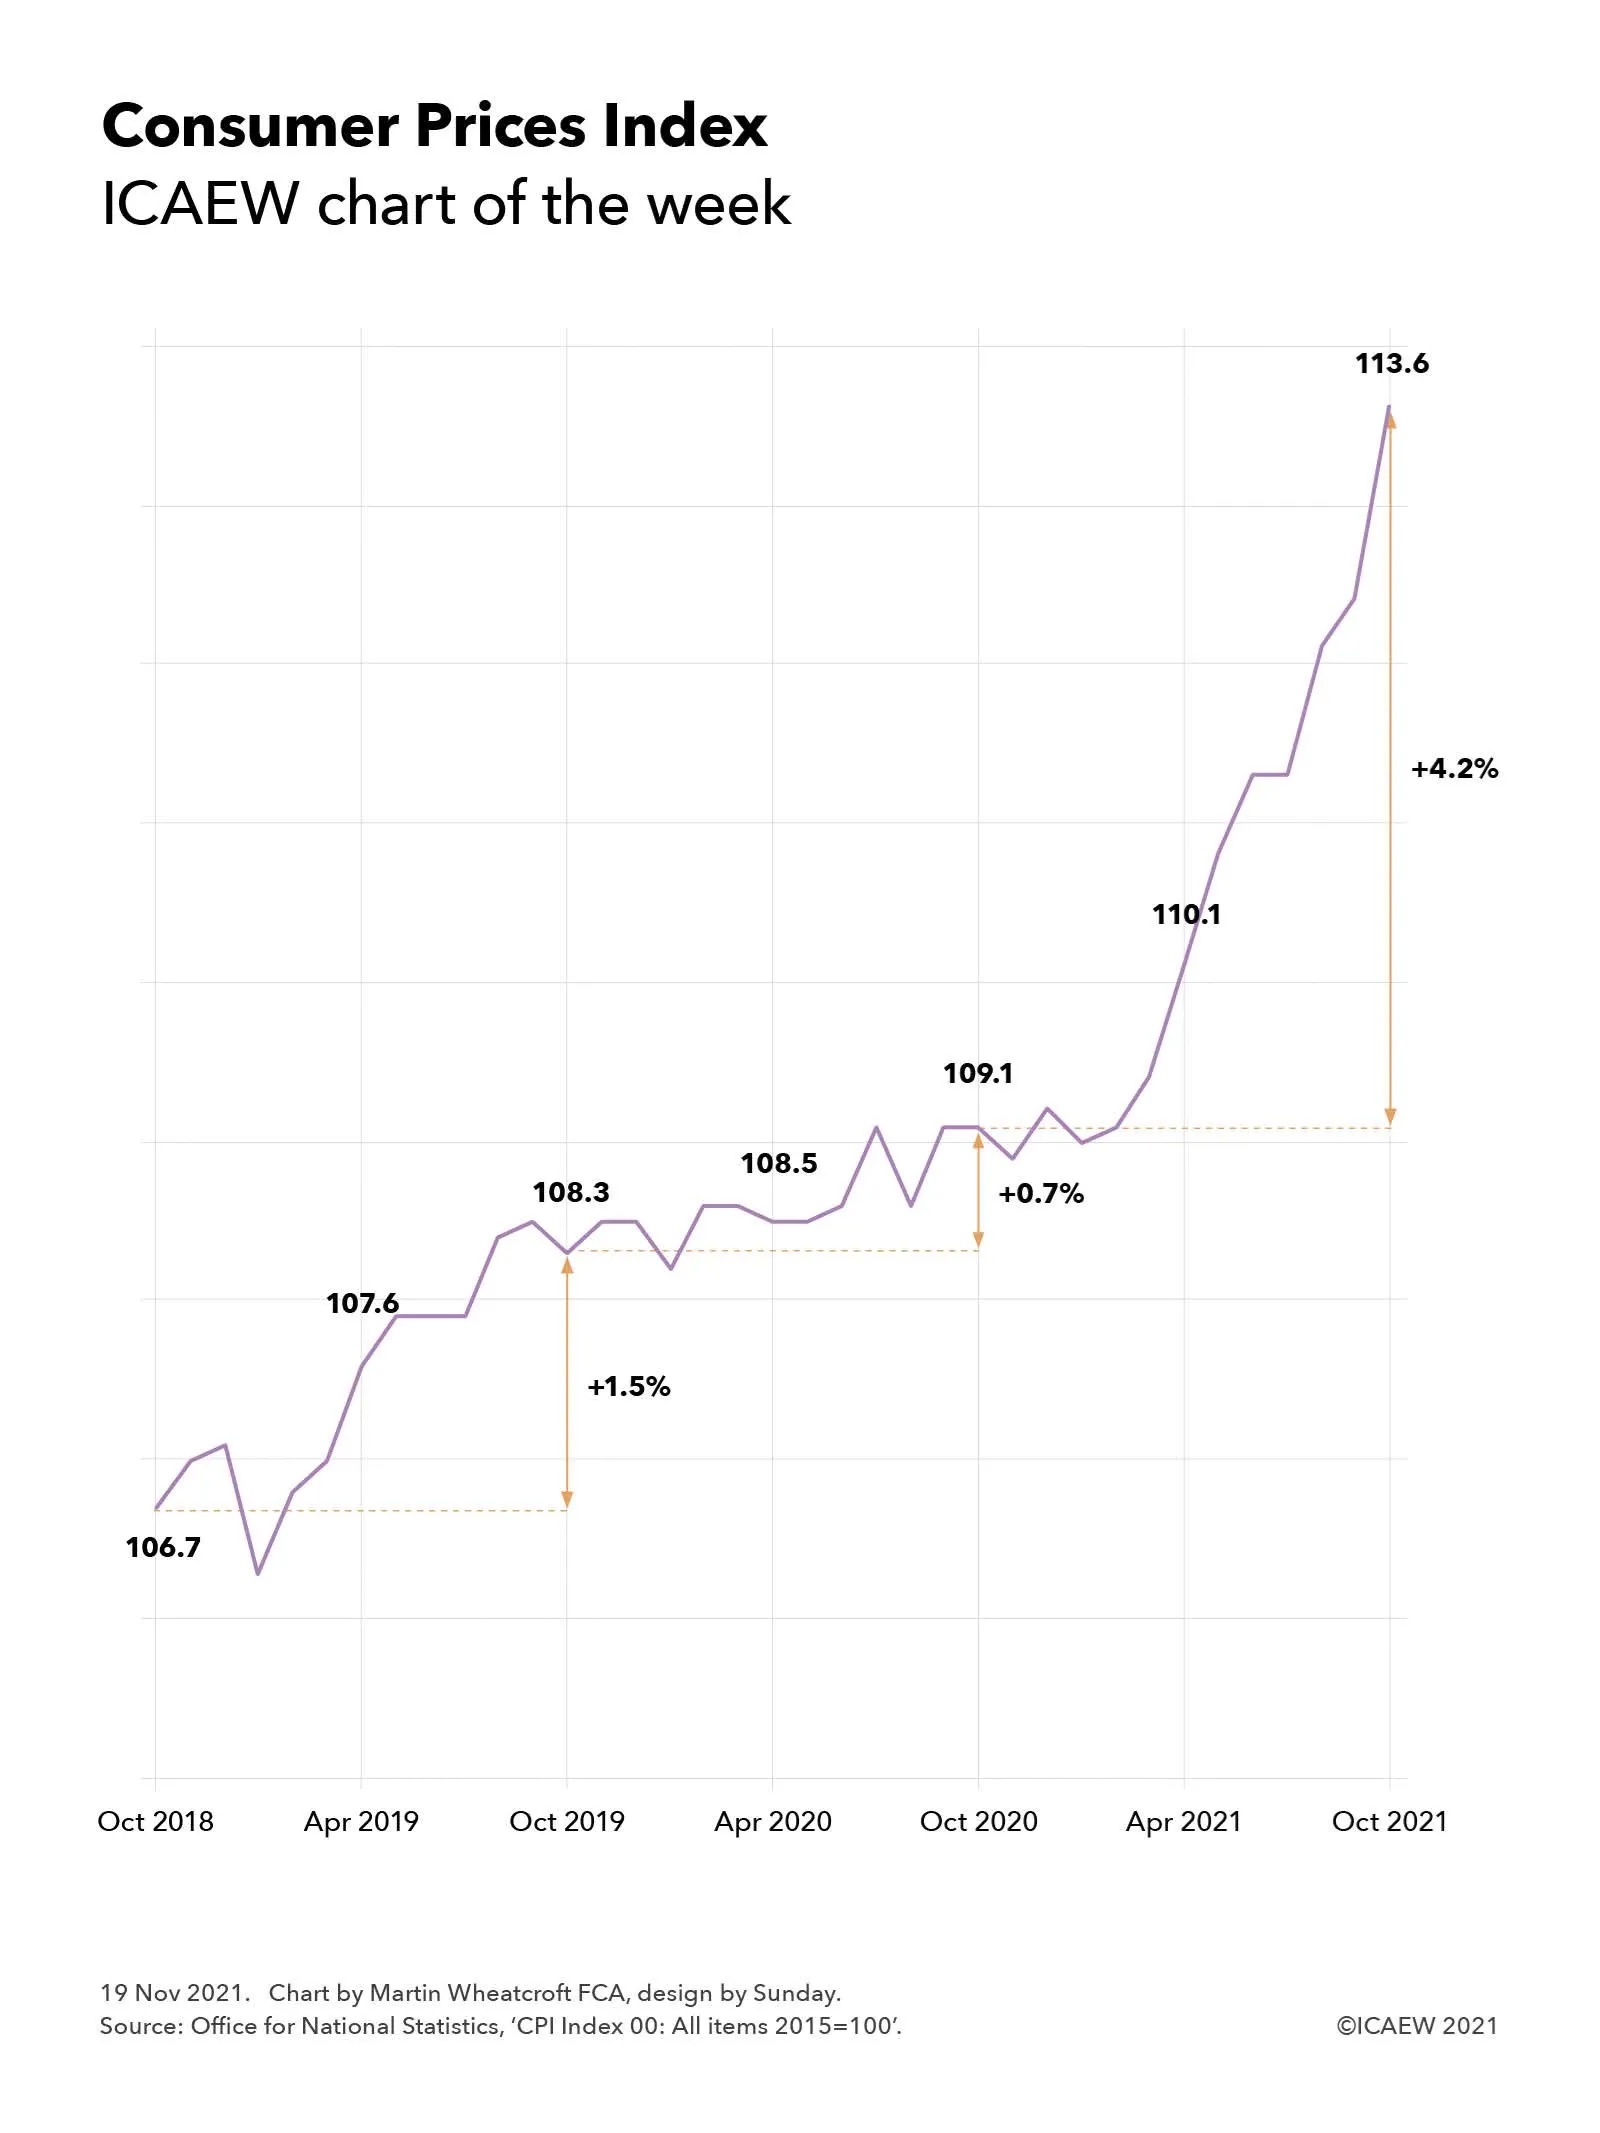
The Office for National Statistics published its latest estimates for inflation on Wednesday 17 November, reporting a 12-month increase in the Consumer Prices Index (CPI) of 4.2% and a 12-month increase in the Consumer Prices Index including owner occupiers’ house costs (CPIH) of 3.8%, both of which are the highest they have been since November 2011 when CPI was 4.8% and CPIH was 4.1%.
CPI and CPIH are calculated using a basket of goods and services to assess the level of inflation experienced by consumers, with the current index set to 100 in July 2015.
The ICAEW chart of the week shows how CPI fell before increasing from 106.7 in October 2018 to 107.6 in April 2019 and 108.3 in October 2019, an annual increase of 1.5% that was within the 1% to 3% Bank of England target range. This was followed by smaller increases to 108.3 in April 2020 and 109.1 in October 2020, a 0.7% annual increase in CPI driven in part by the pandemic. The index hovered around that level for several months until starting to increase more rapidly from March onwards as the economy started to re-open, reaching 110.1 in April 2021 and continuing to increase sharply to 113.6 in October 2021, an annual increase of 4.2%.
The Governor of the Bank of England is required to write to the Chancellor of the Bank of England whenever inflation is more than 1% above or below the 2% target and he did so on 23 September when inflation reached 3.2% and he will again now that it has reached 4.2%. Part of the explanation he has given and will give are ‘base effects’, where price discounting during 2020 at the height of the first and second waves of the pandemic suppressed some of the inflation that is being experienced now.
Further letters are likely over the next few months as even if prices don’t rise any further, given how the index bounced around the 109 level between September and March 2021. This means inflation should continue to stay substantially above 3% for the next four months or so unless prices were to fall again, which is unlikely given how global commodities and supply constraints continue to feed into rising domestic prices. A 12-month CPI-inflation rate of 5% appears more than likely at some point in the next few months.
The Bank of England’s Monetary Policy Committee (MPC) isn’t panicking at this stage given that the annualised rate of inflation over the last three years (comparing October 2021 with October 2018) is an almost on-target 2.1% and their expectation that inflation rate will come down once the flat inflationary period of a year ago starts to drop out of the comparison. However, they are sufficiently concerned about the steep slope in the CPI in the last few months to signal that interest rates may need to rise if prices continue to increase at the pace seen in recent months.
The MPC’s original plan was to hang tight through what they hoped would be a short inflationary spurt as the economy emerges from the pandemic. In the event it looks like they won’t be able to hold that line, with higher interest rates a distinct possibility in the coming months.
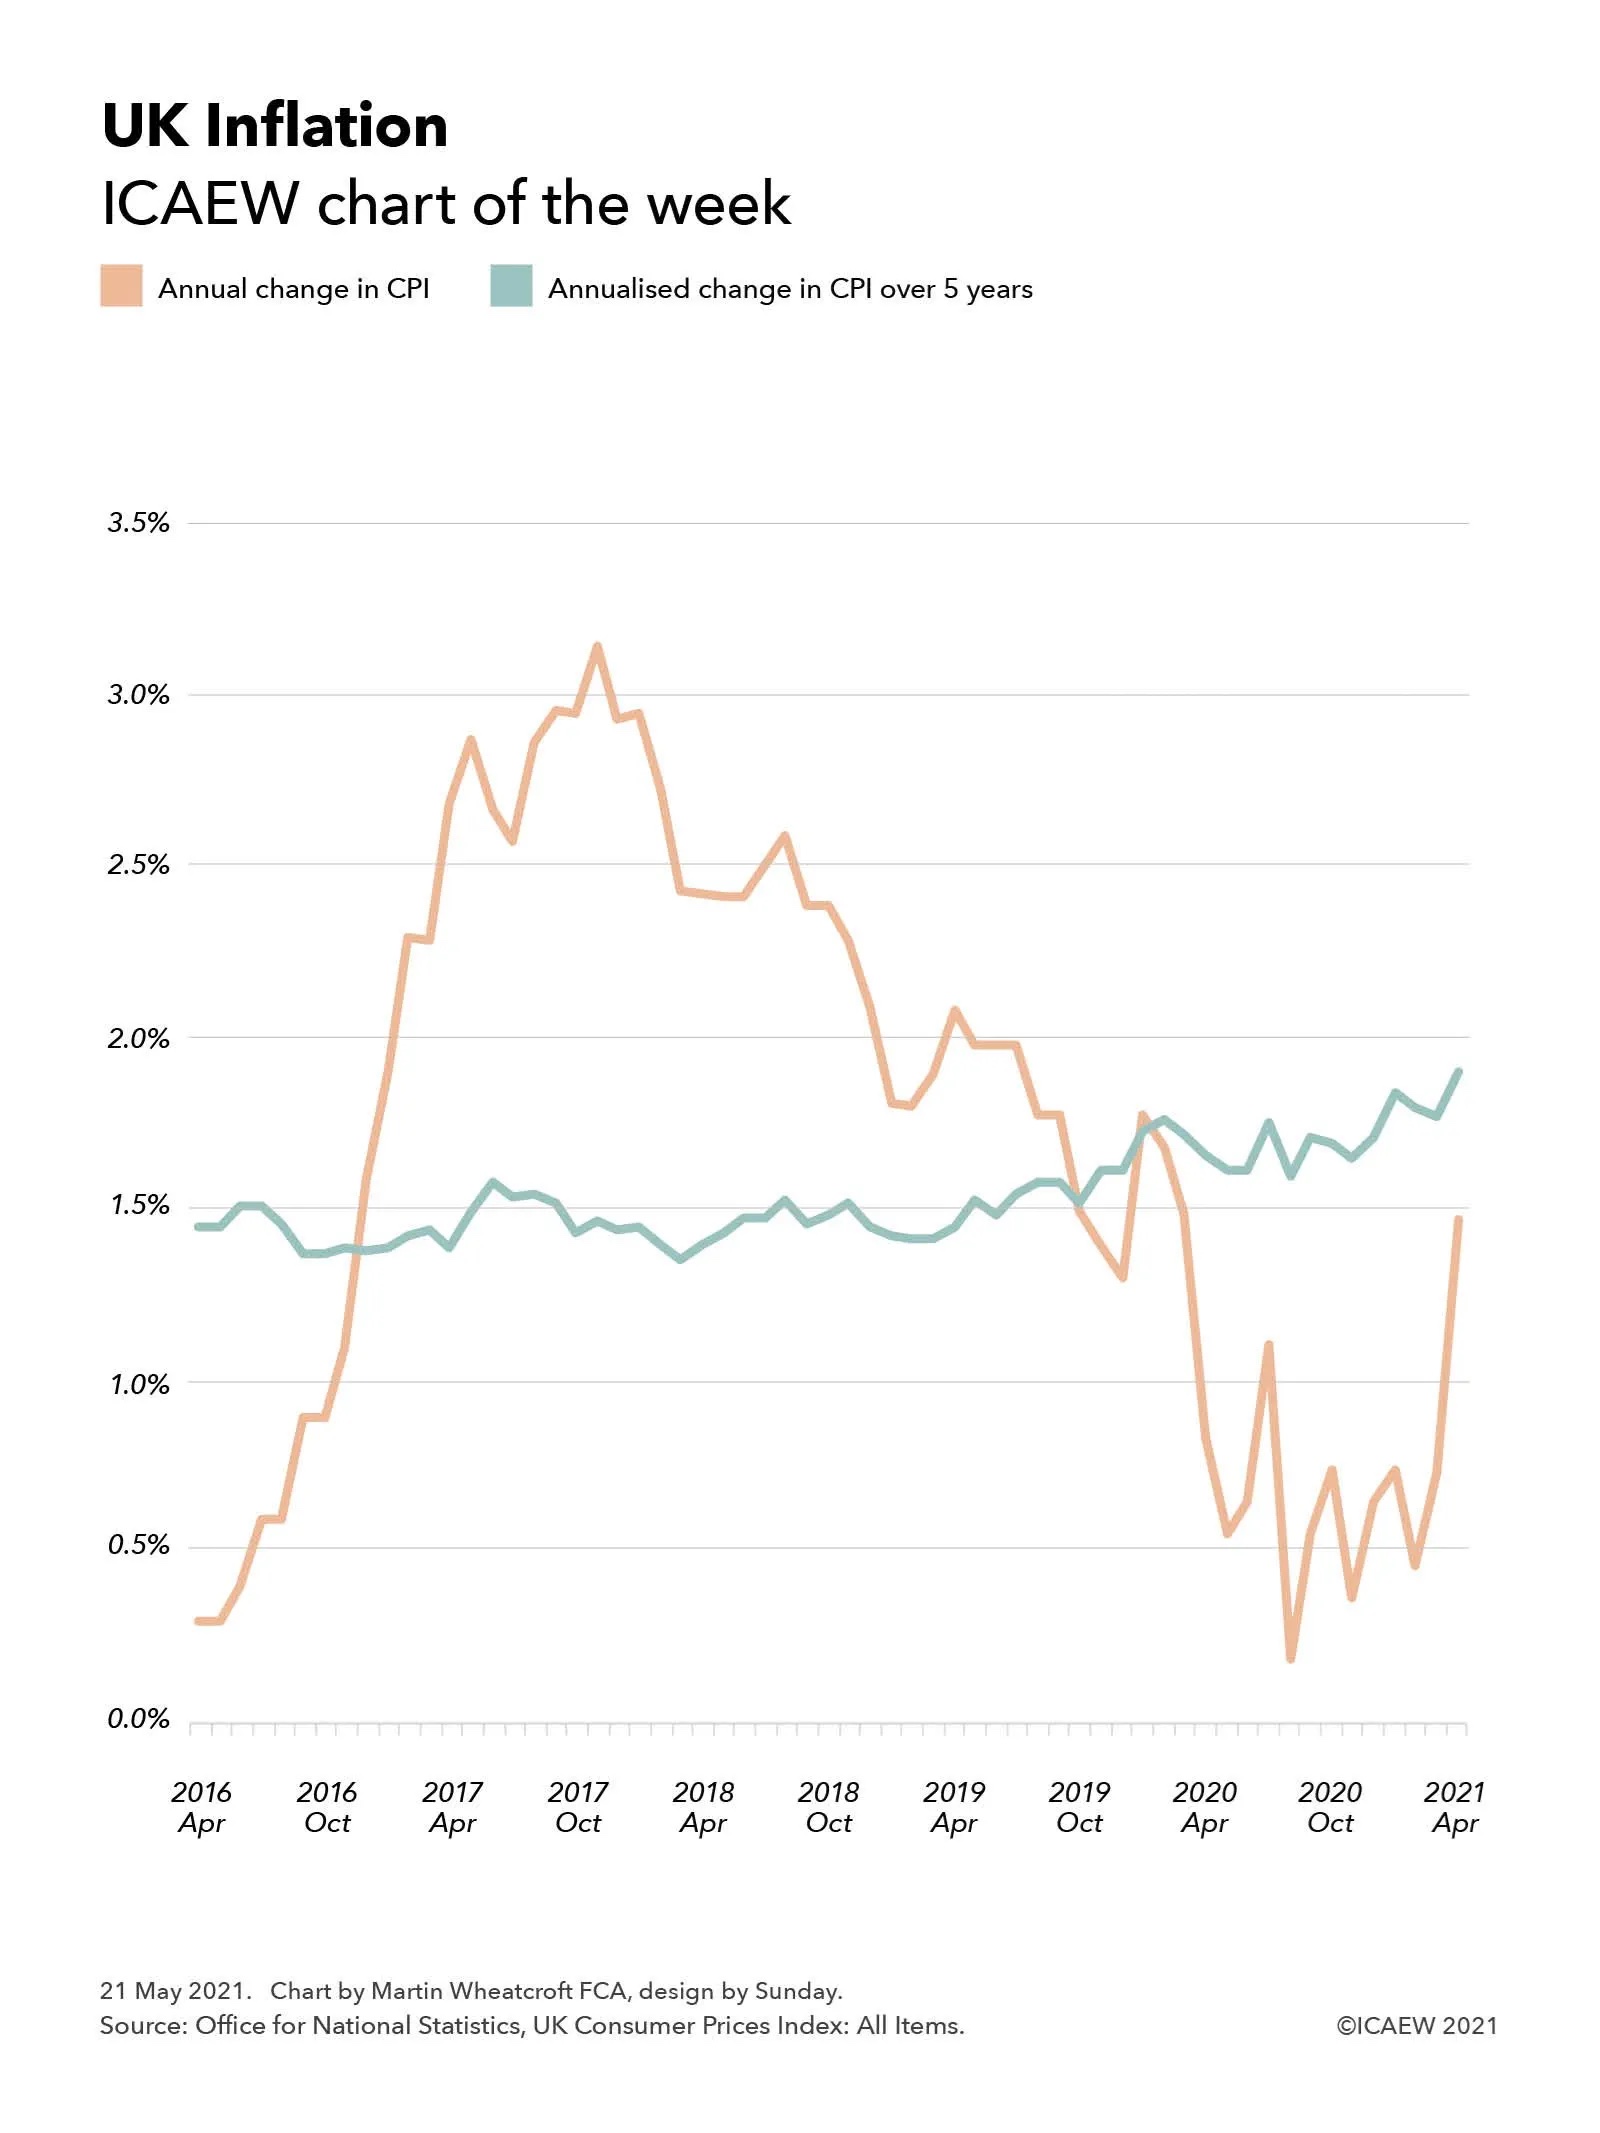
This week’s chart takes a look at UK inflation following news that the annual rate of inflation more than doubled in April to 1.5%, more than twice the 0.7% reported for the previous month.
The headline rate of inflation doubled this week from 0.7% to 1.5%, giving rise to concerns about the economic recovery. Economists aren’t getting worried just yet, but are they right to be so sanguine?
This scale of this jump partly reflects the timing of the first and current lockdowns, as inflation is typically measured by comparing prices with the same month a year previously, with significant changes both this year as the UK started to emerge from its third lockdown and a year ago as it was entering its first. Some commentators have pointed out that the temporary cut in VAT on restaurant food and leisure activities help prevent the jump from being even higher.
Our chart compares the annual rate of Consumer Price Index (CPI) inflation with a more stable measure, which is the annualised rate of CPI inflation over a five-year period. This is less susceptible to short-term swings in the economy, but as the chart shows, medium-term inflation has been gradually rising over the past five years even as headline rates on an annual basis fell over the last four years before the pandemic.
This perhaps explains some of the relaxed responses from economists about the sudden burst in inflation in the last month, given the annual rate of increase still remains below the medium-term trend, despite the current extraordinary economic circumstances.
Of course, that is not to say that inflation might not become a problem as the UK emerges further from lockdown. Many businesses have closed over the last year, particularly in the retail sector, while those that have survived will be looking to repair their balance sheets – a recipe for higher prices as constrained supply meets higher post-lockdown demand from consumers. Only time will tell whether this will feed into sustained higher levels of inflation or will jump be a temporary adjustment that falls out of the headline rate again in a year or so’s time.