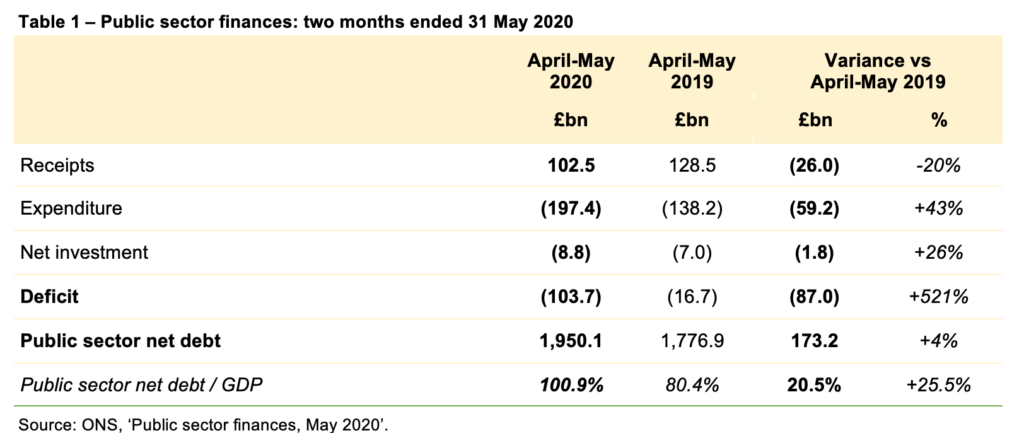
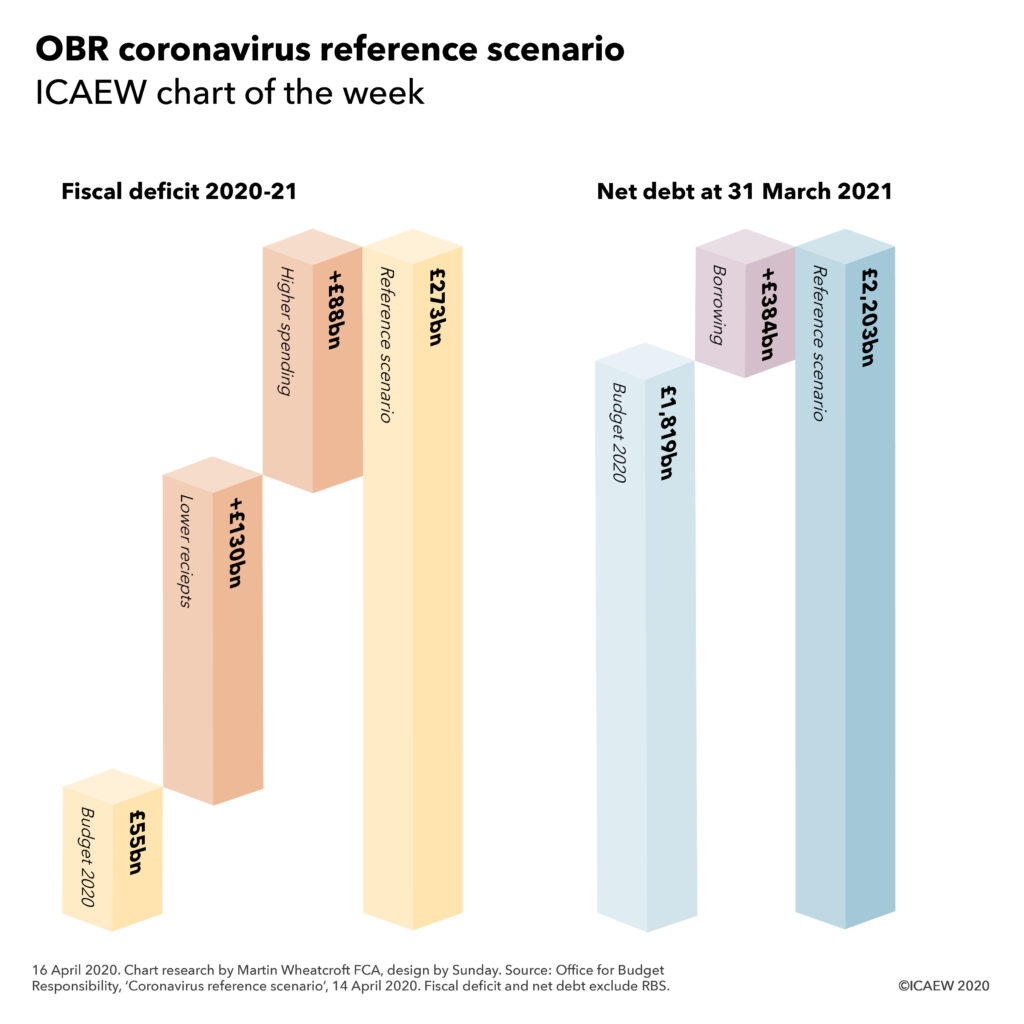
IFS: deficit to triple as budget contingency increases

30 March 2020: the Institute for Fiscal Studies (IFS) has suggested that the budgeted fiscal deficit for the financial year starting 1 April 2020 of £55bn could more than triple to £177bn due to the coronavirus pandemic.

In a new publication, the economic research institute also stated that there is a chance the 2020-21 deficit could end up exceeding £200bn.

The Chancellor has already stopped reporting financial estimates for a series of emergency measures, such as the funding of 80% of pay for furloughed workers and support for self-employed workers, incurring tens of billions of public money to keep an economy going whilst in lockdown.

The Contingencies Fund Act 2020 (passed by Parliament on 25 March 2020 alongside the Coronavirus Act 2020), increases the amount available for contingencies from a limit of 2% of spending authorised by Parliament in the preceding financial year to a limit of 50%. In effect, this gives the Chancellor the power to spend an additional £266bn in 2020-21 over and above spending plans already announced, a substantial increase from the £11bn that would have been available otherwise.

The IFS’s estimate assumes that a 5% contraction in the economy would reduce tax revenues by somewhere in the region of £80bn in 2020-21, albeit this would be offset by savings in interest costs following the reduction in the base rate to 0.1% and quantitative easing operations by the Bank of England.

Fiscal measures include the £12bn emergency package announced on the day of the Budget and the £20bn announced on 17 March, together with an estimate by the IFS of £18bn for further measures announced up until 25 March 2020.

The effect on the public finances estimated by the IFS is summarised in the table below.

Estimate of coronavirus revisions to the Spring Budget 2020

Financial year 2020-21Spring Budget
£bn
Economic contraction
£bn
Fiscal measures
£bn

Revised
£bn
Taxes and other income873(80)(22)771
Total managed expenditure(928)8(28)(948)
Fiscal deficit(55)(72)(50)(177)
% of GDP2.4%+3.4%+2.3%8.1%

Source: HM Treasury, Spring Budget 2020; IFS, estimates of economic contraction and fiscal measures to date, 26 March 2020; ICAEW, rough estimate of the split of fiscal measures between waiving tax and additional spending.

The IFS analysis of fiscal measures includes £10bn for the 80% job retention credit for employed workers (for which the IFS have assumed a 10% take-up), but it was prepared for the announcement of support for the self-employed. This could add another £9bn to the deficit for 2020-21.

The IFS has not included the risk of bad debts on the Government’s £330bn programme of financial guarantees and business loans or on the £30bn of second quarter deferred VAT payments. There is also no cost provision for the exposure to additional bank financing and corporate bond purchases by the Bank of England that is being guaranteed by HM Treasury.

Altogether, this would increase the deficit to £177bn, or 8.1% of GDP based on a 5% smaller economy, before taking account of the support package announced for the self-employed. The prospect of further fiscal measures in the weeks and months to come, combined with the risks from loans and guarantees, means that the prospect of a deficit in excess of £200bn is looking increasingly likely.

For more information

  • For the latest news and guidance on the ongoing impact of COVID-19 for businesses and accountants, visit ICAEW’s dedicated Coronavirus Hub.

This article was originally published by ICAEW.

ICAEW chart of the week: Post-GE2019 fiscal deficits

With the General Election now complete, the Office for Budget Responsibility (OBR) was able to release a restated version of its March 2019 fiscal forecasts this morning, reflecting technical revisions to the way the fiscal numbers are calculated, in particular that of student loans. This enables us to update the numbers set out our GE2019 Fiscal Insight on the party manifestos as best we can, given that the OBR has not deigned to include either the changes to public spending announced in the Spending Round 2019 nor the tax and spending changes in the Conservatives manifesto.

As illustrated by the #icaewchartoftheweek, the revised baseline forecast for the fiscal deficit is now £50bn for the current fiscal year, followed by £59bn next year in 2020-21, £58bn in 2021-22 and 2022-23 and £60bn in 2023-24.

It was frustrating that the OBR scheduled their publication of these revised numbers for the first day of the General Election purdah period making it vulnerable – as happened – to being pulled. A day earlier and that would not have happened! Ideally, these revisions would have been published as soon as practical after the publication by the ONS of their revisions to historical numbers in September.

It would have been even better if the OBR had been able to update their economic forecast too, given that the current baseline is still based on an economic and fiscal analysis from nine-months ago. With weak economic growth over the first half of the financial year, it is likely that the OBR will cut its forecasts for tax revenues over the forecast period when it does get round to updating them, resulting in higher deficits – even before taking account of suggestions that the Conservative GE2019 winners plan to announce a splurge of more capital expenditures in the Spring Budget in February.

Unfortunately, we won’t see an updated long-term forecast until at least July 2020, when the OBR is scheduled to publish its next fiscal sustainability report on the prospects for the public finances.

ICAEW chart of the week: General Election 2019

With voters in the UK going to the polls tomorrow, the #icaewchartoftheweek is on the political party’s plans for the public finances.

All the political parties are promising to increase taxes, public spending and investment, with the plan to eliminate the fiscal deficit now well and truly abandoned. 

The Conservatives are promising the least in terms of additional spending and investment, with £3bn a year extra spending in 2023-24, £8bn in extra capital investment and tax rises broadly offsetting tax cuts. However, this is unlikely to be the final result as they have deferred significant financial decisions, such as the funding of adult social care, until after the election. 

Labour is planning to spending much more with £83bn a year more spending by 2023-24, funded by £78bn tax increases and £5bn from higher economic growth. They plan capital investment of £55bn a year and £58bn in total over five years to compensate ‘WASPI’ women. This is pretty ambitious, leading the IFS and others to cast doubt on the achievability of their plans, while these numbers don’t include the additional borrowing from their plans to nationalise utilities, nor the borrowing of those businesses post-nationalisation.

The Lib Dem plans are also very ambitious, with £50bn extra a year public spending by 2024-25 funded by £37bn in higher taxes and £14bn in higher economic growth from cancelling Brexit. They plan to borrow an extra £25bn a year to fund new capital investment.

The Greens’ are planning to be even more ambitious, including completely reforming welfare provision with the introduction of a universal basic income, contributing to a £124bn increase in taxes and public spending (albeit some of this is a switch from tax deductions to cash payments). Their capital investment plans are the largest and likely to most difficult to deliver of all the major parties at £82bn a year on average over 10 years.

Unfortunately, none of the major political parties appear to have a fiscal strategy that extends beyond the next five years, with only limited measures to address the big financial challenges of more people living longer. This is disappointing given that relatively small actions taken now could make a big difference to the financial position of the nation in 25 years’ time.

ICAEW’s full analysis of the party manifestos can be found at icaew.com/ge2019manifestoanalysis.


You can be part of the conversation as part of ICAEW’s GE 2019: It’s More Than a Vote campaign.

ICAEW chart of the week: a trillion dollar deficit

Chart: A trillion dollar deficit. Revenue $3.6tn, Spending $4.6tn.

The #ICAEWchartoftheweek this week is on the US federal government budget. This is forecast by the Congressional Budget Office (CBO) to end the current financial year this month at just under a trillion dollars in deficit, with the budget shortfall in the year ended 30 September 2020 projected to exceed a trillion dollars for the first time.

Revenue in 2020 is expected to amount to $3,620bn. The largest contributions are from federal income taxes of $1,800bn and payroll taxes of $1,281bn, followed by a modest $245bn from corporate taxes and $294bn in other revenues.

This is projected to be $1,008bn less than planned spending by the federal government in 2020 of $4,628bn. Social security is expected to cost $1,097bn, while spending on Medicare, Medicaid and other health programmes are expected to cost $1,163bn net of receipts. Income security (welfare) programmes are expected to cost $302bn, while the balance of mandatory expenditure includes spending on military veterans and federal civilian and military retirement plans.

Discretionary spending of $1,400bn comprises $737bn on defense and $663bn on everything else apart from interest. This includes elementary and secondary education, housing assistance, international affairs, and the administration of justice, as well as outlays for highways and other programmes. Net interest is expected to cost $390bn.

The shortfall in revenues compared with spending will be funded by borrowing, with federal external debt expected to increase from $16.7tn to $17.8tn at the end of September 2020.

Federal revenues and spending are estimated to amount to 16.4% and 21.0% of GDP respectively in 2020, with the deficit equivalent to 4.6% of GDP. The CBO projects that the average federal deficit between 2020 to 2029 will be 4.7% of GDP, significantly higher than the 2.9% average over the last fifty years, resulting in federal debt growing from 79% of GDP in 2019 to 95% of GDP over the coming decade.

Of course, the federal budget does not give the full picture for the public finances in the US, with most state governments choosing (or being legally required) to run budget surpluses.

As with many developed economies, the public finances in the US are under increasing pressure with an increasingly long-lived population driving higher costs for social security, health and social care. With lower levels of economic growth (albeit currently much higher than in the UK or Europe) and a growing level of debt, there are concerns about the resilience of the US public finances if there were to be an economic downturn or another financial crisis in the medium term.

As summer turns into fall, it may be that a turn in economic seasons is on the way too. After all, winter is coming.

The full Congressional Budget Office report is available on cbo.gov.