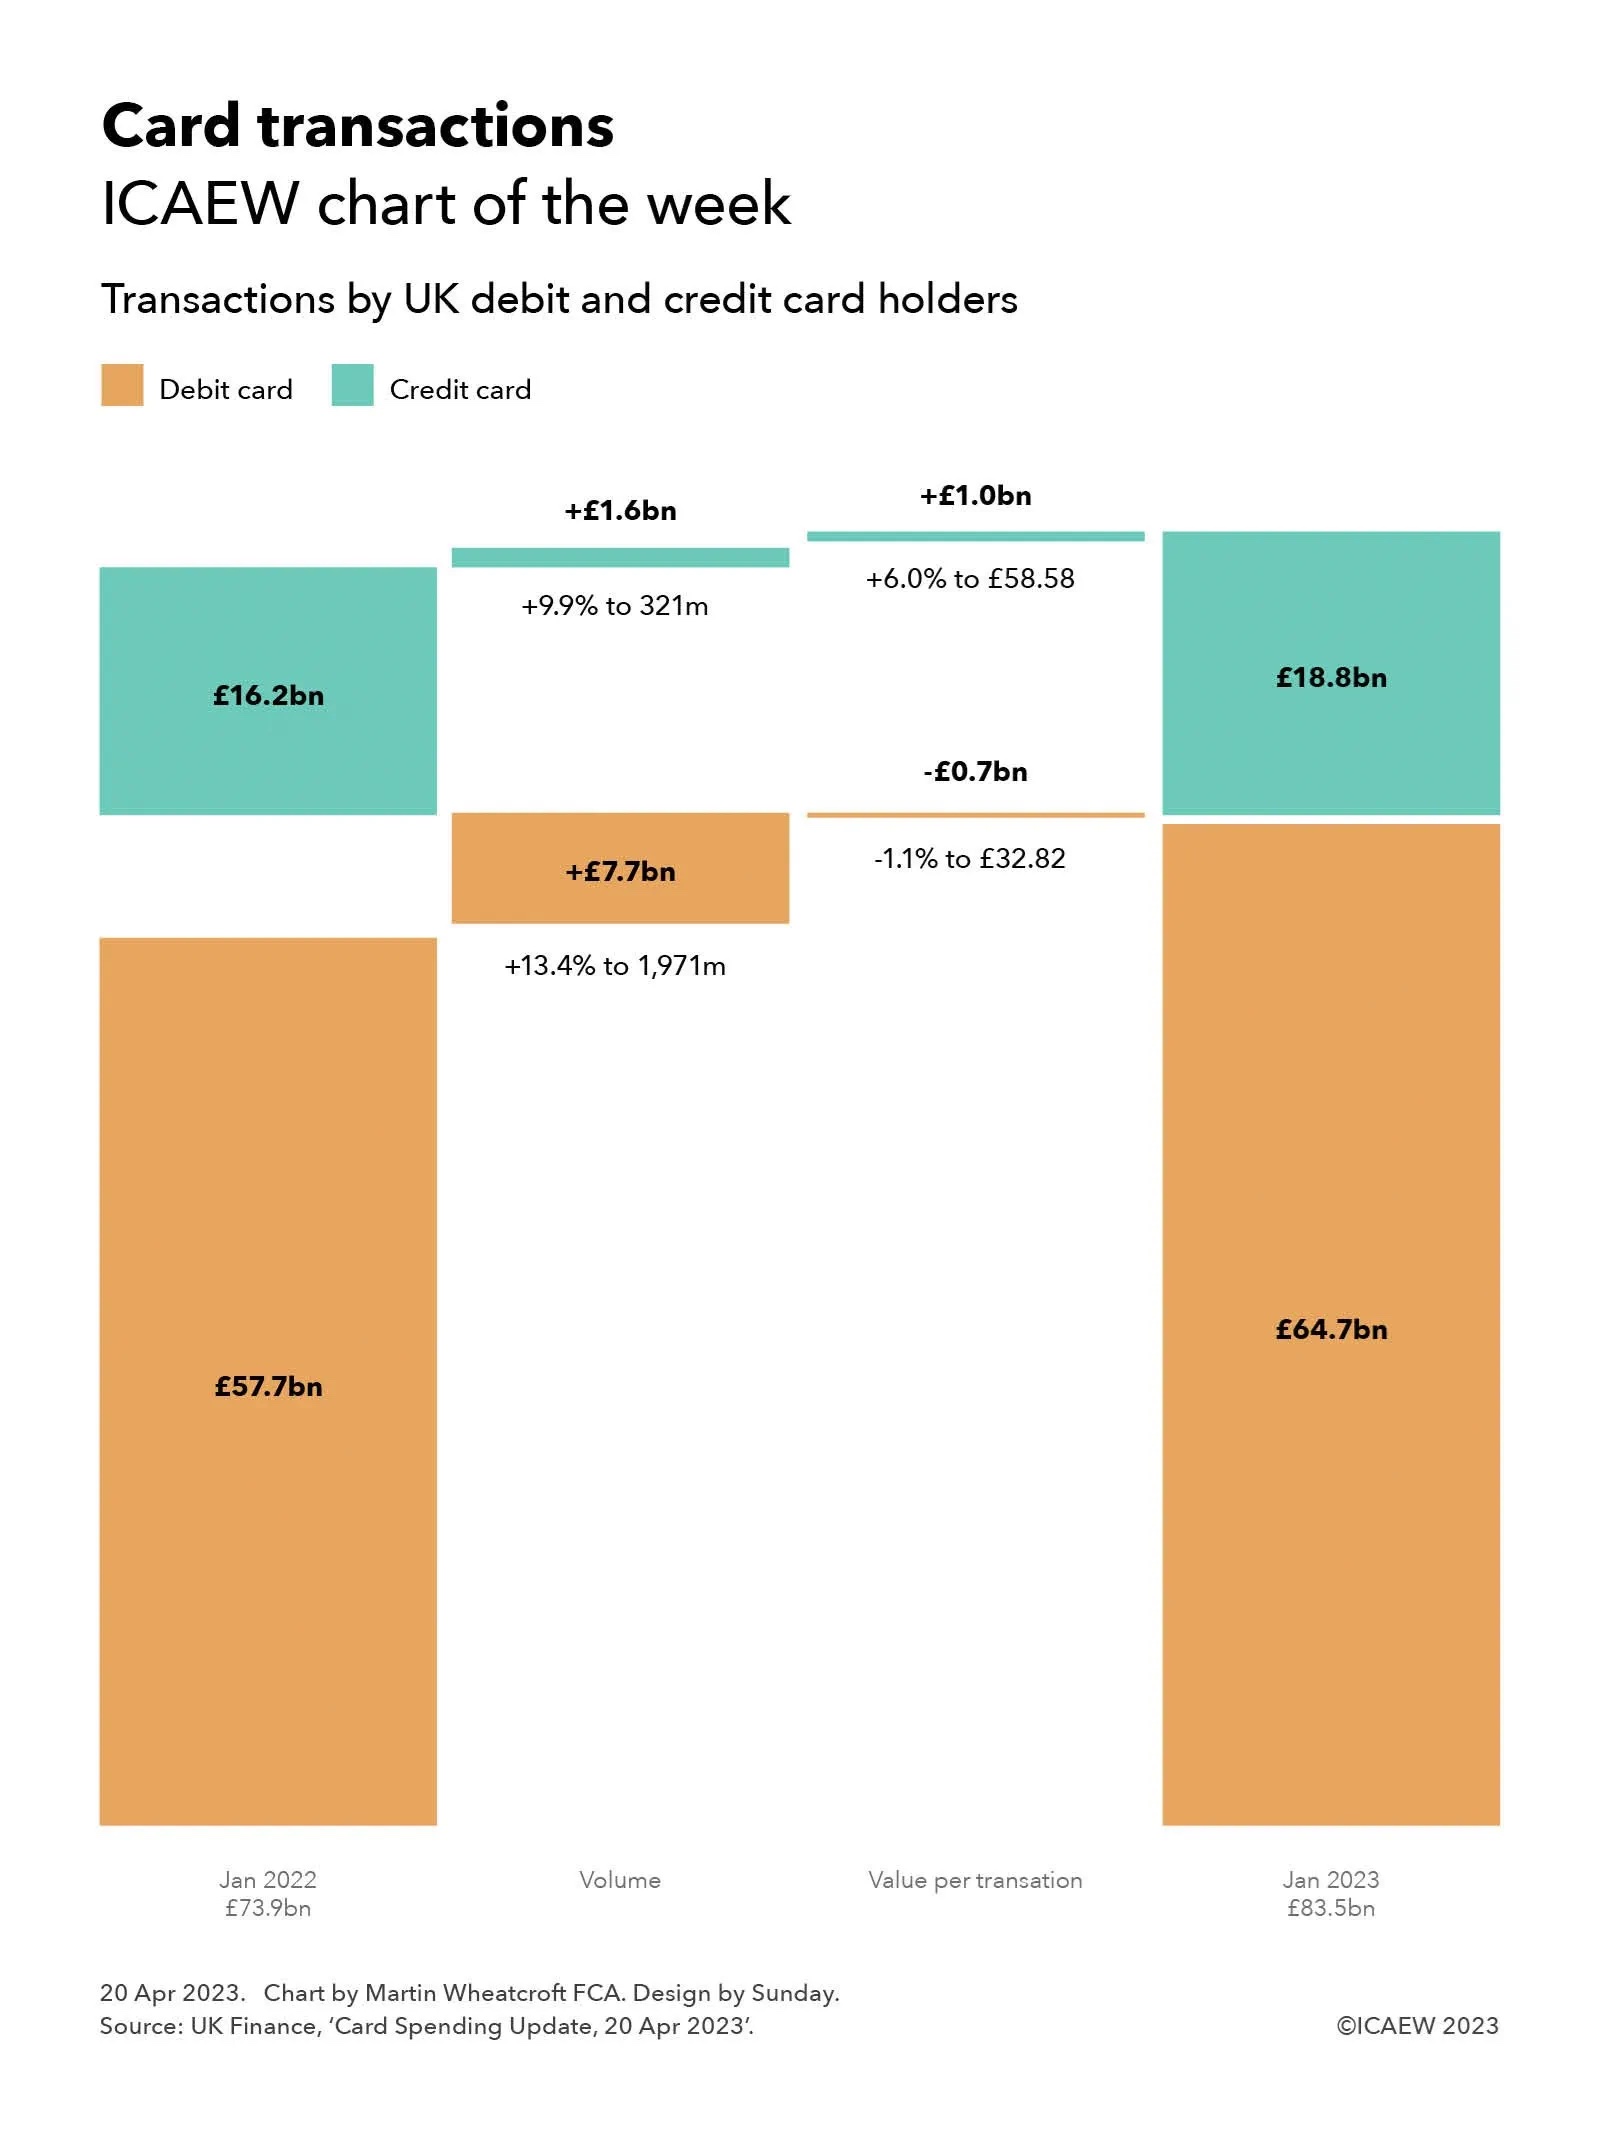
Volumes have been the main driver of the increase in value of debit and credit card transactions since 2022, as average spend on debit cards fell and the average transaction on credit cards rose by less than inflation.
UK Finance, the industry body for the banking and finance industry, released its latest data on UK card transactions on 20 April 2023. This provides an insight into UK debit and credit card transactions between January 2022 and 2023, and our chart this week takes a look at the year-on-year change in transaction amounts.
The monthly total value of transactions on UK-issued debit and credit cards increased from £73.9m in January 2022 to £83.5bn in January 2023, putting card transactions on course to exceed £1trn over the course of 2023. This includes online and telephone purchases, as well as in-person retail transactions and spending overseas.
Our chart illustrates how the value of debit card transactions increased from £57.7bn in January 2022 to £64.7bn, analysed between £7.7bn from a 13.4% increase in the volume of transactions to 1,971m, less £0.7bn from a 1.1% fall in the average value of each debit card purchase to £32.82.
In the context of inflation in excess of 10%, a decline in the average value of debit transactions may seem counterintuitive. This is partly because of the continued displacement of cash as a method of payment, especially for low value purchases – contributing to growth in the volume of transactions, but a decline in average purchase amounts. Consumers scaling back their spending in response to the cost-of-living crisis is also likely to be a factor.
The value of credit card transactions rose from £16.2bn to £18.8bn, reflecting £1.6bn from a 9.9% increase in the number of transactions to 321m plus £1.0bn from a 6.0% increase in the average value of each transaction to £58.58.
The largest component of credit card transactions were purchases, which increased from £14.6bn to £17.1bn, up £1.4bn from a 9.9% increase in the volume of purchases to 319m, and £1.1bn from a 6.7% increase in the average value of each purchase to £53.60. Cash advances increased from £187m to £207m (from a 6.6% increase in the number of cash advances to 1.5m and a 3.6% increase in average advance to £135), while balance transfers increased from £1.4bn to £1.5bn (from a 4.0% increase in the number of balance transfers to 0.7m and a 4.9% increase in average transfer to £2,133).
Similar to debit cards, the decline in the average value of each credit card purchase after inflation is likely to be affected by the ongoing switch from cards to cash, as well as a scaling back of purchases by some consumers. There may also have been a shift in purchasing patterns for some households, from fewer larger purchases to more frequent smaller ones.
Not shown in the chart is the amount owed by credit card holders, which was 9.1% higher at £60bn at the end of January 2023 compared with £55bn a year previously. This is lower than the £61.3bn owed at the end of December 2022 as the £20.1bn repaid (just under a third of the total) exceeded the £18.8bn added. According to UK Finance, 51.3% of credit card balances attract interest, with the remainder primarily comprising those who pay their balances in full each month and those on interest-free balance transfers.
Debit and card usage is expected to continue to rise, with UK Finance previously forecasting that cash usage will fall from around 15% of all retail purchases in 2021 to around 6% by 2030. Others have suggested that physical cash could be eliminated altogether, saving the exchequer and businesses from the costs of creating, handling and disposing of cash.
For many, transitioning to a cashless society will be welcome – heralding the end of the need of jingling coins and purses and wallets bulging with banknotes. For others, including the million or so consumers who prefer or are reliant on cash for most of their day-to-day shopping, this may not be so positive.
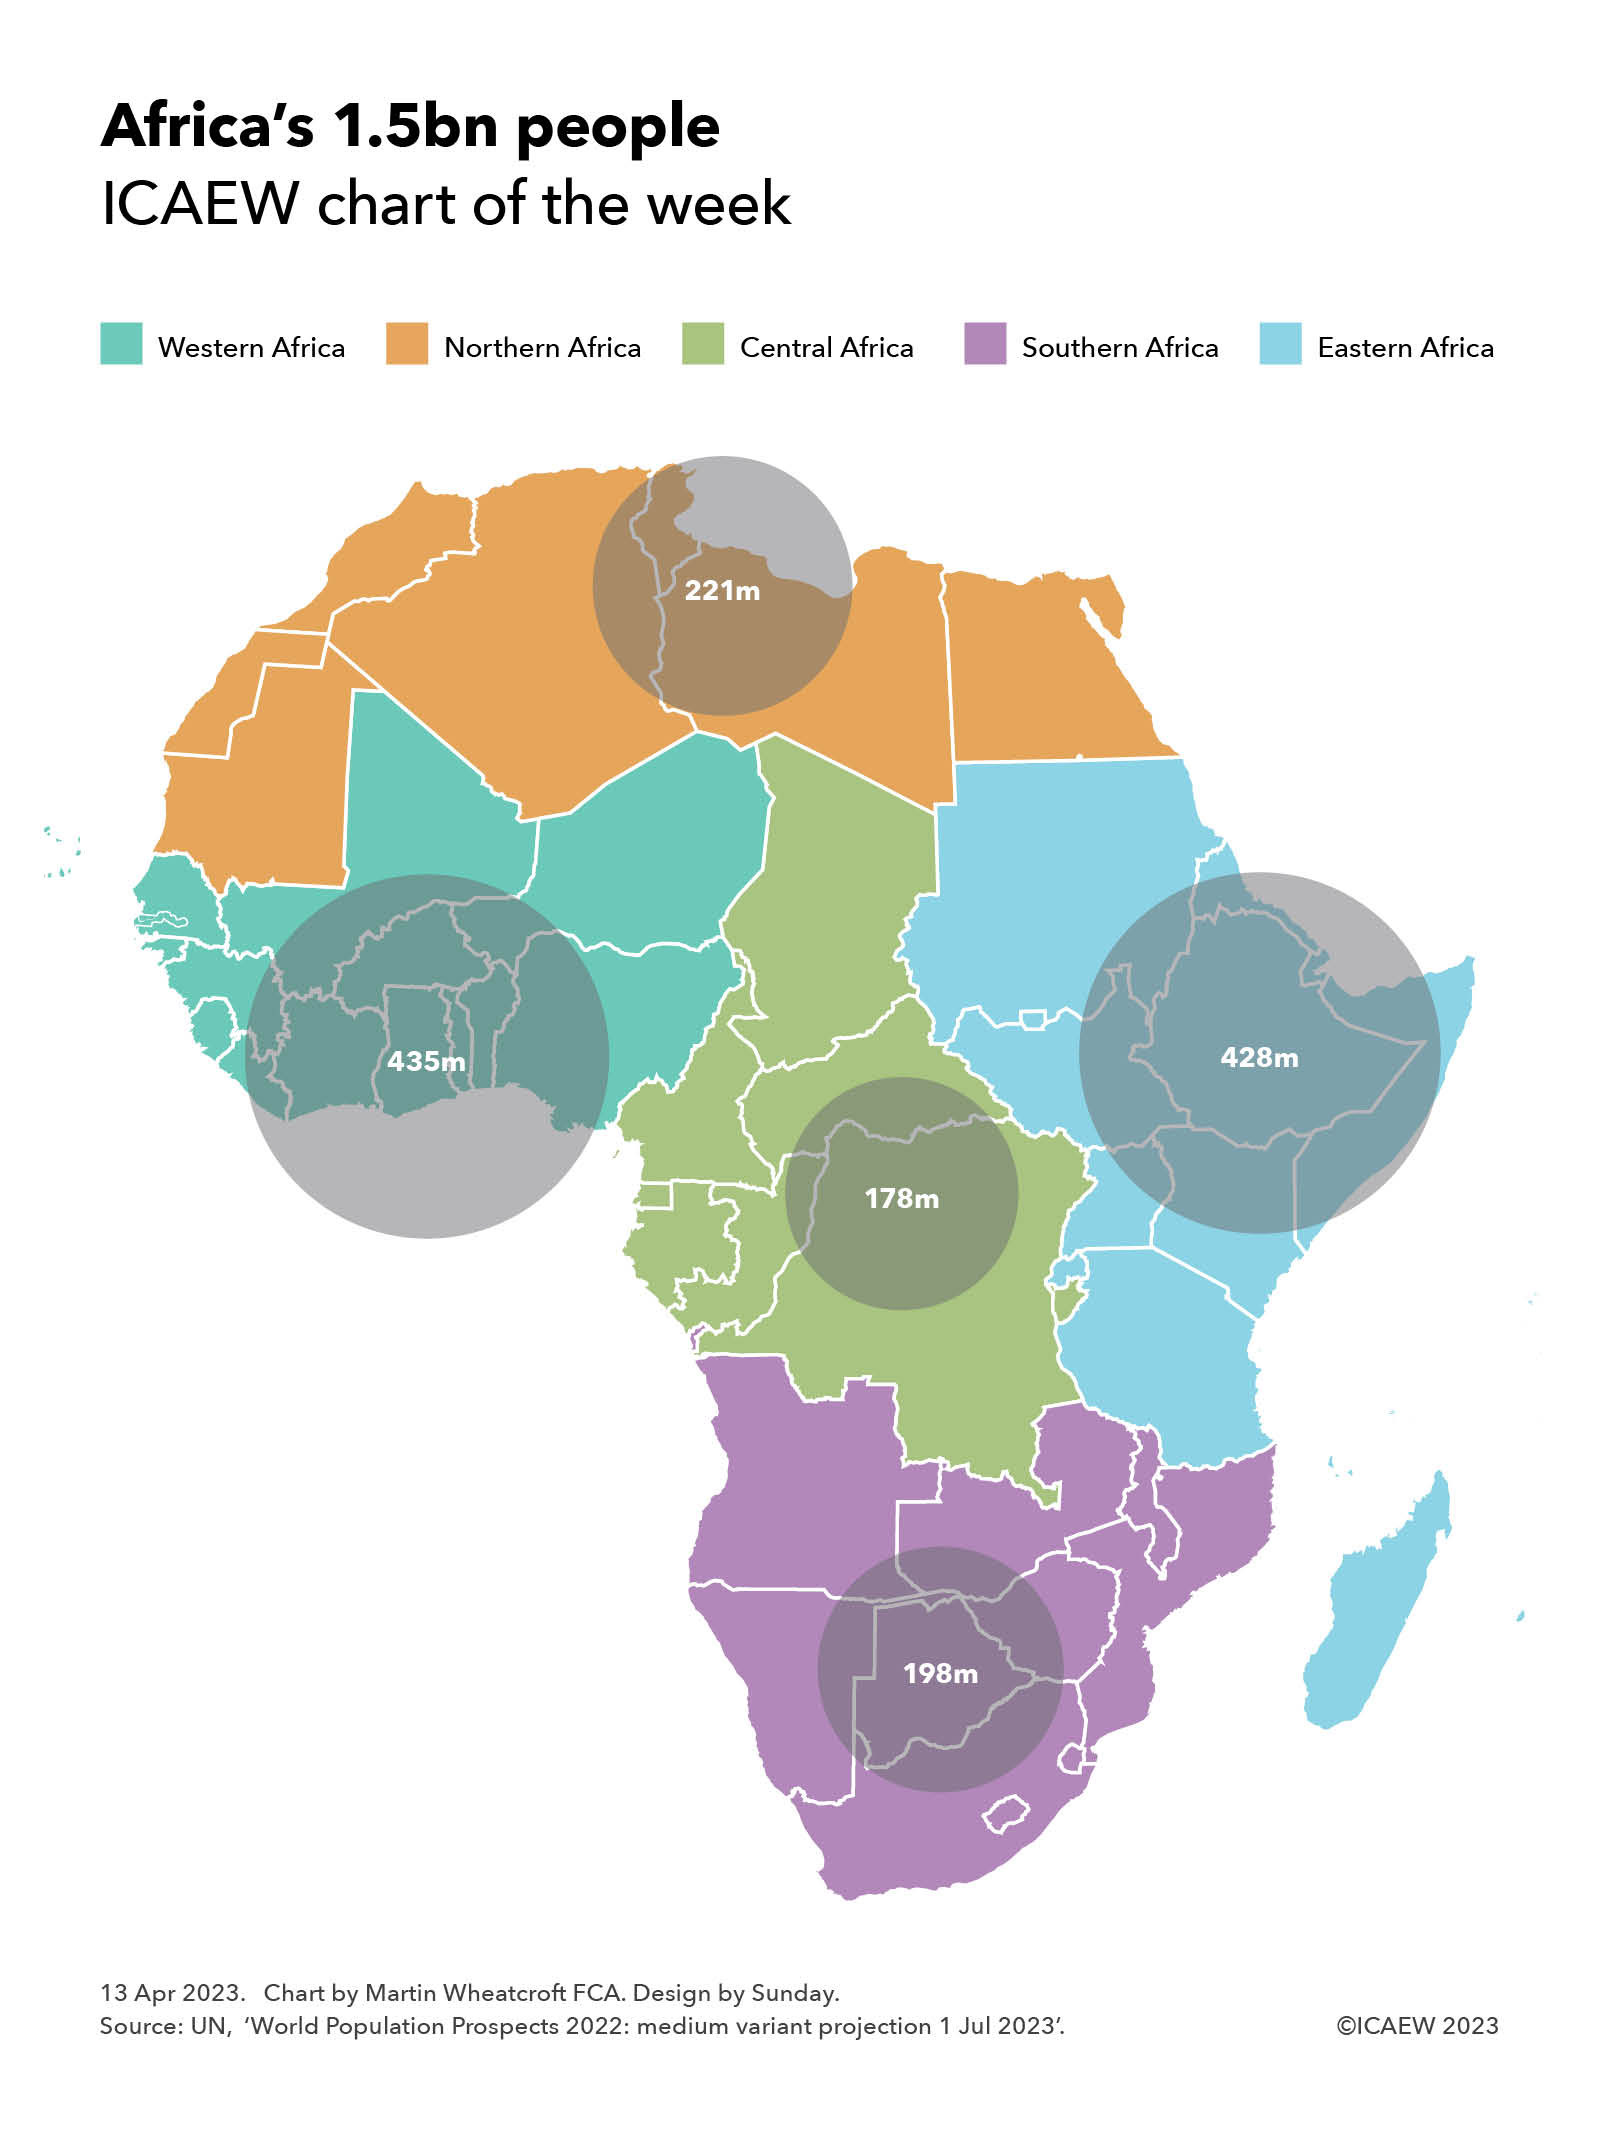
I take a look at Africa this week and how its current population of 1.5bn, 18% of the world’s total, is distributed across the continent.
My chart this week illustrates how Africa’s population of 1,460m can be divided into five regions. These comprise Western Africa with 435m people, Northern Africa with 221m, Central Africa with 178m, Southern Africa with 198m, and Eastern Africa with 428m.
These regions are based on the African Union’s official regions for its 55 member states, which differ from the regions used by the United Nations. They include Réunion (1.0m) and Mayotte (0.3m), two French overseas territories in the Indian Ocean that are not members of the African Union, as well as St Helena (5,000), an overseas territory of the UK in the Atlantic. It also includes an estimated 5.8m people living in African Union applicant Somaliland that are included within the number for Somalia.
Excluded are 175,000 or so people living on the African continent in Ceuta and Melilla (Spain), around 2.2m and 250,000 respectively in the Atlantic Ocean on the Canary Islands (Spain) and Madeira (Portugal), and several hundred people in the Indian Ocean within France’s Southern Territories.
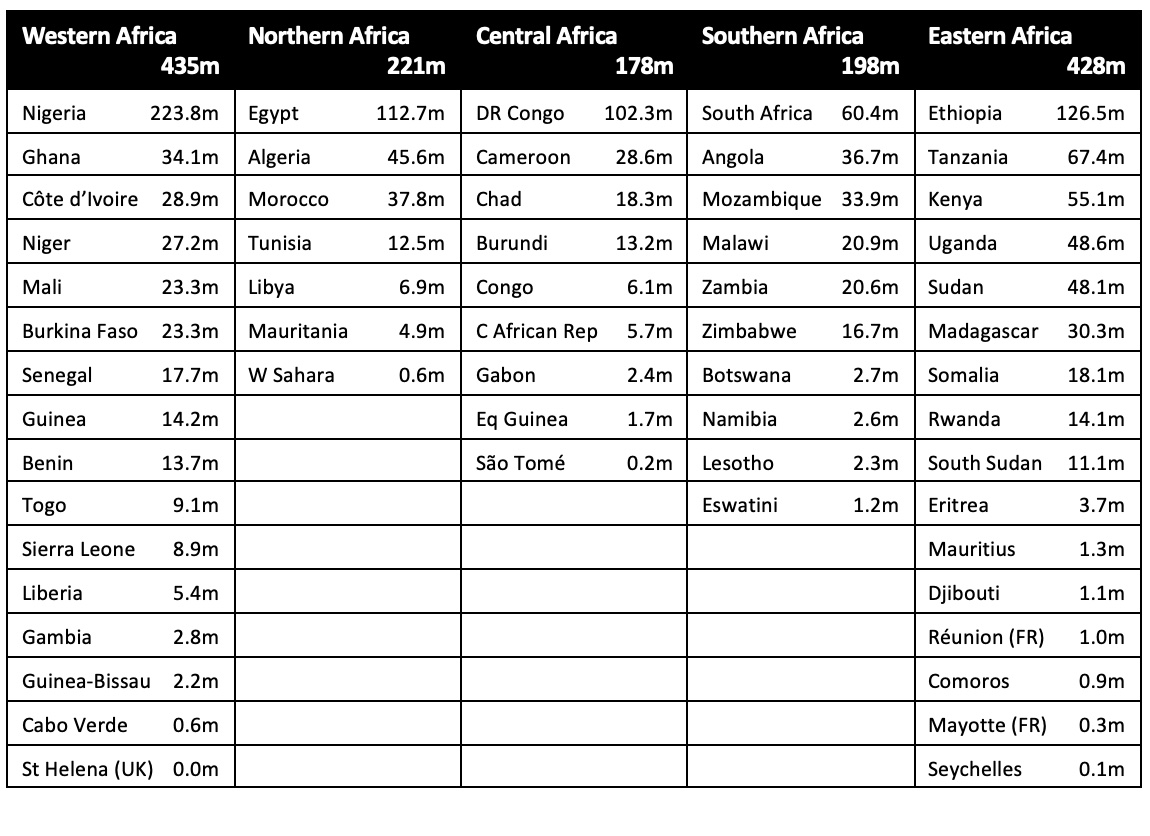
The table below breaks down the total by country within each region, highlighting how the four largest countries by population each have more than 100m people, led by Nigeria with 223.8m (15.3% of Africa’s total), Ethiopia with 126.5m (8.7%), Egypt with 112.7m (7.7%) and the Democratic Republic of the Congo with 102.3m (7.0%).
The next largest are Tanzania with 67.4m (4.6%), South Africa with 60.4m (4.1%), Kenya with 55.1m (3.8%), Uganda with 48.6m (3.3%), Sudan with 48.1m (3.3%), Algeria with 45.6m (3.1%), Morocco with 37.8m (2.6%), Angola with 36.7m (2.5%), Ghana with 34.1m (2.3%), Mozambique with 33.9m (2.3%), Madagascar with 30.3m (2.1%) and Côte d’Ivoire with 28.9m (2.0%).
The population of Africa is expected to grow significantly over the rest of the century, with the UN’s medium variant projecting a population of 1.7bn (20% of the projected global total) in 2030, 2.1bn in 2040 (23%), 2.5bn (26%) in 2050, 2.9bn (28%) in 2060, 3.2bn (31%) in 2070, 3.5bn (34%) in 2080, 3.7bn (36%) in 2090 and 3.9bn (38%) in 2100. This is despite a rapidly declining birth rate, with many more Africans living much longer lives than preceding generations.
Africa is currently relatively poor compared with advanced economies, with the total GDP for its 55 countries and 1.5bn people close in size to the UK’s single country GDP for 67.5m people of around £2.5trn a year at current exchange rates. This is around 3% of the global economy in each case.
The UK’s share of the global economy is likely to decline over the rest of the century as Africa and other developing economies grow at a much faster pace. For Africa the combination of a rapidly growing population and economic development should see it become substantially more significant to the global economy than it is today.
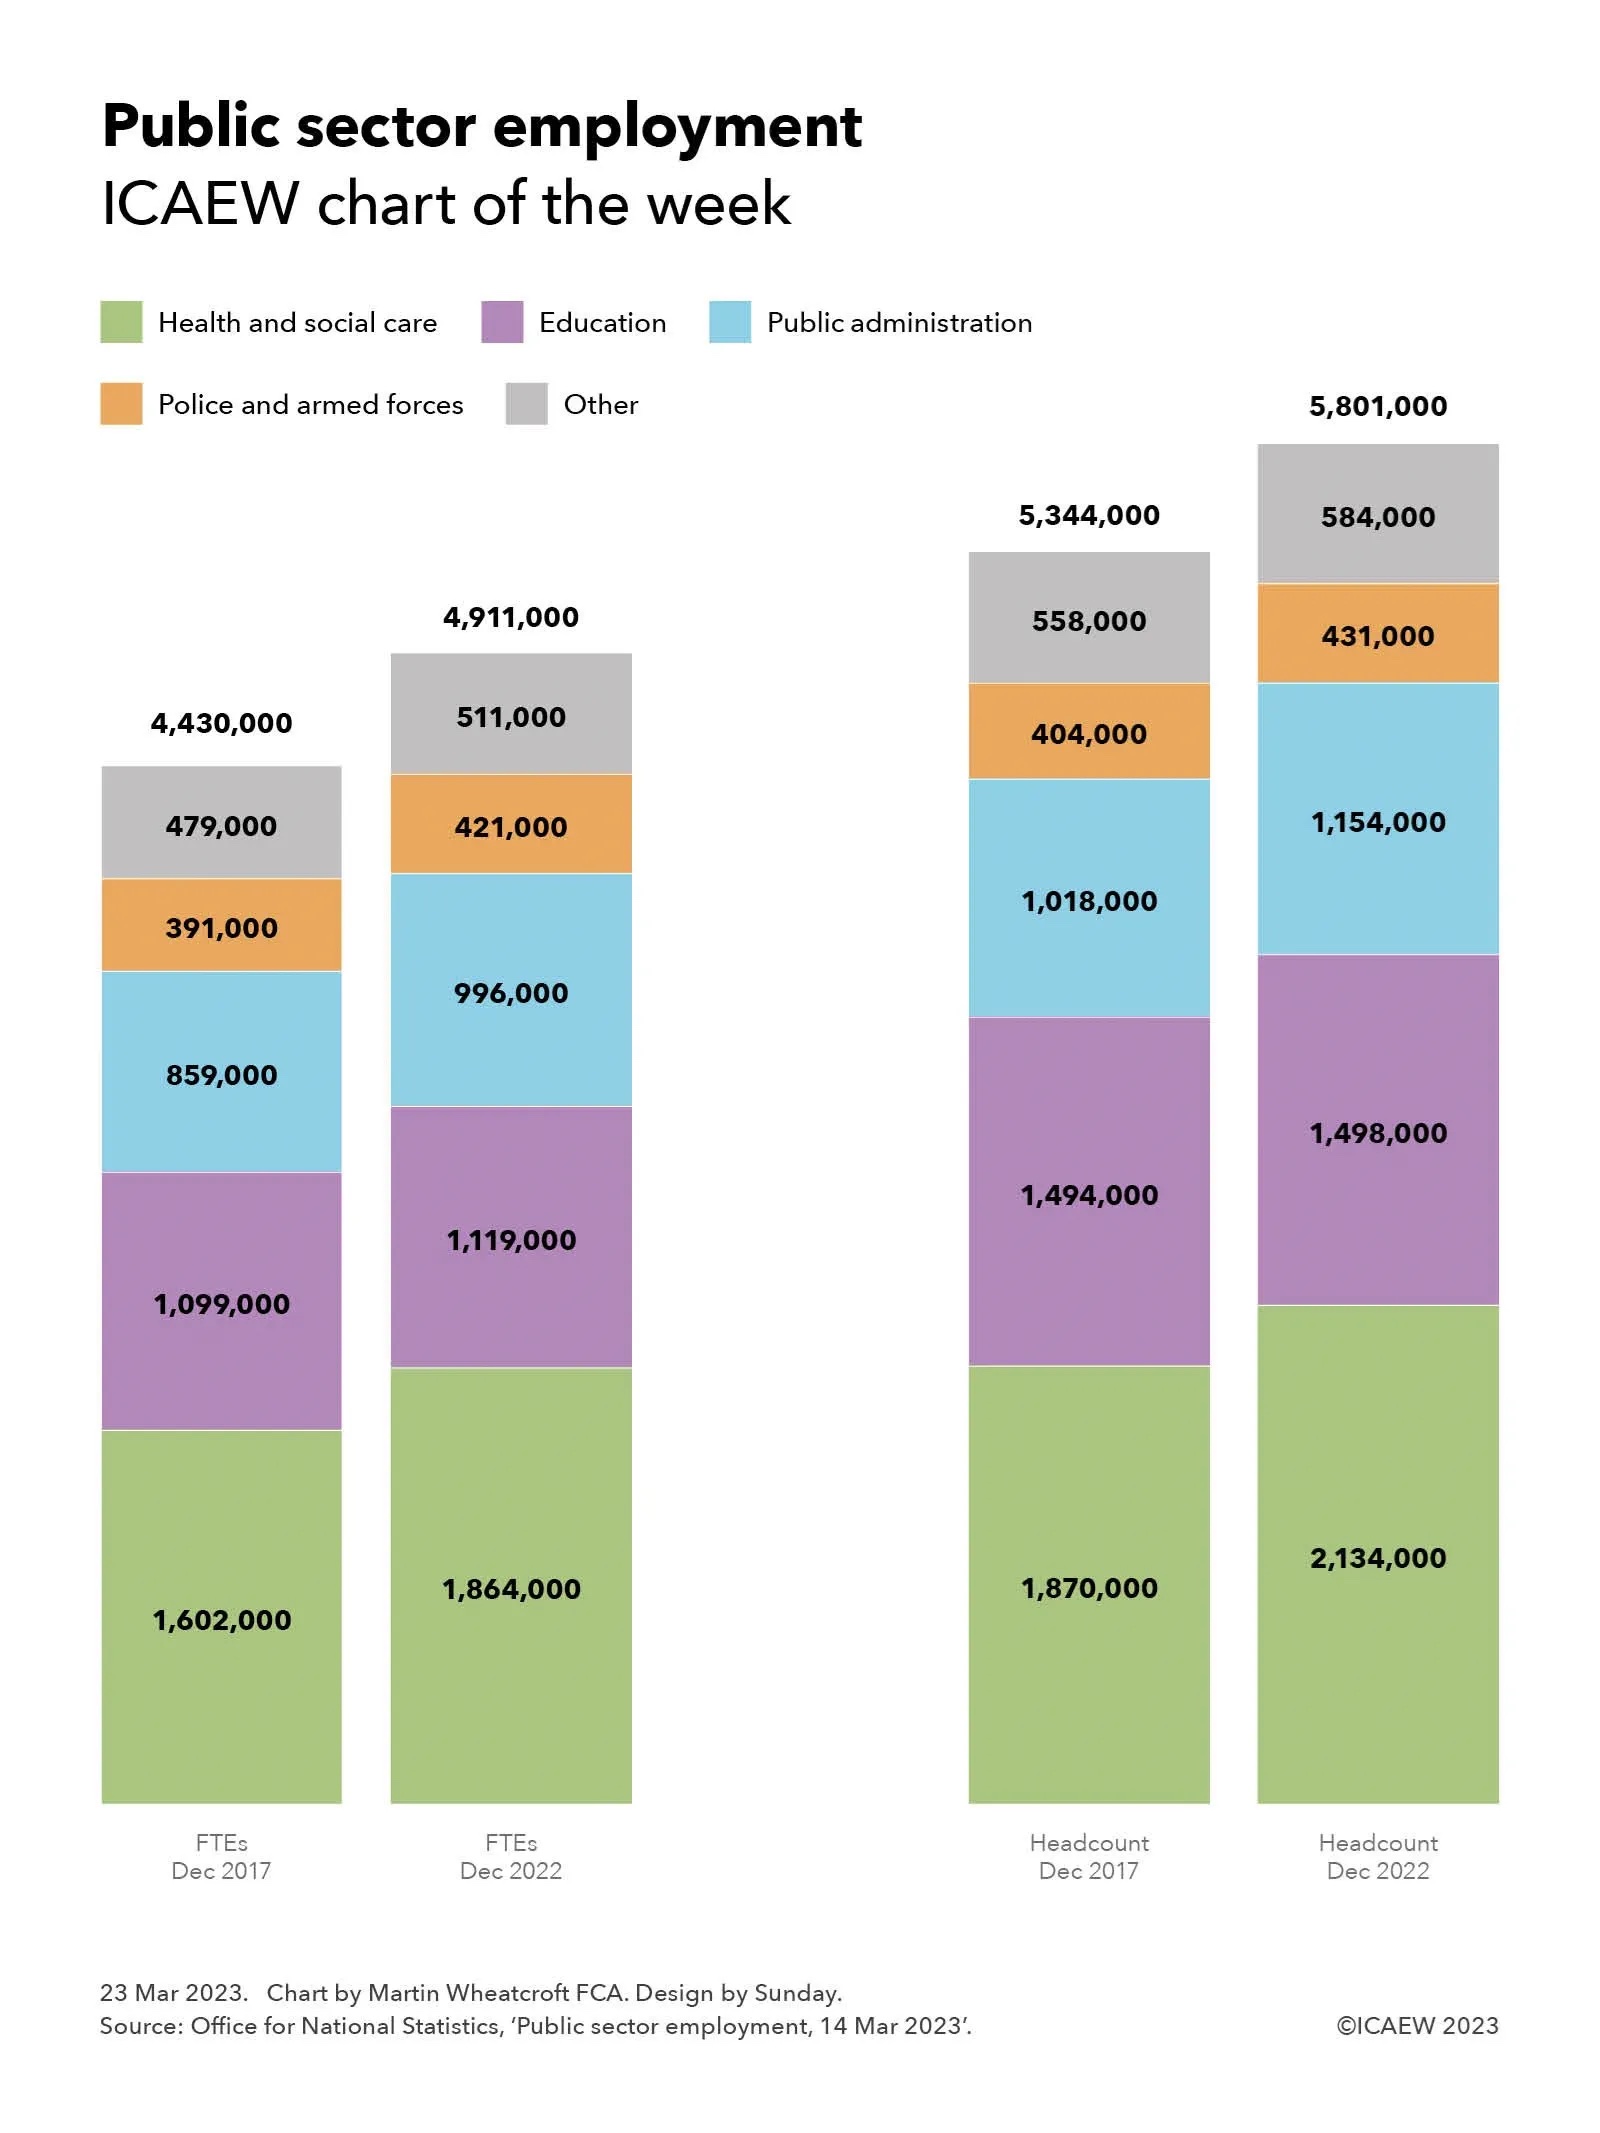
My chart takes a look at how employment in the public sector has grown from 5.3m to 5.8m over the past five years.
The size of the public sector workforce has grown significantly over the last five years between December 2017 and December 2022, with the number of full-time-equivalent employees (FTEs) increasing by 11% from 4,430,000 to 4,911,000 and headcount rising by 9% from 5,344,000 to 5,801,000.
This compares with a population increase of 2% over that time, but a 7% increase in those aged 65 or more (from 12.1m to 12.9m), which adds significantly to the demands placed on the National Health Service.
Our chart highlights how the number of FTEs working in health and social care increased by 16% from 1,602,000 to 1,864,000 between 2017 and 2022, while headcount went up by 14% from 1,870,000 to 2,134,000. This principally relates to the National Health Service, which saw FTEs go up 19% from 1,430,000 to 1,700,000 and headcount go up 17% from 1,640,000 to 1,916,000. Other health and social work staff fell slightly with FTEs down from 172,000 to 164,000 and headcount from 230,000 to 216,000. The latter excludes most social care staff, which are principally employed in the private sector.
The next biggest category is education, which saw FTEs increase by 2% from 1,099,000 to 1,119,000 at the same time as headcount was broadly flat, going from 1,494,000 to 1,498,000, implying more hours being worked by school staff and other state employees in the education sector. This represents an increase in efficiency given that pupil numbers have increased by around 4% over the same period.
Public administration FTEs increased by 16% from 859,000 to 996,000 and headcount by 13% from 1,018,000 to 1,154,000. This category includes the civil service (FTEs up 22% from 396,000 to 483,000 and headcount up 21% from 427,000 to 515,000) in addition to local authority and other office staff across the wider public sector. Much of this increase in public administration has been driven by Brexit, which has required more staff to perform duties previously outsourced to the EU as well as to administer more bureaucracy in the nation’s trading arrangements, although other factors such as pandemic have also had an impact.
Police and armed forces FTEs increased by 8% from 391,000 to 421,000 and headcount by 7% from 404,000 to 431,000. This can be analysed between the armed forces where FTEs were broadly the same at around 155,000 for both FTEs and headcount in both 2017 and 2022, and the police, including civilians, where both FTEs and headcount increased by around 12% (FTEs from 236,000 to 265,000 and headcount from 246,000 to 276,000). The latter principally reflects the government’s decision to reverse cuts in police numbers implemented in the early 2010s.
Other staff in the public sector have also increased over the last five years, with FTEs up 7% from 479,000 to 511,000 and headcount up 5% from 5,344,000 to 5,801,000.
Overall, the public sector in the UK has seen both employment headcount and hours worked per employee grow over the last five years as demands on public services have increased significantly. This is partly down to an ageing society, which puts pressure on the NHS, combined with the consequences of the pandemic, which exacerbated backlogs throughout the system. It is also a consequence of Brexit, which has added significantly to administrative and policy burdens placed on the civil service in particular.
These significant increases in FTEs and headcount perhaps explain the government’s moves to cut public sector pay in real-terms over the last few years. It remains to be seen if that Canute-like policy will be sufficient to hold back the tide of higher payroll costs that have been and are continuing to roll in to the shores of the public finances.
Jeremy Hunt limits his tax and spending ambitions in the Spring Budget to stay within a very tight fiscal rule.
The Spring Budget 2023 for the government’s financial year of 1 April 2023 to 31 March 2024 was presented by the Chancellor of the Exchequer to Parliament on Wednesday 15 March 2023, accompanied by medium-term economic and fiscal forecasts from the Office for Budget Responsibility (OBR) covering the period up to 2027/28.
The fiscal numbers in the Budget are based on the National Accounts prepared in accordance with statistical standards. They differ in material respects from the financial performance and position that will eventually be reported in the Whole of Government Accounts prepared in accordance with International Financial Reporting Standards (IFRS).
A (slightly) lower fiscal deficit in 2023/24
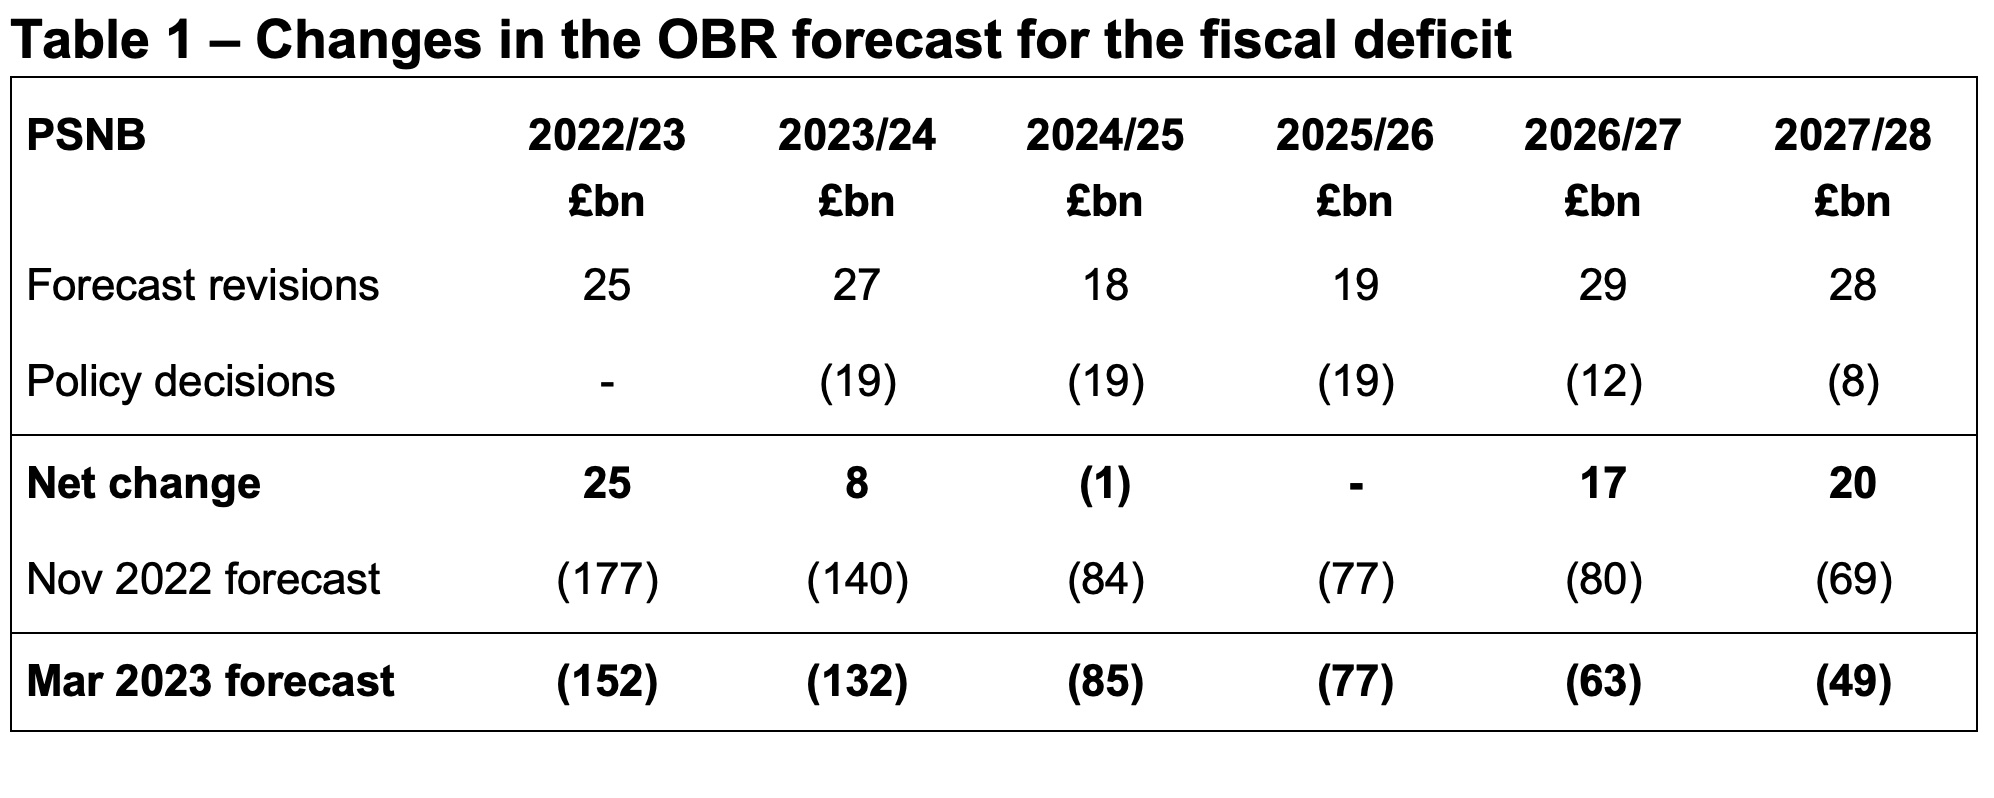
Table 1 shows the Spring Budget estimate for the deficit in 2023/24 is £132bn, £8bn lower than the £140bn forecast in November 2022. Positive revisions to the forecast added £27bn to the bottom line, before £19bn from tax and spending decisions made by the Chancellor.
Forecast revisions in 2023/24 comprised £13bn in lower debt interest, £7bn less in energy support and £8bn in higher tax receipts, less £1bn other changes. The cost of tax and spending decisions in 2023/24 was estimated to be £8bn in lower corporation tax receipts from the full expensing of capital expenditure, £5bn from freezing fuel duties, £5bn from extending the energy price guarantee and other energy support measures, £2bn more for defence and security and £2bn from other decisions, less £3bn in indirect effects of those policy decisions on tax receipts and welfare spending.
Total receipts in 2023/24 are now expected to be £1,057bn (£2bn higher than previously forecast) and total managed expenditure is now anticipated to be £1,189bn (£10bn lower).
The forecast for the deficit in 2024/25 was up £1bn at £85bn and was unchanged in 2025/26 at £77bn, with upward revisions of £18bn and £19bn respectively offset by an estimated £19bn net cost of tax and spending decisions. The latter includes £3bn in 2024/25 and £4bn in 2025/26 for expanded childcare eligibility.
The final two years of the forecast were better by £17bn in 2026/27 (down to a fiscal deficit of £63bn) and by £20bn in 2027/28 (down to £49bn), although several commentators have pointed out this is on the basis of unrealistic spending assumptions that do not take account of significant pressures on public services.
In addition to forecasts for the next five years, the OBR also revised its estimate for the deficit in the current financial year ending 31 March 2023 to £152bn, £25bn lower than November’s estimate of £177bn. This is £53bn more than the OBR’s March 2022 estimate of £99bn and £69bn more than the November 2021 Budget estimate of £83m.
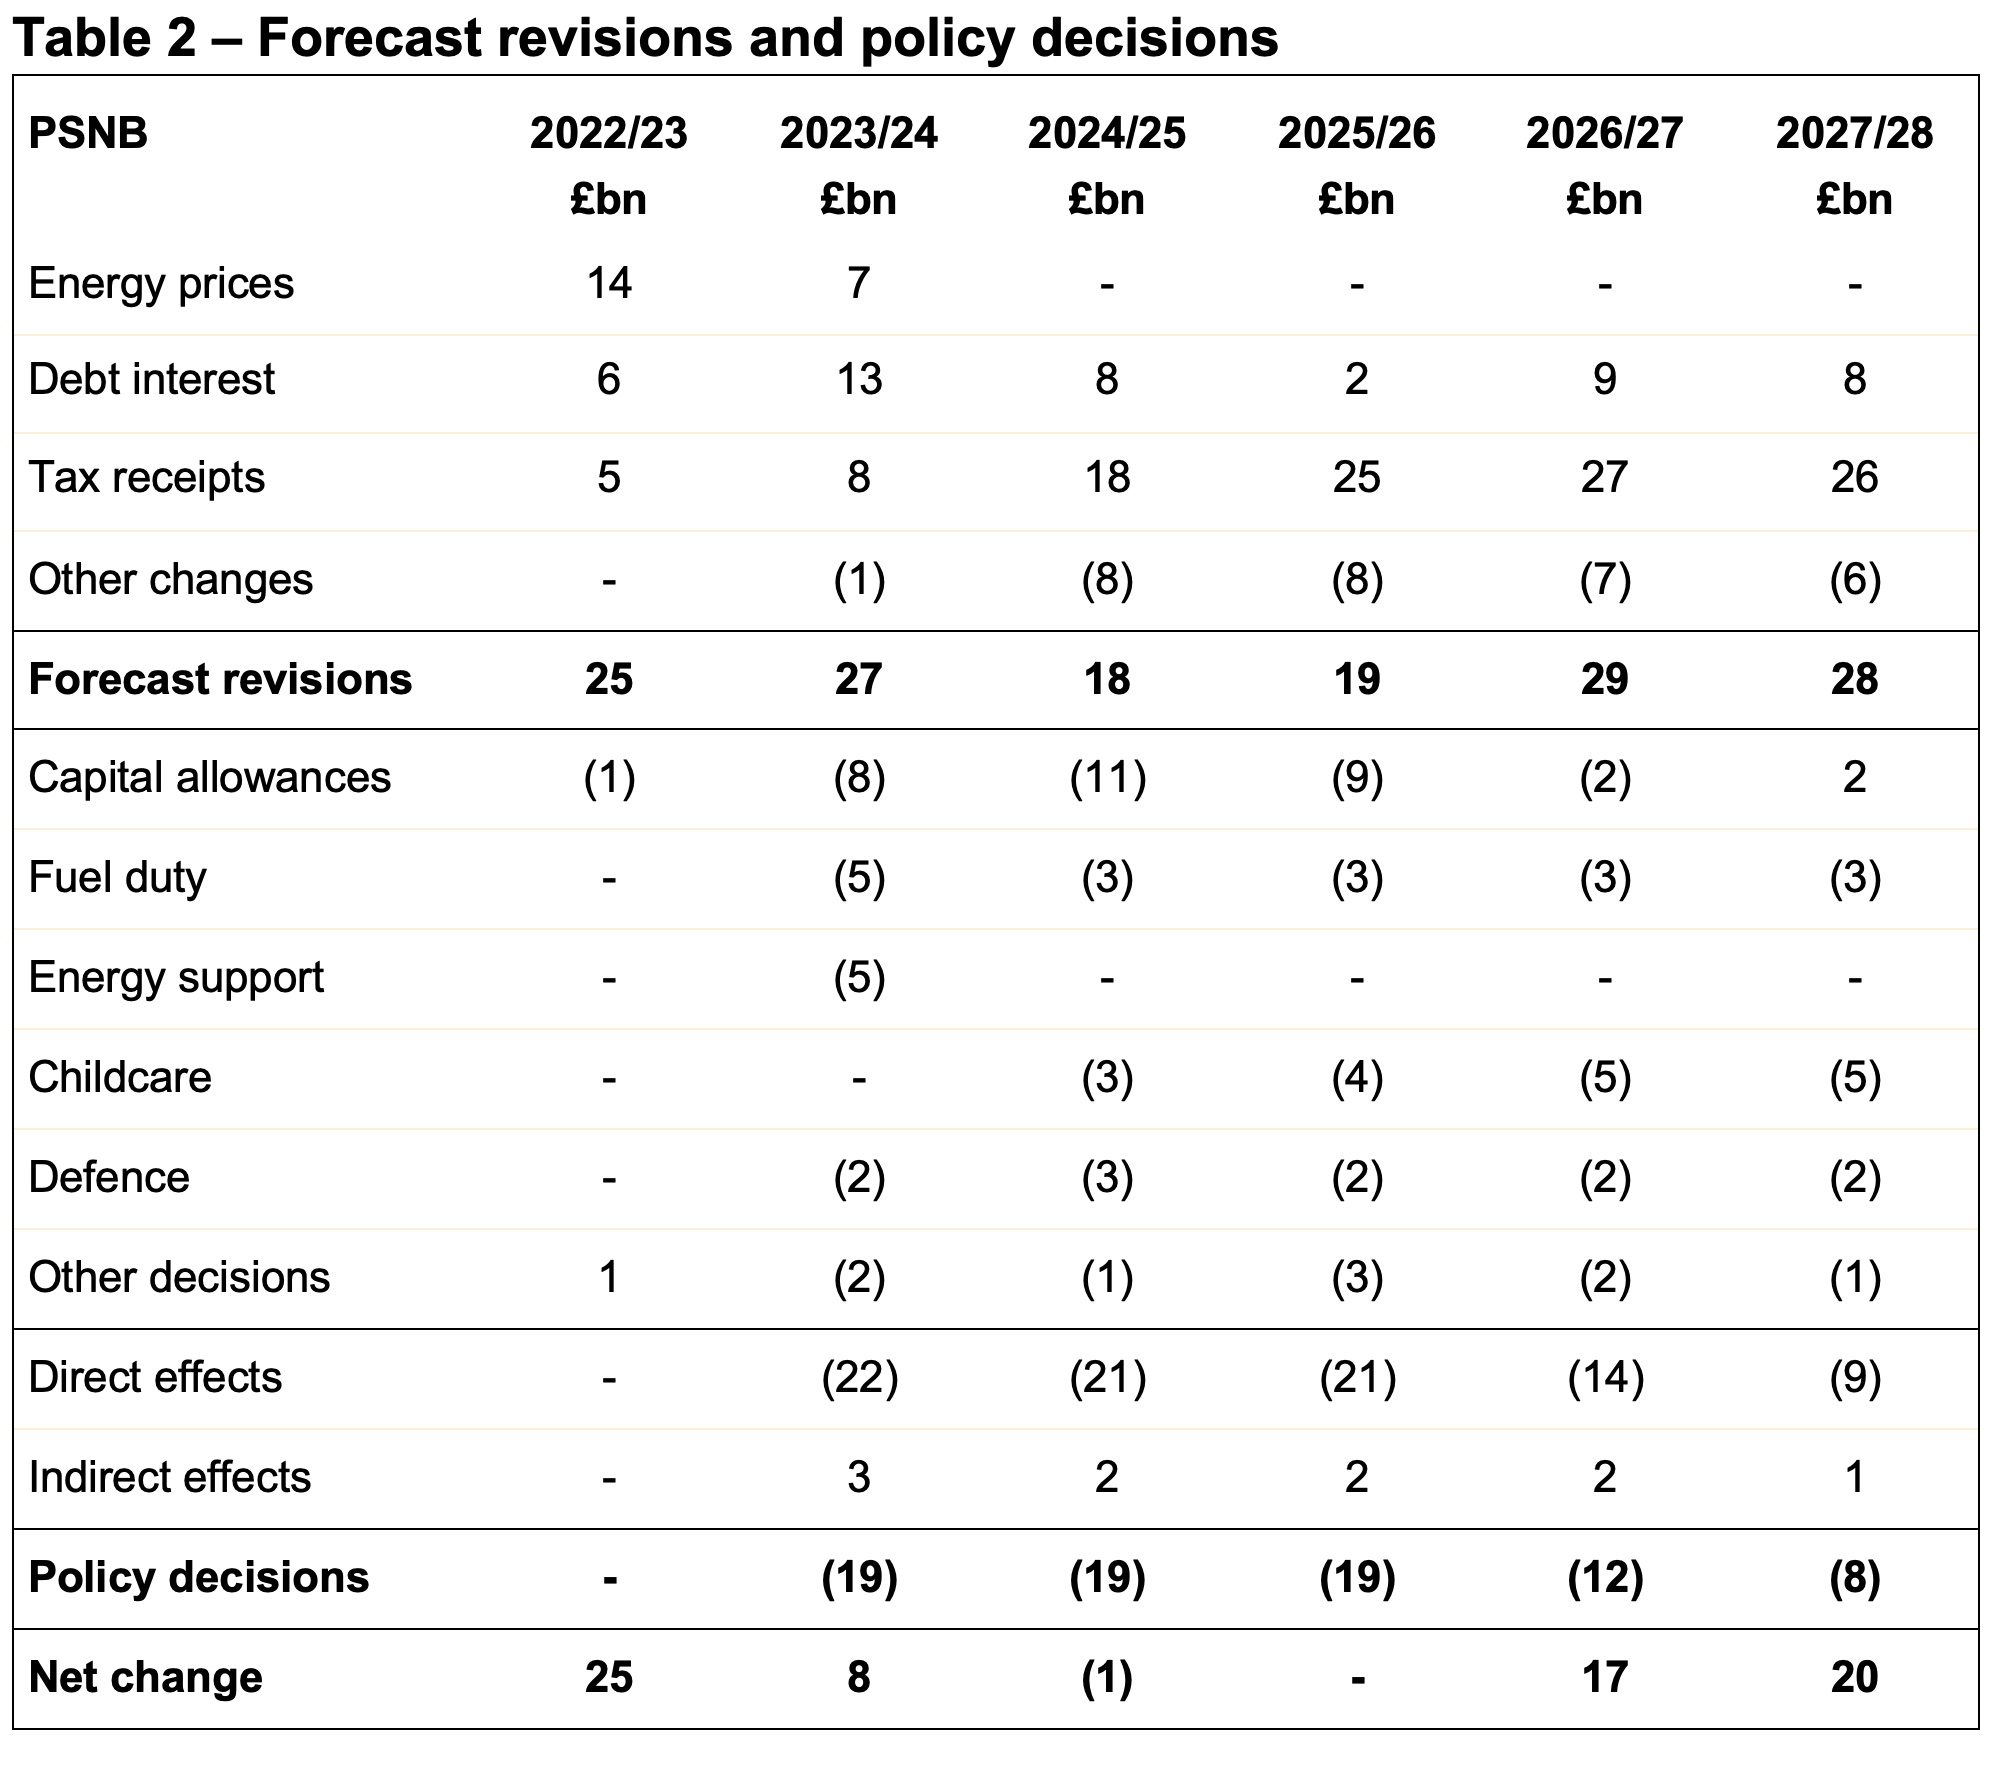
Table 2 provides a breakdown of the forecast changes by year, showing how lower debt interest and higher tax receipts flowing through the forecast period have provided the Chancellor with capacity to extend energy support, incentivise business investment, freeze fuel duty for yet another year (and extend the temporary 5p cut) and increase spending in specific areas.
Receipts and expenditure development
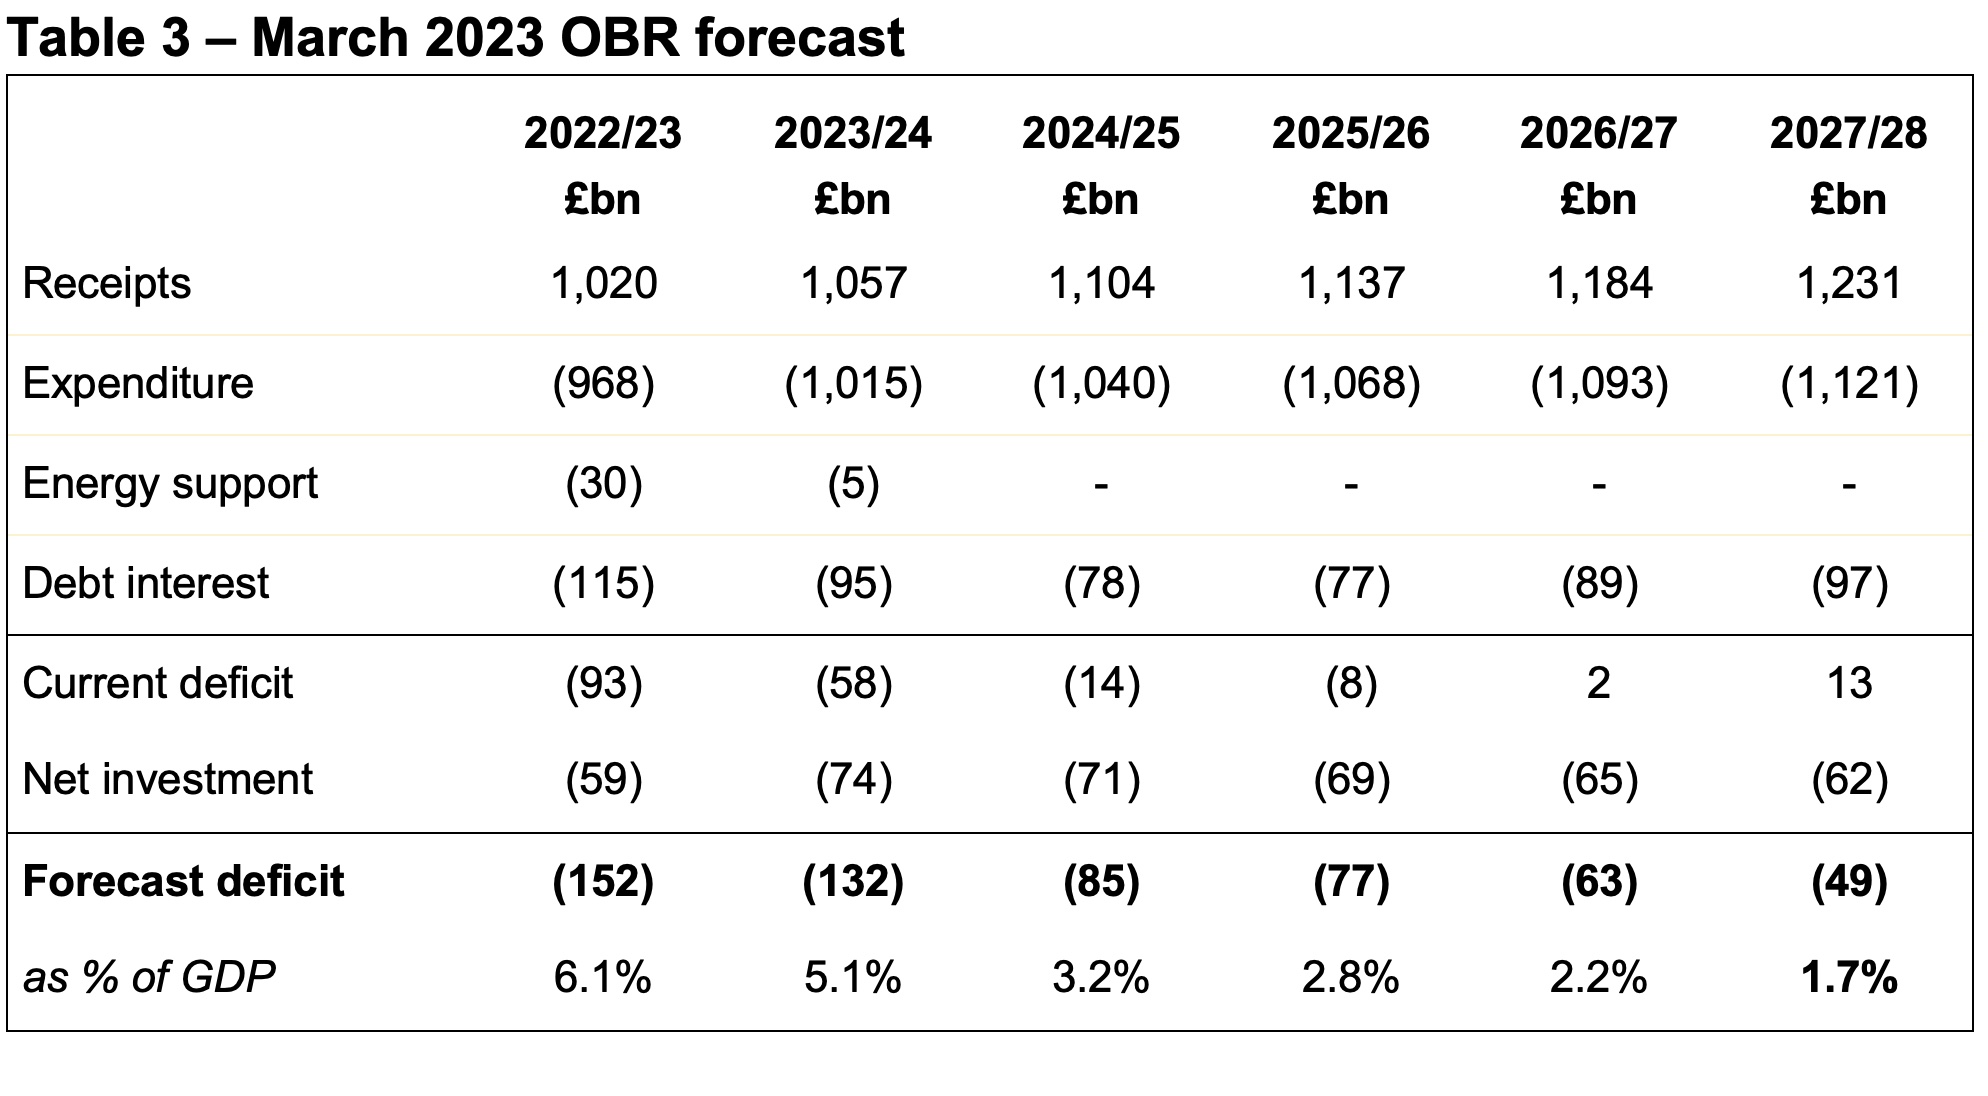
As illustrated by Table 3, receipts are expected to rise from £1,020bn in the current financial year to £1,231bn in 2027/28, while expenditure excluding energy support and interest is expected to rise from £968bn in 2022/23 to £1,121bn in 2027/28..
Interest costs are expected to fall from £115bn this year to £77bn in 2025/26 as interest rates and inflation moderate, before rising to £97bn in 2027/28 based on a growing level of debt.
Net investment is expected to increase in 2023/24 as an £8bn one-off credit from changes in student loan terms in 2022/23 reverses, before declining gradually as capital expenditure budgets flatline and depreciation grows. Public sector gross investment is planned to be £134bn, £134bn, £133bn, £132bn and £132bn over the five years to 2027/28, in effect a cut in real terms over the forecast period.
The government’s secondary fiscal target is to keep the fiscal deficit below 3% of GDP by the end of the forecast period. Based on the March 2023 forecasts, it has headroom of 1.3% of GDP, or £39bn, against this target.
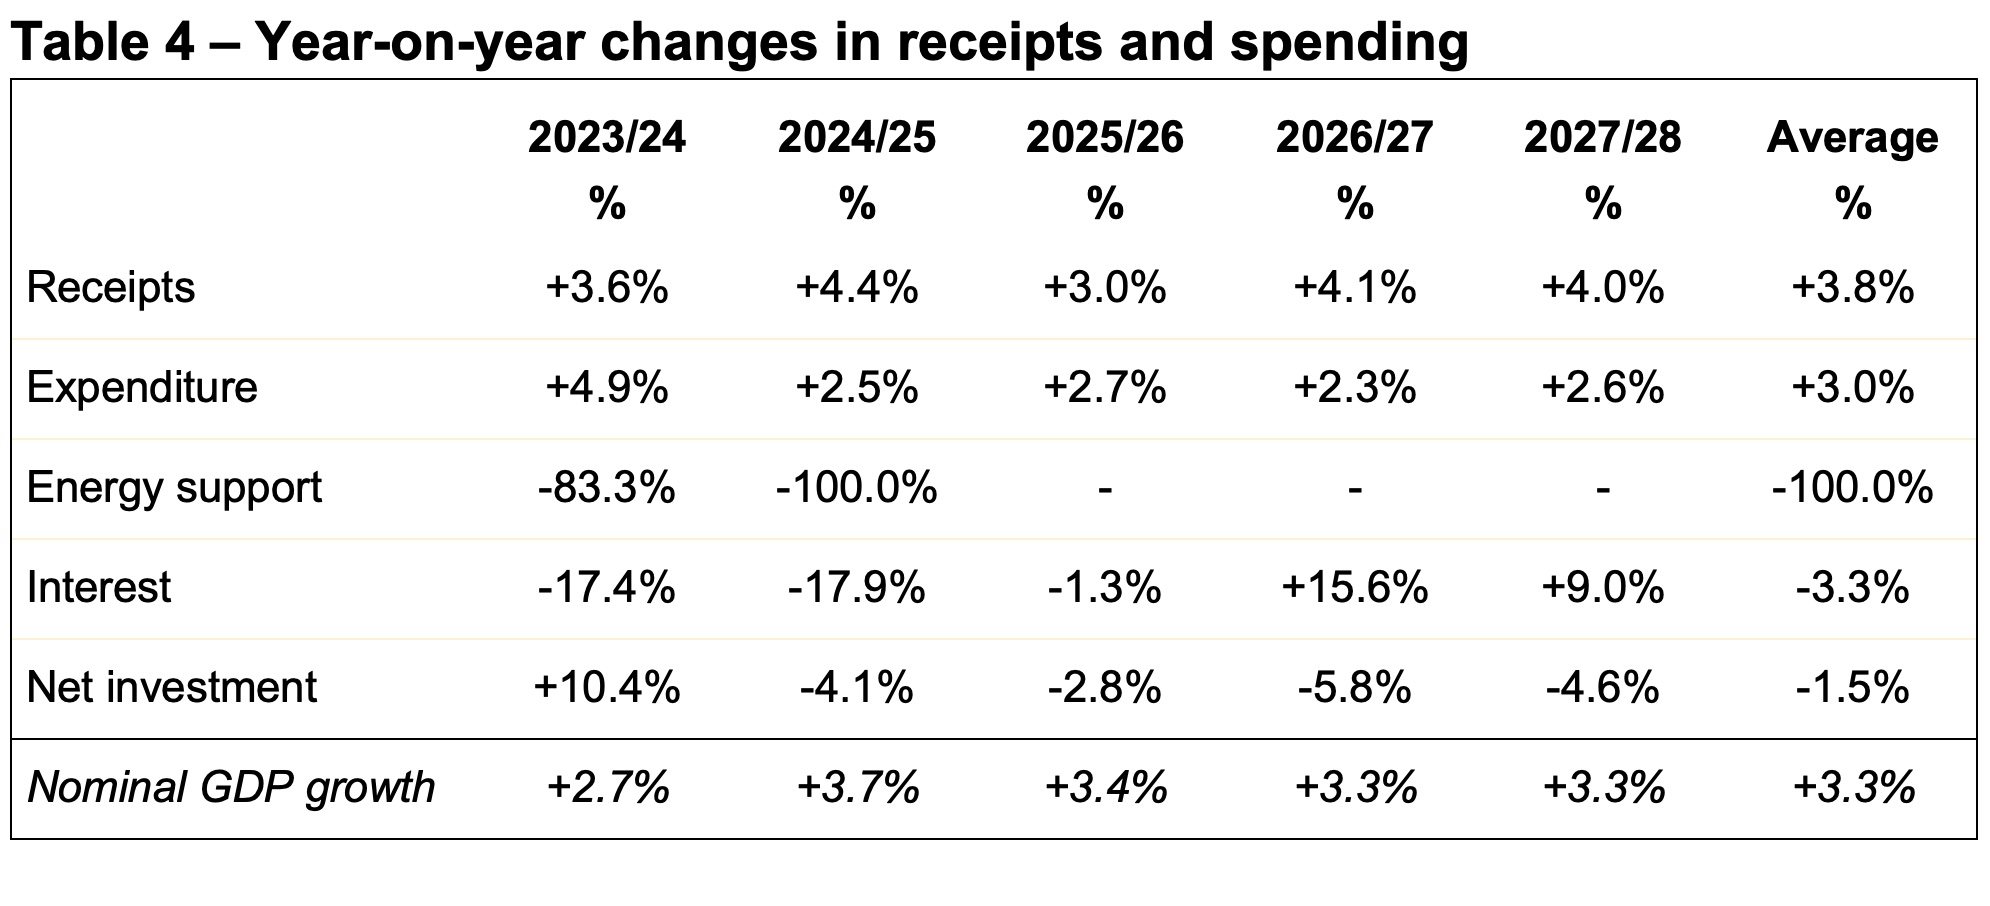
Table 4 provides a summary of the year-on-year changes in receipts and spending, together with the forecast for the increase in the size of the economy, including inflation. This highlights how tax and other receipts are expected to increase faster than the overall rate of growth in the overall size of the economy, while the government plans to constrain the average rise in expenditure excluding energy support and interest to 3.0% including inflation.
The former is principally a result of ‘fiscal drag’ as tax allowances are frozen, bringing in proportionately more in tax as incomes rise with inflation. The latter reflects what is generally considered to be unrealistic plans to constrain public spending in the context of an expected 9% rise in the number of pensioners over the five-year period (that will add to pensions, welfare, health and social care spending), pressure on public sector pay and the deteriorating quality of public services.
Average nominal GDP growth over the five years of 3.3% combines average real-terms economic growth of 1.7% a year and inflation of 1.6%, the latter using the GDP deflator, a ‘whole economy’ measure of inflation. This is different to consumer price inflation, which is forecast to fall to 4.1% in 2023/24 and average 1.4% over the five years to 2027/28.
Public sector net debt
Lower deficits over the forecast period translate into lower borrowing requirements, reducing forecasts for public sector net debt from just under £3.0trn to £2.9trn. This is partly increased or offset by changes in the forecasts for financial and other transactions and working capital movements.
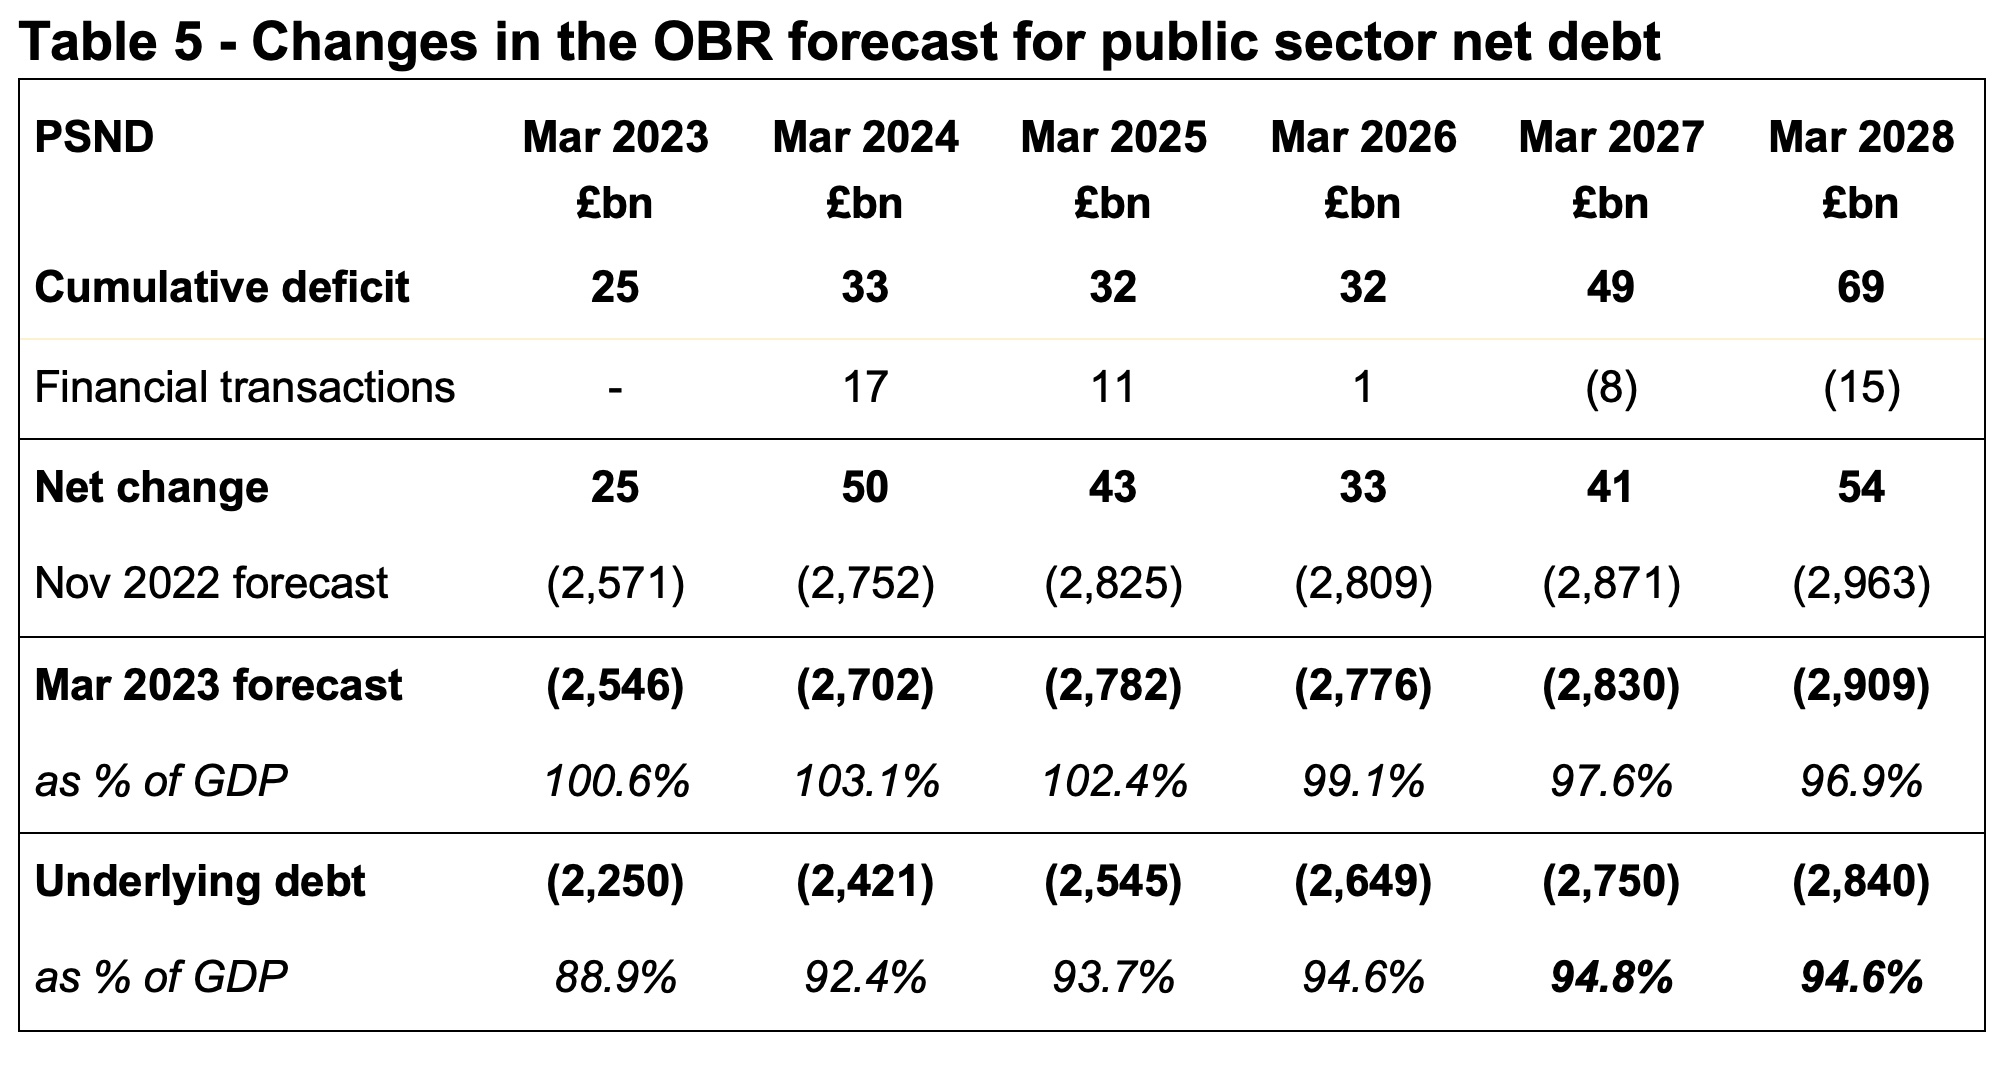
Table 5 shows how forecast public sector net debt is now expected to reach £2,909bn by March 2028, £54bn less than was forecast in November. Although an improvement, debt at the end of the forecast period is expected to be £1,089bn higher than £1,820bn reported for March 2020 before the pandemic, reflecting the large amounts borrowed during the pandemic, in addition to borrowing planned over the next five years.
The government’s primary fiscal target is based on ‘underlying debt’, a non-generally accepted statistical practice measure that excludes the Bank of England and hence quantitative easing balances. Underlying debt needs to be falling as a proportion of GDP between the fourth and fifth year of the forecast period.
The forecast gives the Chancellor just £6.5bn in headroom against this target, with underlying debt / GDP expected to fall from 94.8% to 94.6% between March 2027 and March 2028.
Fiscal rules limit ambitions for tax and spending
Following the disastrous ‘mini-Budget’ of his predecessor Kwasi Kwarteng, the Chancellor’s principal goal has been to stabilise the public finances to provide confidence to debt markets. To do this he has prioritised meeting his fiscal rules over incentivising business investment, cutting taxes and increasing defence spending. He has also adopted what are generally considered to be unrealistic assumptions about public spending in the later years of the forecast to keep within his self-imposed fiscal rules.
This has led to the Chancellor announcing ‘ambitions’ to extend the full expensing of capital expenditure beyond three years and to increase defence and security spending to 2.5% of GDP, as well as continuing to plan for increases in fuel duties each year despite the repeated practice of cancelling these rises.
Because these are ambitions and not plans, they are not incorporated into the forecasts enabling fiscal targets to be met. The OBR reports that continuing to cancel fuel duty rises each year would reduce the headroom to just £2.8bn, while converting the Chancellor’s ambitions to extend full expensing beyond three years and to increase defence spending to 2.5% of GDP into formal plans would cause him to breach his primary fiscal rule.
Conclusion
The overall fiscal position remains weak, with public finances vulnerable to potential economic shocks.
The Chancellor has followed the practice of many of his predecessors in increasing planned borrowing when fiscal forecasts worsen, as occurred in November 2022, only to then use upsides from improvements in subsequent forecasts to fund new tax and spending commitments. This ratchets up borrowing and debt as forecasts fluctuate and creates instability in both tax policy and public spending plans.
The consequence is a relatively unchanged fiscal position for the financial year commencing 1 April 2023 and the two subsequent financial years, as tax and spending decisions offset forecast upsides. And although there is an anticipated improvement in the projected fiscal position in the final two years of the OBR’s five-year forecast (after the next general election), the likelihood is that it will be offset in due course by the reality of pressures on public service and welfare budgets.
There is a reason why the first Budget following a general election typically sees taxes rise and the Spring Budget 2023 suggests that this pattern is likely to be repeated, irrespective of whichever party wins power.
My chart this week is on the Chancellor’s tax and spending plans for the coming financial year commencing on 1 April 2023.
Chancellor Jeremy Hunt presented his first Budget to Parliament on Wednesday 15 March 2023, setting out his formal Budget estimate for the financial year ended 31 March 2024 (2023/24) accompanied by fiscal forecasts from the Office for Budget Responsibility (OBR) for the period up to 2027/28 and the OBR’s final estimate for the current financial year ending on 31 March 2023.
Our chart this week starts by summarising the final estimate for 2022/23, highlighting an expected shortfall of £152bn between anticipated receipts of £1,020bn and spending of £1,172bn. This is followed by a similar analysis for the budget year of 2023/24, with a deficit of £132bn resulting from a shortfall between estimated taxes and other receipts of £1,057bn and spending of £1,189bn.
Receipts in 2022/23 and 2023/34 respectively comprise £922bn and £950bn in tax and £98bn and £107bn in other receipts. The increase in tax of 3.0% is perhaps lower than might be expected given the level of inflation and the new higher rate of corporation tax from 1 April 2023, with an anticipated 10% growth in corporation tax receipts (net of full expensing of business investment) offset by flat or relatively small growth in other taxes. Other receipts are expected to increase by 9%, primarily the effect of higher interest rates on investments.
Total managed expenditure in 2022/23 and 2023/24 respectively comprise £968bn and £1,015bn in current expenditure excluding energy support costs and debt interest, £30bn and £5bn in energy support packages, £115bn and £95bn in debt interest, and £59bn and £74bn in net investment.
Current expenditure excluding energy support costs and debt interest is expected to increase by 4.9% in 2023/24 compared with 2022/23, more than the 2.5% ‘whole economy’ measure of inflation used by the government and the 4.1% forecast for consumer price inflation. This partly relates to inflation in the current financial year feeding through into next year’s budgets, as well as spending measures announced by the Chancellor.
The three-month extension of the energy price guarantee is anticipated to cost £3bn in 2023/24, with other energy support measures adding a further £2bn to the forecast.
Debt interest is expected to fall by 17% to £95bn, principally because of the effect of a much lower rate of inflation on index-linked debt more than offsetting higher interest rates overall.
Public sector net investment comprises gross investment of £116bn and £134bn in the two years respectively, net of depreciation of £57bn and £60bn respectively. The increase in gross investment is flattered by a £8bn one-off credit in the current financial year arising from changes to student loans, which if excluded implies an 8% increase in capital expenditure and other public investment overall. This reflects delays in capital programmes that are expected to come in significantly under budget in the current financial year but cost more in the next, relatively high construction price inflation, and an extra £2bn of capital investment allocated to defence.
The final estimate for the deficit in the current financial year of £152bn is £25bn lower than was expected in the OBR’s November 2022 forecast of £177bn, while the Budget estimate for 2023/24 of £132bn is £8bn lower than the £140bn forecast last time. The reduction in 2022/23 reflects the benefit of a slightly improved economic outlook, with policy decisions for the last couple of weeks of the financial year by the Chancellor netting off to close to nil. This contrasts with 2023/24, where forecast upsides amounting to around £27bn have been mostly offset by a net cost of £19bn from tax and spending decisions.
Overall, the chart highlights just how much money the UK raises in tax and incurs in public spending. Tax and other receipts are expected to approach £1.1trn in the coming financial year, while public spending is anticipated to be just under £1.2trn.
On a per capita basis in 2023/24 this is equivalent to receipts and spending of approximately £1,290 per month and £1,450 per month for each person in the UK respectively, a shortfall of £160 per person per month that needs to be funded by borrowing.
The challenge for the Chancellor is that with the number of pensioners projected to increase by 9% over the next five years (with consequent implications for spending on pensions, welfare, health and social care), there is not much room to invest in public services or in infrastructure at the same time as also reducing taxes as he would very much like to do.
The Chancellor wasn’t able to square this circle in the Spring Budget 2023, so watch this space to see whether he can be any more successful in future fiscal events.
Ahead of the Spring Budget on 15 March, I take a look at how the official forecast for the 2022/23 fiscal deficit has fluctuated through successive forecasts.
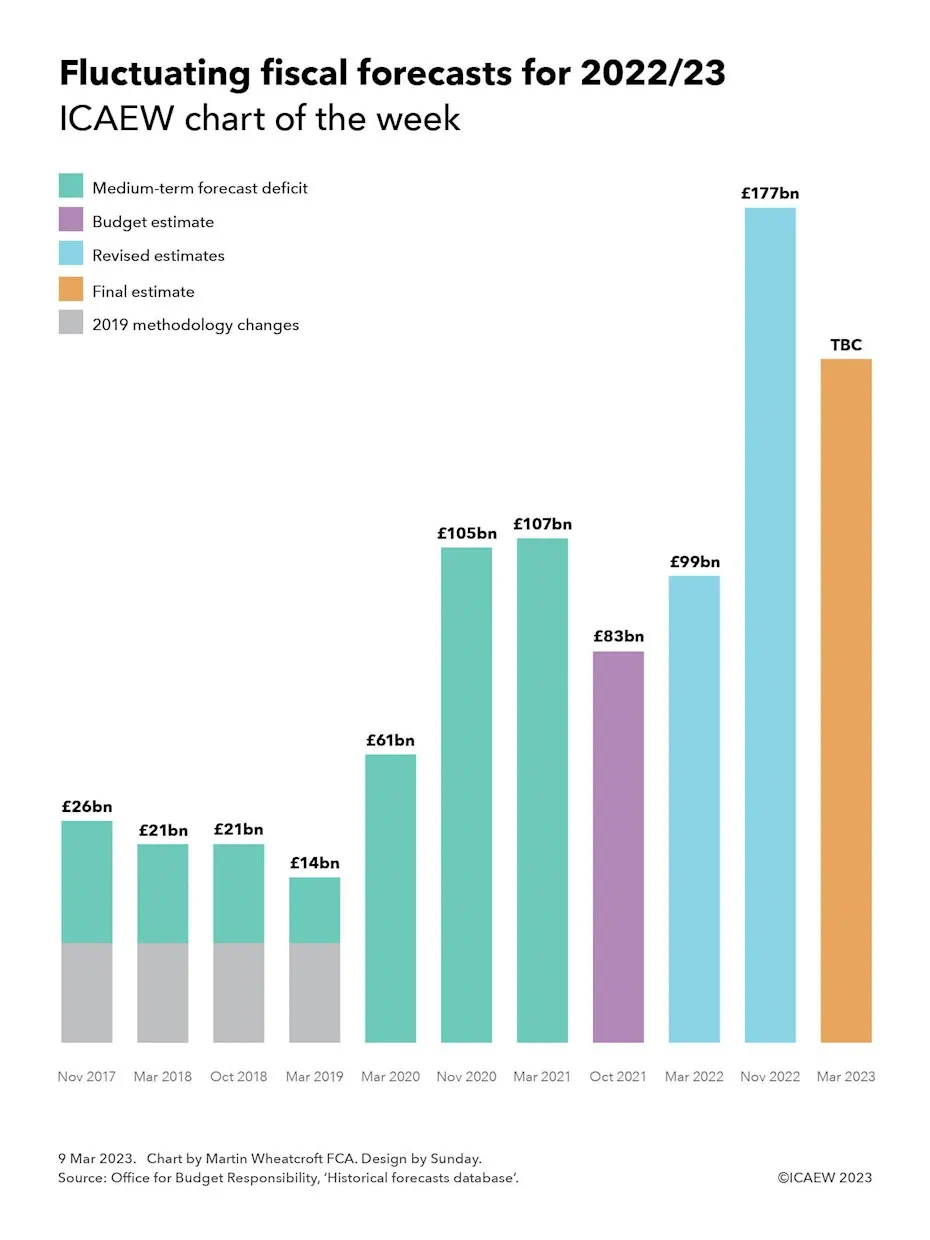
My chart this week is on the topic of fiscal forecasting, and how the forecast deficit for the UK government’s financial year ending 31 March 2023 (2022/23) has changed over the course of five or so years of official forecasts.
Our story starts with the Autumn Budget in November 2017, when the Office for Budget Responsibility (OBR) first published a medium-term fiscal forecast that extended to 2022/23. After plugging economic assumptions into its model and combining it with the government’s plans for public spending, it came up with a forecast of £26bn for the 2022/23 fiscal deficit, the shortfall between receipts and public spending calculated in accordance with statistical rules.
Then Chancellor Philip Hammond was at that time pretty positive about the economic prospects for the UK, despite weak productivity causing him to abandon the government’s medium-term plan to completely eliminate the budget deficit. Instead, he settled for a more modest objective of a balanced current budget and a falling debt-to-GDP ratio, extending austerity policies to cut public spending.
The next few fiscal events saw the OBR revise down its forecast for the 2022/23 deficit in the light of moderately better economic data each time. This saw the forecast for the 2022/23 deficit reduce to £21bn in the March 2018 forecast, stay at £21bn in October 2018 and fall to £14bn in the March 2019 forecast.
The forecasts up to this point were before methodology changes announced in 2019 relating to the treatment of student loans and other items. According to the OBR these had the effect of increasing the forecast for the fiscal deficit in 2022/23 by an estimated £21bn.
The calling of a general election in December 2019 prevented Chancellor Sajid Javid from presenting a Budget in November 2019, so the OBR had to wait until March 2020 to publish its next forecast. At this point, 2022/23 was in the middle of the forecast period and Rishi Sunak’s first fiscal event as Chancellor saw a £26bn increase in the 2022/23 deficit to £61bn in an ‘end-to-austerity’ Budget that saw £46bn in extra planned spending compared with previous forecasts.
Frustratingly for the OBR, its forecasts that day were immediately out of date, as initial emergency pandemic measures were decided too late to be incorporated into its calculations. While these and subsequent temporary measures to support households and businesses through the pandemic primarily affected the 2020/21 and 2021/22 financial years, the economic hit caused by COVID-19 was the primary reason for the OBR increasing its forecast for the 2022/23 fiscal deficit to £105bn in November 2020.
March 2021 saw a small tweak to the forecast to £107bn, but the Autumn Budget and Spending Review in November 2021 saw an improvement to £83bn as the economy emerged from the lockdown phases of the pandemic in a slightly better place than was previously anticipated, with higher spending funded by planned tax rises.
This positive move went into reverse in March 2022 as the OBR revised its Budget estimate upwards to £99bn, reflecting rising interest rates on government debt and the government’s initial response to an emerging cost-of-living crisis.
The OBR was not asked to produce an official forecast to accompany short-lived Chancellor Kwasi Kwarteng’s tax-cutting ‘mini-Budget’ in September. At £177bn the OBR forecast for the 2022/23 fiscal deficit in November 2022 was eye-watering enough, and that was after current Chancellor Jeremy Hunt’s Budget had reversed most of his predecessor’s tax cuts.
Lower than anticipated wholesale energy prices have led several commentators to suggest that the OBR’s final estimate for the fiscal deficit could be revised down by £30bn or more when it presents its medium-term forecasts up to 2027/28 to accompany the Spring Budget on 15 March 2023. As the chart suggests, this is not a ‘windfall’ as some commentators have claimed. Even if the gap between receipts and spending narrows, the deficit will still be significantly higher than the £83bn official estimate included in the Budget for 2022/23 presented to Parliament.
Fiscal forecasting is of course a very difficult task even in normal times. The deficit is the difference between two very large numbers – receipts of just over a trillion pounds and public spending of nearly £1.2trn – that can each move up or down significantly as economic conditions change, and policy choices are made. Add to that a global pandemic, a cost-of-living crisis and an uncertain policy outlook, and it is perhaps unsurprising that the forecasts have changed so much over the past five years.
In an uncertain world, fiscal forecasts fluctuate.
My chart this week looks at what a difference one year has made to the cost at which governments around the world can borrow.
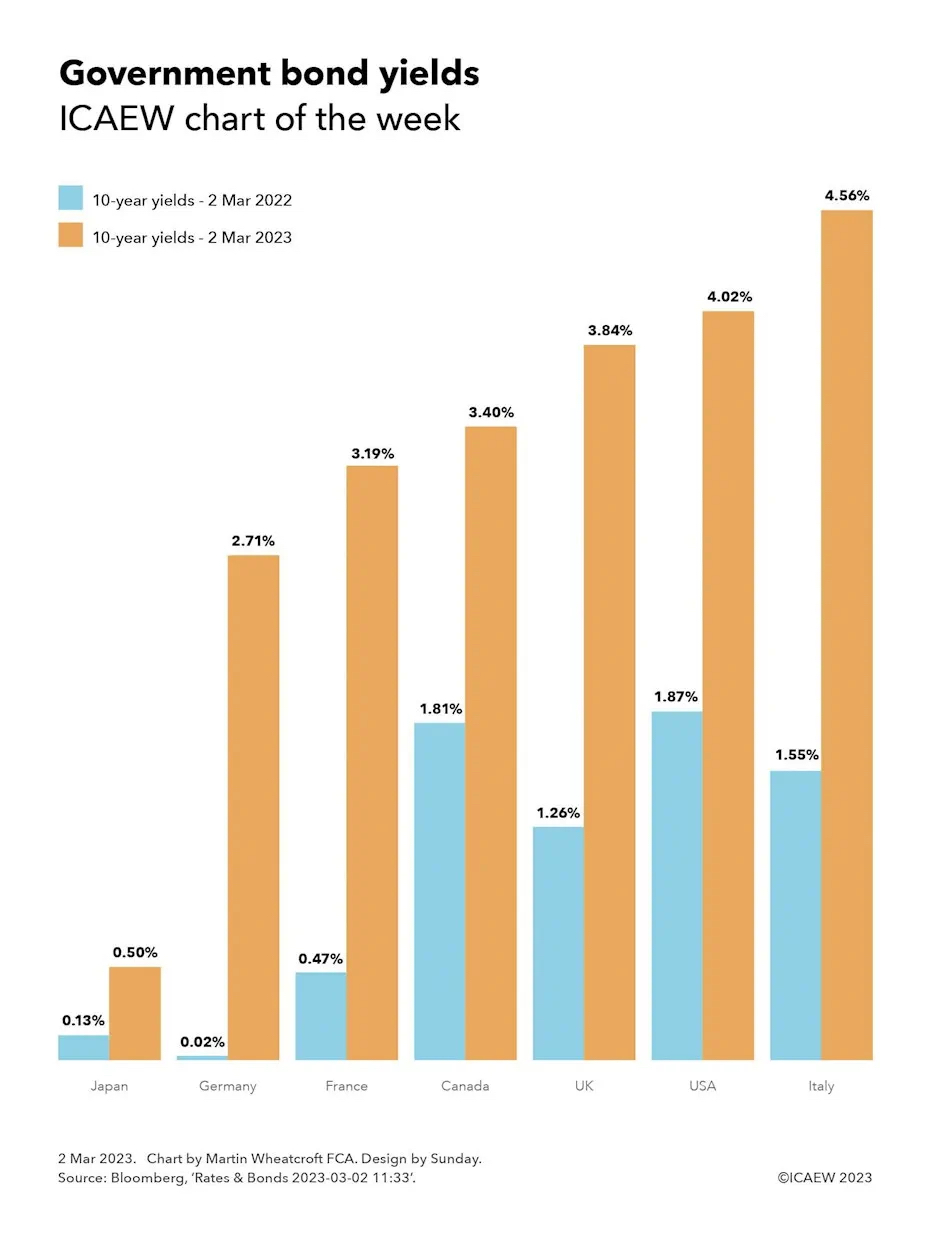
The past year has seen a dramatic change in economic fundamentals around the world as inflation has surged and growth has stuttered. One of the most dramatic changes has been to the cost of new government borrowing, with the yields payable by governments to sovereign debt investors increasing significantly from where they were a year ago.
As our chart of the week illustrates, Japan has seen yields on 10-year government bonds increase from 0.13% on 2 Mar 2023 to 0.50% on 2 Mar 2023, a far cry from the negative yields it has obtained over much of the last decade when (in effect) investors were paying the government of Japan for the privilege of lending it money. The change for Germany has been even more marked, from a position a year ago where it could borrow over 10 years for almost nothing (0.02%) to today where if it wanted to raise new funds it would pay an interest rate of 2.71% over 10 years.
The other members of the G7 have also seen the effective interest rate payable on 10-year government bonds rise, with France going from 0.47% a year ago to 3.19% today, Canada from 1.81% to 3.40%, the UK from 1.26% to 3.84%, the USA from 1.87% to 4.02%, and Italy from 1.55% to 4.56%.
Yields from 10-year government bonds are seen as a benchmark rate for most countries, as although governments can and do borrow for much longer periods – with market data often available for 20-year and 30-year bonds as well – most countries have average maturities of much shorter periods. The UK is an outlier in this respect with an average debt maturity on government securities of just over 15 years (before taking account of quantitative easing), in contrast with the more typical average maturity of seven years for Italian government debt.
Although the amount payable on new debt has risen significantly, this should in theory feed in to overall cost of government borrowing gradually as it will take time for existing government bonds to mature and be refinanced. For some time to come the overall cost of borrowing will continue to benefit from medium- and long-term government bonds that were issued at the ultra-low borrowing rates experienced over the last decade or so.
However, in practice not all government borrowing is at fixed rates, with many governments (including the UK) issuing inflation-linked debt, adding to their interest costs as inflation has surged. In addition, some government debt is short term or pays a variable rate of interest, while quantitative easing has seen central banks swap a substantial proportion of fixed-rate government bonds into variable-rate central bank deposits, increasing governments’ exposure to changes in short-term interest rates.
Either way, the rapid rise in the interest rates payable on sovereign debt marks a significant shift in the fiscal calculus for most governments when combined with much higher levels of debt in most developed countries. Lots more pounds, euros, dollars and yen will need to be diverted to servicing debt, making for hard choices for finance ministers as they work out their budgets for coming years.
My 250th chart of the week for ICAEW takes a look at the recently published Financial Report of the United States Government for the year ended 30 September 2022 and how net liabilities have increased by 67% to $34trn over the past five years.
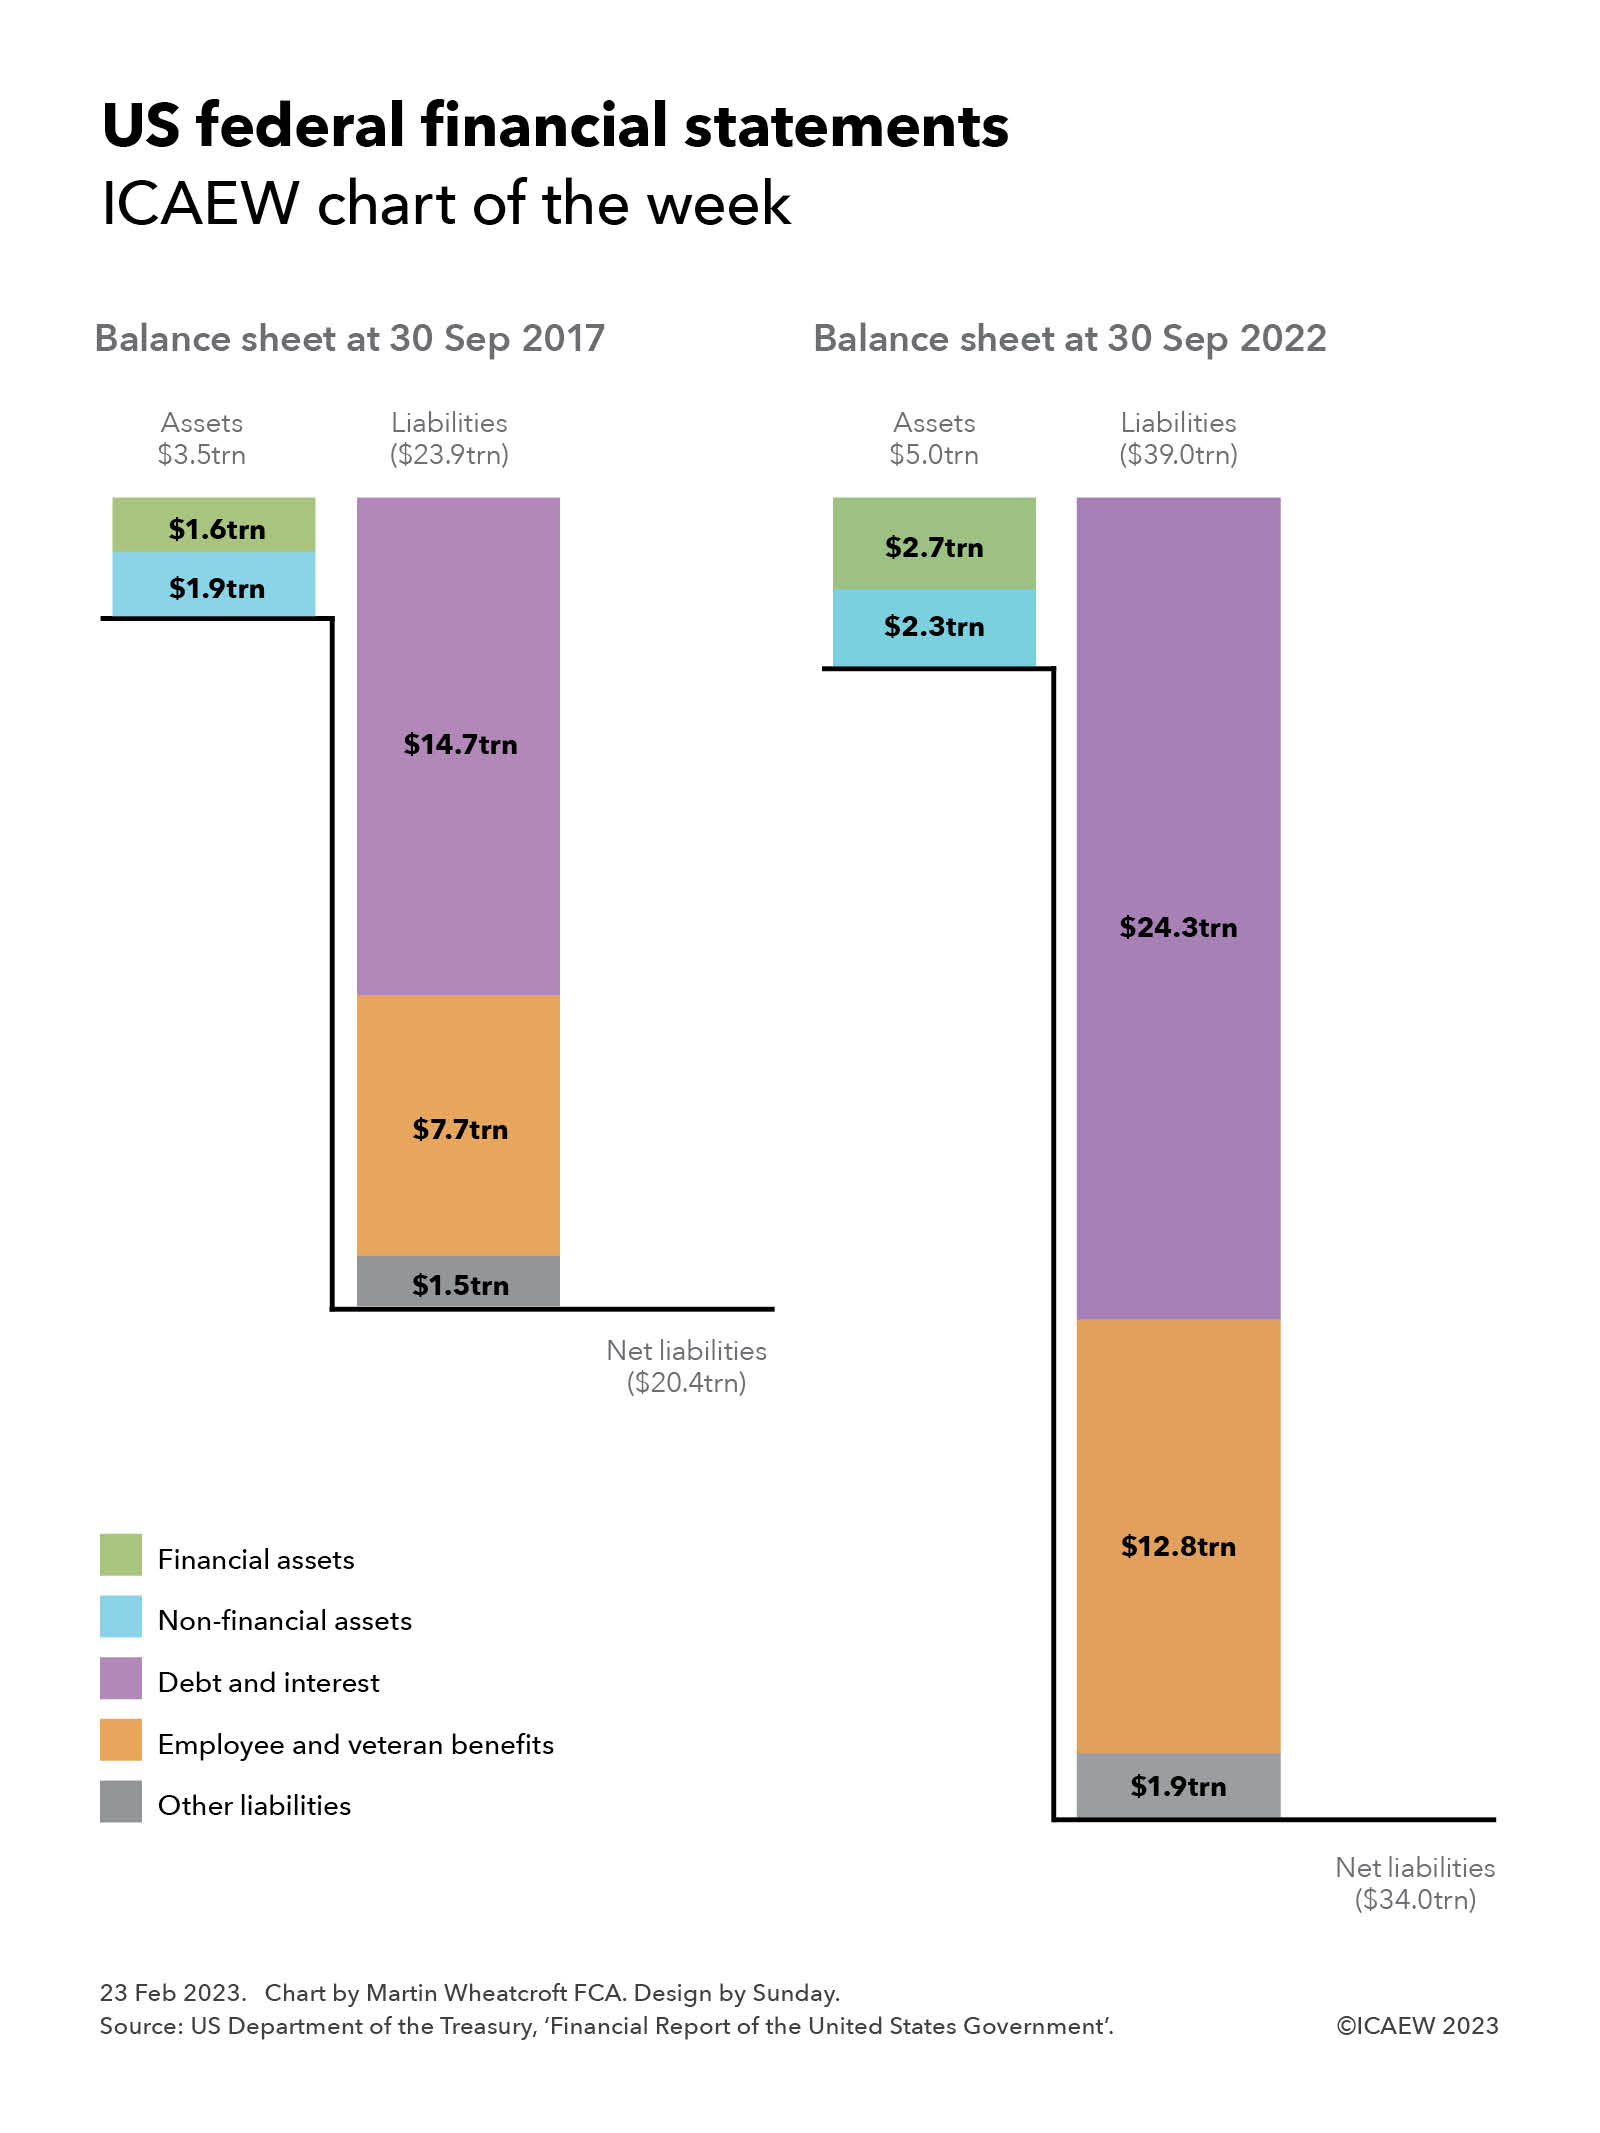
This week’s chart takes a dive into the latest financial statements of the United States Government for the year ended 30 September 2022 that were published on 16 February 2023, illustrating how the consolidated balance sheet of the executive, legislative and judicial branches has changed over the last five years.
The federal government reported net liabilities of $20.4trn at 30 September 2017, comprising $3.5trn in assets ($1.9trn non-financial and $1.6trn financial) less $23.9trn in liabilities ($14.7trn debt and interest, $7.7trn employee and veteran benefits and $1.5trn other liabilities).
By 30 September 2022, net liabilities had increased by 67%, from $13.6trn to $34.0trn, comprising $5.0trn in assets ($2.3trn non-financial and $2.7trn financial) less $39.0trn in liabilities ($24.3trn debt and interest, $12.8trn employee and veteran benefits and $1.9trn other liabilities).
The increase in net liabilities is a consequence of net accounting losses of $1.2trn, $1.4trn, $3.8trn, $3.1trn and $4.2trn for the five financial years up to 30 September 2022. These amounts are calculated in accordance with US generally accepted accounting principles (US GAAP) as adapted for government by Federal Financial Accounting Standards (FFAS) issued by the Federal Accounting Standards Advisory Board (FASAB). They differ from cash budget deficits (outlays less receipts) of $0.8trn, $1.0trn, $3.1trn, $2.8trn and $1.4trn over the same period.
Revenue in the year ended 30 September 2022 of $4.9trn comprised $4.0trn from individual income taxes and tax withholdings, $0.4trn in corporate income taxes and $0.5trn in other taxes and receipts. The net cost of government operations amounted to $9.1trn, comprising $7.4trn in gross costs less $0.5trn in fees and charges plus $2.2trn from changes in assumptions. The latter primarily relate to employee and veteran benefit obligations that are on the balance sheet in the US GAAP numbers.
The scale of the negative balance sheet and continued deficit financing highlight just how dependent the US federal government is on its ability to borrow money as needed to meet its financial obligations as they fall due, and why the current challenge in raising its self-imposed debt ceiling is starting to concern markets.
This is the 250th ICAEW chart of the week, a milestone that has crept up on us as we seek to share insights into the economy and public finances that we hope are of interest to ICAEW members and all our other readers. Many thanks for your continued interest and we look forward to providing you with many more nuggets in the future.
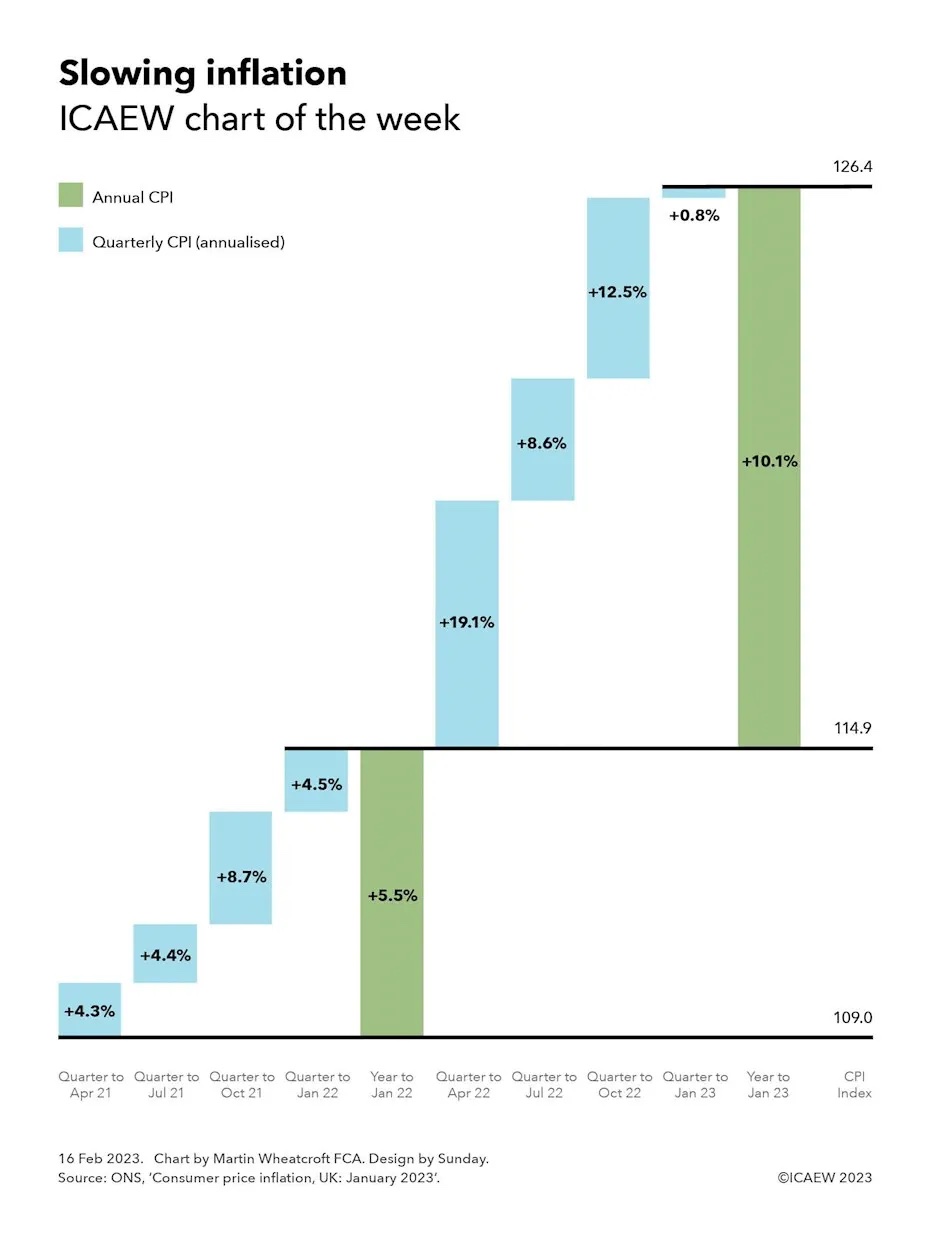
My chart this week illustrates the slowing rate of inflation and how it should fall further once a big surge in prices between February and April 2022 falls out of the year-on-year comparison.
The Office for National Statistics (ONS) reported that the annual rate of consumer price inflation (CPI) was 10.1% in January 2023, falling from 10.5% last month and down from a peak of 11.1% in October 2022, but much higher than the 5.5% annual rate of inflation for the year to January 2022.
Our chart breaks down annual inflation over the past two years to January 2023 into quarters, highlighting how inflation is likely to fall quite rapidly over the next three months as the big surge in prices following Russia’s invasion of Ukraine last year falls out of the year-on-year comparison.
Reported inflation this time last year was 5.5% for the year to January 2022. This can be broken down into quarterly rises (annualised) of 4.3% in the three months to April 2021, 4.4% in the quarter to July 2021, 8.7% in the quarter to October 2021 and 4.5% in the three months to January 2022. Inflation in that period was well above the Bank of England’s target range of 1% to 3%, as supply constraints drove prices higher as the domestic and global economies started to recover from the depths of the pandemic.
Reported inflation for the year to January 2023 of 10.1% can be broken down into quarterly rises (annualised) of 19.1% in the quarter to April 2022, 8.6% in the quarter to July 2022, 12.5% in the quarter to October 2022 and 0.8% in the three months to January 2023. The sharp jump in prices in the period from February to April 2022 was driven by a rapid rise in energy prices following Russia’s invasion of Ukraine that added to existing inflationary pressures, turbo charging the rate of inflation. Since then, prices across the economy have risen rapidly, although with wholesale energy prices retreating from their peak recently, the overall rate of price rises has slowed down significantly in the last quarter.
The chart also shows how the consumer price inflation index (the CPI Index) increased from 109.0 in January 2021 to 114.9 in January 2022 and to 126.4 in January 2023.
The chart doesn’t show the intermediate annual rates of inflation, although these can be calculated using the geometric average of the preceding four quarters. The annual rate increased from 5.5% in January 2022 to 9.0% in April 2022, then to 10.1% in July 2022 before reaching a peak of 11.1% in October 2022, following which it fell to 10.1% in January 2022.
Successively dropping quarters from the previous year out of the year-on-year comparison and replacing them with price rises over the most recent quarter saw inflation rise as quarterly rises (annualised) of 4.3% fell out to be replaced by 19.1%, 4.4% by 8.6%, and 8.7% by 12.5%, before inflation fell over the last three months as 4.5% was replaced by 0.8%.
These ‘base effects’ mean that most commentators expect a sharp slowdown in the annual inflation rate over the next nine months as monthly and quarterly price rises over that time should be much lower than the comparatives falling out of the year-on-year calculation. The biggest fall is expected over the next three months, as even with a sizeable rise in domestic energy prices expected in the month of April 2023 as government support is withdrawn, price rises are expected to be much lower than the 19.1% annualised rate seen in the quarter to April 2022.
While the medicine of higher interest rates is no doubt playing a key part in restraining prices from rising as fast as they did last year, the Bank of England knows that arithmetic should be the biggest contributor to inflation coming down over the course of 2023.
My chart this week illustrates the choppy economic waters facing UK businesses as more stopped trading than were created over the course of 2022.
The Office for National Statistics (ONS) published its latest quarterly experimental statistics on business births and deaths on 2 February 2023. This reports that business closures have increased since before the pandemic at the same time as business creations have fallen, resulting in net reductions in the number of VAT- or PAYE-registered businesses operating in the UK over the past six quarters.
The statistics are taken from the government’s Inter-Departmental Business Register, a database of approximately 2.8m businesses registered for either PAYE or VAT, just over half of the estimated 5.5m businesses operating in the UK (according to the Department of Business & Trade). The difference principally relates to sole traders with turnover below the VAT threshold who have not voluntarily registered for VAT, or for PAYE if they trade through a company. There is also a time lag on reporting the closure of businesses where a business continues to be registered, with the ONS waiting for several periods of zero VAT or zero payrolls before recording a business as closed.
The statistics are labelled as experimental because they are not as rigorous as annual statistics, but the advantage is that they provide data on business births and deaths in 2022, for which we will not get a full set of annual numbers until towards the end of this year.
As our chart illustrates, the quarterly net change in businesses in 2017 was +18,390, -15,460, +3,825 and +6,320 respectively, followed by +1,520, +15,165, +13,750, +4,365 in 2018, +19,120 and +4,265, +10,530 and +9,980 in 2019. The pandemic saw a fall in business closures as government support enabled businesses that would otherwise have stopped operating to stay alive, with a net decrease of -6,750 in Q1 2020 followed by net increases of +750, +16,170, +3,115 in the second, third and fourth quarters of 2020.
A spurt in business creations in early 2021 saw net increases of +15,245 and +2,885 in the first two quarters, before net decreases of -2,070 and 7,170 in the last two quarters of 2021. With pandemic support measures coming to an end and the onset of the energy crisis, the trend moved further into negative territory with quarterly net closures of -11,785, -5,930, -11,915 and -12,945 in 2022.
Quarterly business deaths averaged around 81,400 in 2017, 76,300 in 2018, 78,000 in 2019, 77,200 in 2020, 86,300 in 2021 and 91,800 in 2022, while quarterly business births averaged around 84,700 in 2017, 85,000 in 2018, 88,900 in 2019, 80,500 in 2020, 88,600 in 2021 and 81,200 in 2022.
These numbers will not be pretty reading for Kemi Badenoch, the new Secretary of State for Business and Trade. With interest rates on the rise, energy costs still at very high levels and consumers cutting back on spending, the risks are that many more existing businesses will cease trading, while business creations may continue to be subdued.
One crumb of comfort is that businesses founded during downturns are believed to do better than those founded in good times. So, if you are thinking of striking out on your own with a new business idea, there may be no better time than now.