New funding package for English local authorities

2 July 2020: Secretary of State Robert Jenrick has announced a new £2bn package for English councils to replace lost income and cover spending pressures.

The government has announced additional funding for local authorities in England to help alleviate the financial pressures they are under. This follows on from our previous article on council funding pressures, which reported that total lost income and additional expenditure could amount to £9.4bn by next March.

The funding package announced today comprises £500m to cover incremental expenditures being incurred by councils – adding to the £3.2bn already provided – together with a reimbursement scheme covering up to 71% of lost income from sales, fees and charges.

The reimbursement scheme kicks in where losses are more than 5% of a council’s planned income from sales, fees and charges. The government will cover 75% of the lost income above 5%, meaning that councils will need to cover around 29% of the shortfall from their own resources. Depending on the final details, councils could receive somewhere in the order of £1.5bn and £2bn to replace lost income.

The Ministry of Housing, Communities & Local Government (MHCLG) also announced that councils would be able to phase repayments of council tax and business rates deficits over three years rather than one, reducing cashflow pressures on councils. However, the apportionment of irrecoverable council taxes and business rates will not be decided until the Spending Review in the autumn.

This announcement should significantly reduce the risk of councils needing to issue s114 ‘bankruptcy’ notices – for the next few months at least.

Commenting on the announcement Alison Ring, ICAEW Public Sector Director, said: “Although the new funding won’t cover all the expenditure and lost income councils have suffered due to coronavirus, it should be enough to help most get through the rest of the summer, and the prospects of some having to declare themselves bankrupt with s114 notices should recede for now. 

However, we’re concerned that councils will still have to cut back spending to cover the lost income from areas such as car parking, leisure centres, planning fees and other charges that are not being covered by central government. This has the potential to damage local economies just as they are trying to recover.”

This article was originally published by ICAEW.

Local authorities running out of money as COVID costs mount

2 July 2020: English councils have warned that £6bn more funding may be needed to keep operating through the rest of the financial year.

Data collected by the Ministry for Housing, Communities & Local Government (MHCLG) from 339 local authorities in England indicates that councils expect lost income and additional expenditure as a consequence of the coronavirus pandemic to amount to a total of £9.4bn.

Many councils are warning that they may not be able to continue operating without further infusions of cash from central government. Although £3.2bn has been provided by central government to date, this has only covered lost income and additional expenditure incurred up to the end of May 2020, with councils forecasting a further impact of £6.2bn over the remainder of the financial year.

Table 1 – English local authorities: financial impact of the coronavirus pandemic

 March
2020
£bn
April & May
2020
£bn
Forecast to
March 2023
£bn

Total
£bn
Lost income  0.17 1.82 3.70 5.69
Additional expenditure 0.08 1.17 2.46 3.71
Total covid-19 impact 0.25 2.99 6.16 9.40

Source: Ministry of Housing, Communities & Local Government, ‘Local authority COVID-19 financial impact monitoring information’.

Lost income is expected to reach in order of £5.7bn overall, while additional expenses are forecast to reach around £3.7bn. Further detail is provided in Table 2 and Table 3 below. 

With no additional funding as yet forthcoming, councils have been using their reserves to cover shortfalls during June. A number of local authorities are now discussing the possibility that that they may have to issue s114 ‘bankruptcy’ notices, which would require them to freeze all non-statutory expenditures, severely affecting local services.

The Chancellor is expected to announce further financial measures when he updates the nation next week and councils are hoping this will include more funding from central government in line with the encouragement they received at the outset of the lockdown to “do whatever it takes”.

Alison Ring, director for public sector at ICAEW, commented: “These numbers from English local authorities highlight just how severe the financial impact of the coronavirus pandemic has been. The £3.2bn in additional funding from central government announced so far is only a third of the estimated total of £9.4bn in lost income and additional expenditure expected to be incurred.

There is a risk that without clarity on further funding that some councils will start issuing s114 ‘bankruptcy’ notices. This would significantly reduce spending by local authorities at the same time that local economies need every bit of help they can get if they are to fully recover.”

Table 2 – English local authorities: lost income

 March 2020
£bn
April & May 2020
£bn
Forecast to
March 2021
£bn

Total
£bn
Business rates  0.03 0.44 0.72 1.19
Council tax 0.02 0.48 1.21 1.71
Sales fees and charges 0.08 0.65 1.15 1.88
Commercial income 0.03 0.17 0.45 0.65
Other 0.01 0.08 0.17 0.26
Lost income 0.17 1.82 3.70 5.69

Source: Ministry of Housing, Communities & Local Government, ‘Local authority COVID-19 financial impact monitoring information’.

Table 3 – English local authorities: additional expenditure

 March
2020
£bn
April & May 2020
£bn
Forecast to
March 2021
£bn

Total
£bn
Adult social care  0.03 0.50 0.97 0.50
Children’s social care 0.00 0.08 0.22 0.30
Housing (excluding HRA) 0.01 0.06 0.12 0.19
Environment and regulatory services 0.01 0.09 0.11 0.21
Finance & corporate services 0.01 0.08 0.11 0.20
Other service areas 0.02 0.36 0.93 1.31
Additional expenditure 0.08 1.17 2.46 3.71

Source: Ministry of Housing, Communities & Local Government, ‘Local authority COVID-19 financial impact monitoring information’.

This article was originally published by ICAEW.

UK aircraft carrier groups won’t be operating to full extent until 2026

26 June 2020: NAO reports on challenges remaining to the Carrier Strike programme, including cost overruns since their last report in 2017.

The National Audit Office (NAO) has published the latest in a series of challenging reports on defence procurement with a critique of the Ministry of Defence (MoD) programme to establish two fully operational carrier strike groups.

This is a complex multi-year effort that has seen the building of the HMS Queen Elizabeth and HMS Prince of Wales aircraft carriers at a cost of £6.4bn, the initial order of 48 fighter aircraft (out of a long-term plan for 138), and the planned integration of carriers, warships, radar systems and support ships with navy personnel into two fully combat capable carrier groups.

This report focuses on the last three years of development since 2017 – a period that has seen the Royal Navy complete and launch two new aircraft carriers, receive and test the initial batch of aircraft, construct essential on-shore infrastructure, and undertake extensive training of sailors and aircrew.

Key highlights from the report include:

  • There was a further cost overrun of £193m on building the two aircraft carriers, equivalent to 3% of their total cost of £6.4bn.
  • The MoD has spent £6.0bn to date on 48 Lightning II fighter jets, of which 18 have been delivered on schedule. Port and military airfield facilities have now been completed.
  • The Crowsnest airborne radar system is 18 months behind schedule, affecting carrier group capabilities in the first two years of operation.
  • The MoD delayed seven of its 48 jets on order to 2025 to accommodate budgetary pressures, with the approved cost now at £10.5bn, a £1.0bn or 15% increase.
  • Funding has not yet been made available for enough Lightning II jets to support the carriers through to the 2060s as planned, with no commitment as yet to order the remaining 90 jets.
  • The MoD has been slow to develop the support ships needed to operate carrier strike group, with only one ship currently in operation – with delays in ordering three new support ships potentially hampering operations until 2028 or later. The MoD has also not provided the necessary funding for logistics projects and munitions.

The NAO reports that the MoD is making progress in delivering key milestones, albeit with some caveats.

  • Initial operating capability for one carrier group and 12 jets is expected to be achieved by December 2020 on schedule, albeit with more basic radar capability than originally planned.
  • There is a tight schedule to deliver ‘full operating capability’ by 2023 (two carrier groups with up to 24 jets) and the planned extended capability by 2026 to deliver a wide range of air operations and support amphibious operations worldwide. 
  • Significant questions need to be answered about the place of the carrier groups within defence strategy, the investment prioritisation necessary to ensure that they can operate for the planned life-span of 50 years, and a clear understanding of the full costs of operating the carrier groups in the context of a Defence Equipment Plan that is currently unaffordable (as reported in several other NAO reports).

The NAO conclude by making a series of recommendations for strengthening programme management, ensuring there is a clear view of future costs, and on monitoring new governance arrangements that have recently been put in place. The NAO also recommends transferring lessons learned from the Carrier Strike programme over to other major defence projects.

Gareth Davies, the Comptroller & Auditor-General for the United Kingdom and the head of the NAO, commented on the good progress made by the MoD to deliver Carrier Strike. But he also stressed the need for greater attention to be paid to the supporting capabilities essential for full operability, and the need for the MoD to get a firmer grip on future costs.

Martin Wheatcroft FCA, advisor to ICAEW on public finances, said:

“In many ways, the MoD receives quite a positive report card from the NAO on the good progress that it has made over the last three years, improving on much less complementary reports in 2017 and before.

However, as the NAO reports, the MoD continues to struggle to deliver major procurement programmes within a defence budget that is unaffordable and there remain significant issues that need to be addressed. The extent to which further funding will be provided in the long-delayed Spending Review later this year is yet to be seen.”

The NAO report Carrier Strike – Preparing for deployment is available on the NAO website.

This article was originally published on the ICAEW website.

ICAEW chart of the month: Cabinet government

26 June 2020: The prime minister has announced a reduction in the number of government departments. How big is the cabinet compared to the rest of the world?

The news that the UK Government is reducing the number of government departments by one prompts the #icaewchartofthemonth to take a look at the size of government executives across the world.
 
As the chart highlights, with 26 members, the UK cabinet is one of the largest amongst major economies – comprising the prime minister Boris Johnson, 21 department ministers and four ‘ministers attending cabinet’. This does not include the Cabinet Secretary or other officials, meaning that cabinet meetings generally involve more than 30 people in total.
 
Compare that with the more compact 16-member German federal cabinet (Chancellor Angela Merkel and 15 departmental ministers) and the ten-member Chinese state council executive (comprising the premier Li Keqiang, five vice-premiers and four other senior departmental ministers).
 
It is certainly much larger than FTSE-100 company boards, where the average size is 11, and very few listed companies have more than 16 board members.
 
There is some debate around whether reducing the size of the UK cabinet would be more conducive to effective government. Some suggestions that the merger of the Department for International Development (DfID) with the Foreign & Commonwealth Office (FCO) to form the new Foreign, Commonwealth & Development Office (FCDO) in September is the first step on the way to that goal – with further mergers possible. However, although there will be one fewer departmental minister, there is a reasonable prospect of the minister responsible for development at the FCDO being invited to attend cabinet given its importance to the government’s global agenda.
 
Of course, merging departments is not the only way to achieve a slimmer cabinet – for example, the 31-member Russian cabinet (not shown in the chart) rarely meets as one body. Instead, there are regular meetings of the 10-strong prime ministerial group (the prime minister Mikhail Mishustin and nine deputy prime ministers) and occasional meetings of the 20-strong cabinet praesidium that includes the most senior ministers as well.
 
The UK Cabinet also works in this way to a certain extent, with critical decisions often being made in smaller groupings of senior ministers, such as the 9-member National Security Council, the 9-member Climate Change Committee or the 12-strong EU Exit Operations Committee for example. Canada, with its 37-member cabinet, also operates through a series of cabinet committees ranging from around 8 to 15 members. However, in both cases, the full cabinet still meets regularly and remains the formal executive body for authorising government actions.
 
With rumours of a cabinet reshuffle in the UK this autumn, it will be interesting to see whether moves to reduce the size of the cabinet will actually take place or whether we will see further development of cabinet committees as the places to be ‘in the room where it happens’.

This chart of the month was originally published by ICAEW.

Public debt exceeds 100% of GDP for first time since 1963

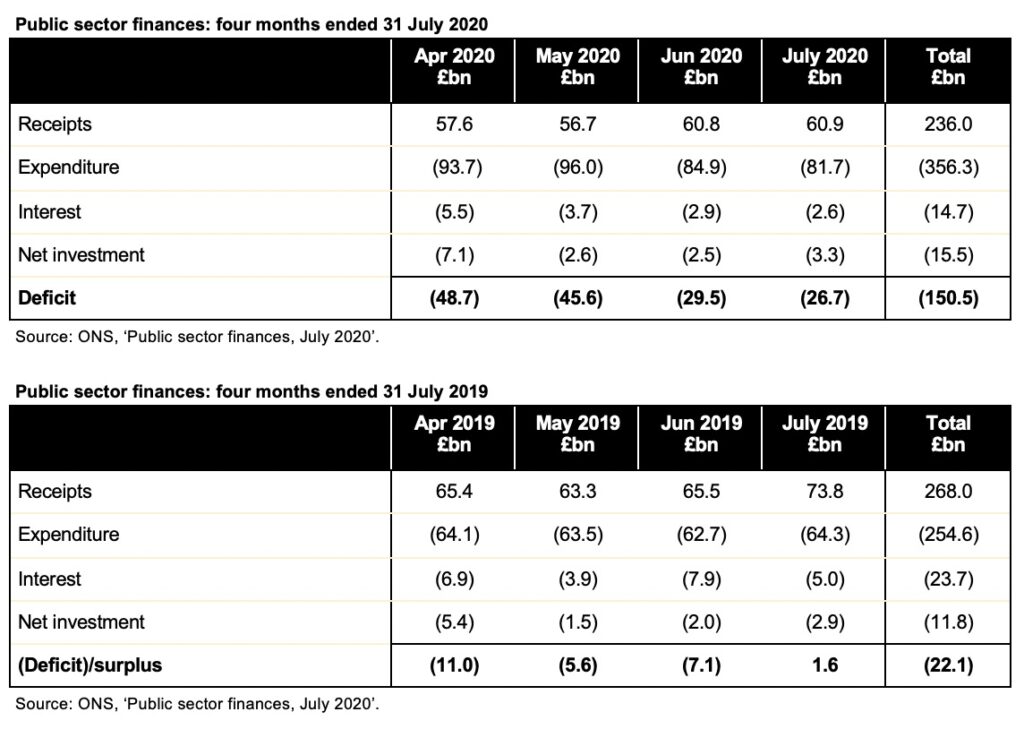
22 June 2020: The fiscal deficit of £103.7bn for April and May 2020 is over six times as large as the £16.7bn reported for the same period last year.

The latest public sector finances for May 2020 published by the Office for National Statistics (ONS) on Friday 19 June 2020 reported a revised deficit of £48.5bn for April and a deficit of £55.2bn for May 2020.

Public sector net debt increased to £1,950.1bn or 100.9% of GDP, an increase of £173.2bn (up 20.5 percentage points) compared with April 2019. This is the first time the headline debt number has exceeded 100% of GDP since 1963, although the ONS cautions that the numbers for the deficit and for GDP are both subject to potentially significant revisions.

Table showing receipts, expenditure, net investment, deficit and public sector net debt.  Details available on ICAEW article - click link at end of this post.

These results reflect the substantial fiscal interventions by the UK Government to support businesses and individuals affected by the coronavirus pandemic, together with a collapse in tax revenues as a consequence of the lockdown.

The deficit of £103.7bn for the two months to May is more than the budgeted deficit of £55bn for the whole of the 2020-21 financial year set in the Spring Budget in March.

Cash funding (aka the ‘public sector net cash requirement’) for the two months was £143.5bn, compared with £1.8bn for the same period in 2019.

Some caution is needed with respect to the numbers published by the ONS, which are expected to be revised as estimates are refined and gaps in the underlying data are filled.

Alison Ring, director of public sector for ICAEW, commented:

“Significant borrowing over recent months means that this is the first time in more than 50 years that debt has been larger than GDP. And though the furlough scheme to date has cost less than originally estimated, cash funding in April and May was more than in the previous three financial years combined.

These are major milestones for the public finances and demonstrate the unparalleled impact of coronavirus, even if this is not surprising given the huge amounts of financial support the government is providing to keep the economy going through lockdown.”

This article was originally published by ICAEW.

ICAEW chart of the week: Economic lockdown

19 June 2020: Economic contraction sees monthly GDP per capita decline from £2,790 in February 2020 to £2,100 in April 2020.

UK GDP per person per month - April 2019: £2,740 +£50 = Feb 2020: £2,790 - Mar £160 - Apr £530 = April 2020: £2,100.

The #icaewchartoftheweek is on the economy this week, illustrating how average GDP per person per month increased from £2,740 in April 2019 to £2,790 in February 2020, before contracting sharply in March and April.

The increase of £50 per person in economic activity between April 2019 and February 2020 was predominately driven by inflation, with per capita economic growth of less than 0.4% over the 10 month period. This reflects just how weak the UK economy was immediately before the pandemic.

The modest increase up to February 2020 is dwarfed by the dramatic changes seen as a consequence of the pandemic, with severe curtailments in many parts of the economy leading to a 5.8% fall in economic activity in March and a further 20.4% in April according to provisional numbers from the Office for National Statistics.

Monthly GDP was estimated to be £183bn in April 2019, £187bn in February 2020 and £141bn in April 2020. The population was projected to be just over 66.7m in April 2019, rising to 67.0m by February 2020, before increasing very slightly in March prior to the lockdown and then falling a little in April.

The dramatic transformation in the UK economy wrought by the lockdown is now extremely visible in the statistics, but it will take some time for the post-lockdown economic position to emerge in order to be able to see how much permanent damage has been done.

This article was originally published by ICAEW.

Treasury backs PAC in battle over recommendations

17 June 2020: Treasury writes stern ‘Dear Accounting Officer’ letter instructing departments to stop delaying compliance with PAC recommendations.

In a co-ordinated move, the Public Accounts Committee (PAC) and HM Treasury issued instructions to government departments to stop unilaterally extending the deadlines on addressing PAC recommendations, and to write to the PAC promptly to explain any delays in completing agreed actions.

Meg Hiller MP, Chair of the PAC, recently wrote to HM Treasury complaining about the behaviour of some departments who have been deferring implementation of agreed actions to address PAC recommendations and doing so without providing an explanation for the delay. Sometimes the PAC only finds out about delays many months after deadlines have been missed.

In response, Treasury has issued a ‘Dear Accounting Officer’ letter instructing departments to ensure systems are in place to monitor progress on implementing recommendations and to write to the PAC immediately it becomes clear that a recommendation is no longer on track to be implemented by the agreed target date. Departments need to provide a detailed explanation for a deferral together with a revised date for completion.

Martin Wheatcroft FCA, advisor to ICAEW on public finances, said:

“This is an unusual and very public shot across the bows of departments. It brings out into the open the frustration felt by both the Public Accounts Committee and Treasury when weaknesses in systems and processes identified by the PAC are not dealt with as planned.

Permanent Secretaries are now on notice that any backsliding on implementing agreed actions is not acceptable, and that attempting to slip missed deadlines past the PAC in routine reports many months later is not going to work anymore.”

This article was originally published by ICAEW.

ICAEW chart of the week: PFI contracts past their peak

12 June 2020: PFI contract payments have started to decline following a peak of £10.2bn in 2019-20.

The #icaewchartoftheweek is on private finance initiative (PFI) contracts, illustrating how payments on the UK’s portfolio of over 700 ongoing PFI and PFI2 contracts reached a peak of £10.2bn in the financial year ended 31 March 2020.

Total payments are expected to fall over the years to come as contracts start to come to the end of their (in most cases) 25 to 30-year terms, with the majority scheduled to expire between 2025 and 2050.

The tailing off of payments reflects the lack of new PFI deals to replace expiring contracts since 2010, when PFI2 was introduced without much success and the announcement in 2018 that PFI was over. News is still awaited on whether a new model for public-private partnerships will be adopted to replace PFI, following on from the Infrastructure Finance Review.

In the meantime, the remaining 704 ongoing contracts still need to be managed, including ensuring assets are handed back to public sector in good condition. This will be a big challenge for public bodies, with the National Audit Office recommending that preparations start seven years in advance of the end of each PFI contract.

This chart was originally published by ICAEW.

Challenges for public bodies as PFI contracts end

8 June 2020: An NAO report has recommended that public bodies start preparations seven years before PFI contracts expire to negotiate the handover of assets and ensure service delivery is not disrupted.

The National Audit Office (NAO) has issued a report on the challenges public bodies are facing as private finance initiative (PFI) contracts come to an end. 

There are over 700 PFI contracts in the UK involving assets with a capital value of £57bn. Of these, 72 are due to expire over the next seven years in England, with an estimated £3.9bn of assets expected to revert to public sector ownership in that time.

The NAO is the independent audit body responsible for scrutinising public spending on behalf of Parliament. In addition to auditing the financial accounts of departments and other public bodies, the NAO examines and reports on the value for money of how public money has been spent.

PFI is a contracting approach where public bodies acquire the right to use an asset embedded within a long-term service contract. PFI contracts are typically for periods of up to 25 years and were used extensively from the late 1990s until the early 2010s to build a range of assets including (but not limited to) schools, hospitals, offices, transport infrastructure and military equipment. 

Most PFI contracts expire from 2025 onwards, meaning there has so far only been a limited number of practical examples to learn from. Of those, the NAO reports that four out nine of the public bodies they surveyed were dissatisfied with the condition of PFI assets at expiry.

Key findings in the report include:

  • The public sector does not have a strategic or consistent approach to PFI contract expiry and risks failing to secure value for money in negotiations with the private sector
  • There is a risk of increased costs and service disruptions if public bodies do not prepare for contract expiry adequately in advance
  • Insufficient knowledge about asset condition risks them being returned in worse quality than expected
  • Contract expiry is resource-intensive and requires different skills, with external consultants needed in most cases
  • Many public bodies start preparing four years or more before expiry, but experience suggests that preparation time is often underestimated. Infrastructure & Projects Authority (IPA) guidance is seven years
  • There is a potential for disputes, especially as PFI providers often have a financial incentive to cut spending on asset maintenance and rectification towards the end of a contract
  • Early PFI contracts are likely to be ambiguous about roles and responsibilities at contract expiry, with poorly drafted clauses open to interpretation.

The NAO recommends that public bodies and sponsor departments start preparing for contract expiry on a timely basis, ensure the PFI contract is complete and expiry provisions are well understood, develop a contract expiry plan and escalate problems which cannot be resolved at a local level. It also recommends that adequate funding is provided to cover dispute resolution and hiring additional resources.

The NAO believes that the IPA and sponsor departments have key roles to play in supporting public bodies and departmental teams responsible for PFI contracts with resources, sector-specific expertise, specialist advice and training. They need to identify high-risk contracts, such as those sitting with public bodies that lack appropriate skills and capabilities, and potentially establish an electronic repository to enable a more consistent approach across government.

The NAO says the IPA should assess the value of money of establishing a centralised pool of internal resources, such as lawyers and surveyors, that authorities can use, provide contract expiry guidance and terms of reference for consultants, develop a consistent approach to resolving legal disputes, and develop an investor strategy to manage relationships with PFI equity investors, management service companies, and contractors.

The report’s final recommendation is to HM Treasury, saying it should provide funding to departments assisting financially constrained public bodies where it is value for money and practical to do so.

Commenting on the report Alison Ring, Director, Public Sector, at ICAEW said:

“Public bodies are very experienced in the operation of ongoing PFI contracts. But with most PFI contracts not due to finish until 2025 or later, they have much less experience of managing contract expiry.

The NAO is quite right to highlight the need to start planning well in advance and the need to invest in the very different skills and expertise required to negotiate the handover of assets to ensure service delivery is not disrupted. 

The role of the Infrastructure & Projects Authority and sponsoring departments will also be critical in supporting the 182 public bodies responsible for just one PFI contract, and in ensuring that lessons learned are shared across the public sector.

With tens if not hundreds of millions of pounds at stake if public bodies get this wrong, it is extremely important that the Government is not penny wise and pound foolish by failing to invest in the sufficiently skilled resources that will be required to get the best value for money for the taxpayer as PFI contracts come to an end.”

This article was originally published by ICAEW.

ICAEW chart of the week: EU spending plans 2021-27

5 June 2020: European Commission proposes €2tn in spending over the next seven years, including a major stimulus package – as illustrated by the #icaewchartoftheweek.

Last week the European Commission submitted its formal proposal for the EU’s multiannual financial framework for 2021 through 2027. This is the outline budget that sets out the EU’s medium-term financial priorities and forms the starting point for each year’s budget.

The proposals include an annual budget for financial commitments of €167bn in 2021, rising to €192bn in 2027 – a total of €1,241bn including inflation or €1,100bn in 2018 prices. There is also a one-off €809bn (€750bn in 2018 prices) proposal for a ‘Next Generation’ economic recovery plan in the aftermath of the coronavirus pandemic, to be funded initially by borrowing.

Although the outline budget of €167bn for 2021 is smaller than the €173bn amended commitments budget for the current financial year, it is actually a significant increase once the departure of the UK is taken into account – at least assuming the UK-EU transition period is not extended for a further one or two years.

The largest area of spending is on regional and social development (‘cohesion and values’ in EU jargon), including programmes such as the European Development Fund, the European Social Fund, the Cohesion Fund and Erasmus.

This is followed by agriculture and environment, the majority of which relates to agricultural subsidies and rural development as well as environmental and climate action programmes.

Science, digital and single market includes spending on research and development (including Horizon), the European space programme, Connecting Europe (transport, energy and digitally), Digital Europe, and the operation of the single market.

Security and migration bring together ‘migration and border management’ with ‘resilience, security and defence’, while External includes the cost of development programmes (principally in neighbouring countries), humanitarian aid, and pre-accession assistance for candidate countries that have applied to join the EU.

Spending on institutions mainly comprises the administrative costs of the European Commission, the European Council and the European Parliament, together with other agencies, European Schools, and pensions.

These numbers are for spending commitments, being the maximum amounts that can be authorised in any one year. In practice, commitments can cover several years and the expenditures actually occurred in each year are typically a lower amount – for example, in 2020 budget expenditures are €155bn (including spending from previous year’s commitments), less than the €173bn commitment budget.

These numbers may seem pretty large, but with a population of 448 million, the spending proposals are equivalent to an average of just over €30 a month per person over the seven years, together with a one-off stimulus package costing a further €21 a month per person if spread over the same period.

This chart was originally published by ICAEW.