My chart this week looks at the £3.3trn of net liabilities presented in the UK government’s consolidated financial statements for the year ended 31 March 2021 that were finally published more than 27 months after the balance sheet date.
The UK’s Whole of Government Accounts for the year ended 31 March 2021 were published and submitted to Parliament on 20 July 2020, more than 27 months after the balance sheet date. These are consolidated financial statements prepared in accordance with International Financial Reporting Standards (IFRS) that incorporate the financial results of more than 10,000 public bodies in the UK across central government, local government, and other parts of the public sector.
The Whole of Government Accounts provide a much more comprehensive picture of the financial performance and position of the UK public sector than is presented in the statistics-based National Accounts, using a financial language familiar to millions of users of financial reports in the private sector.
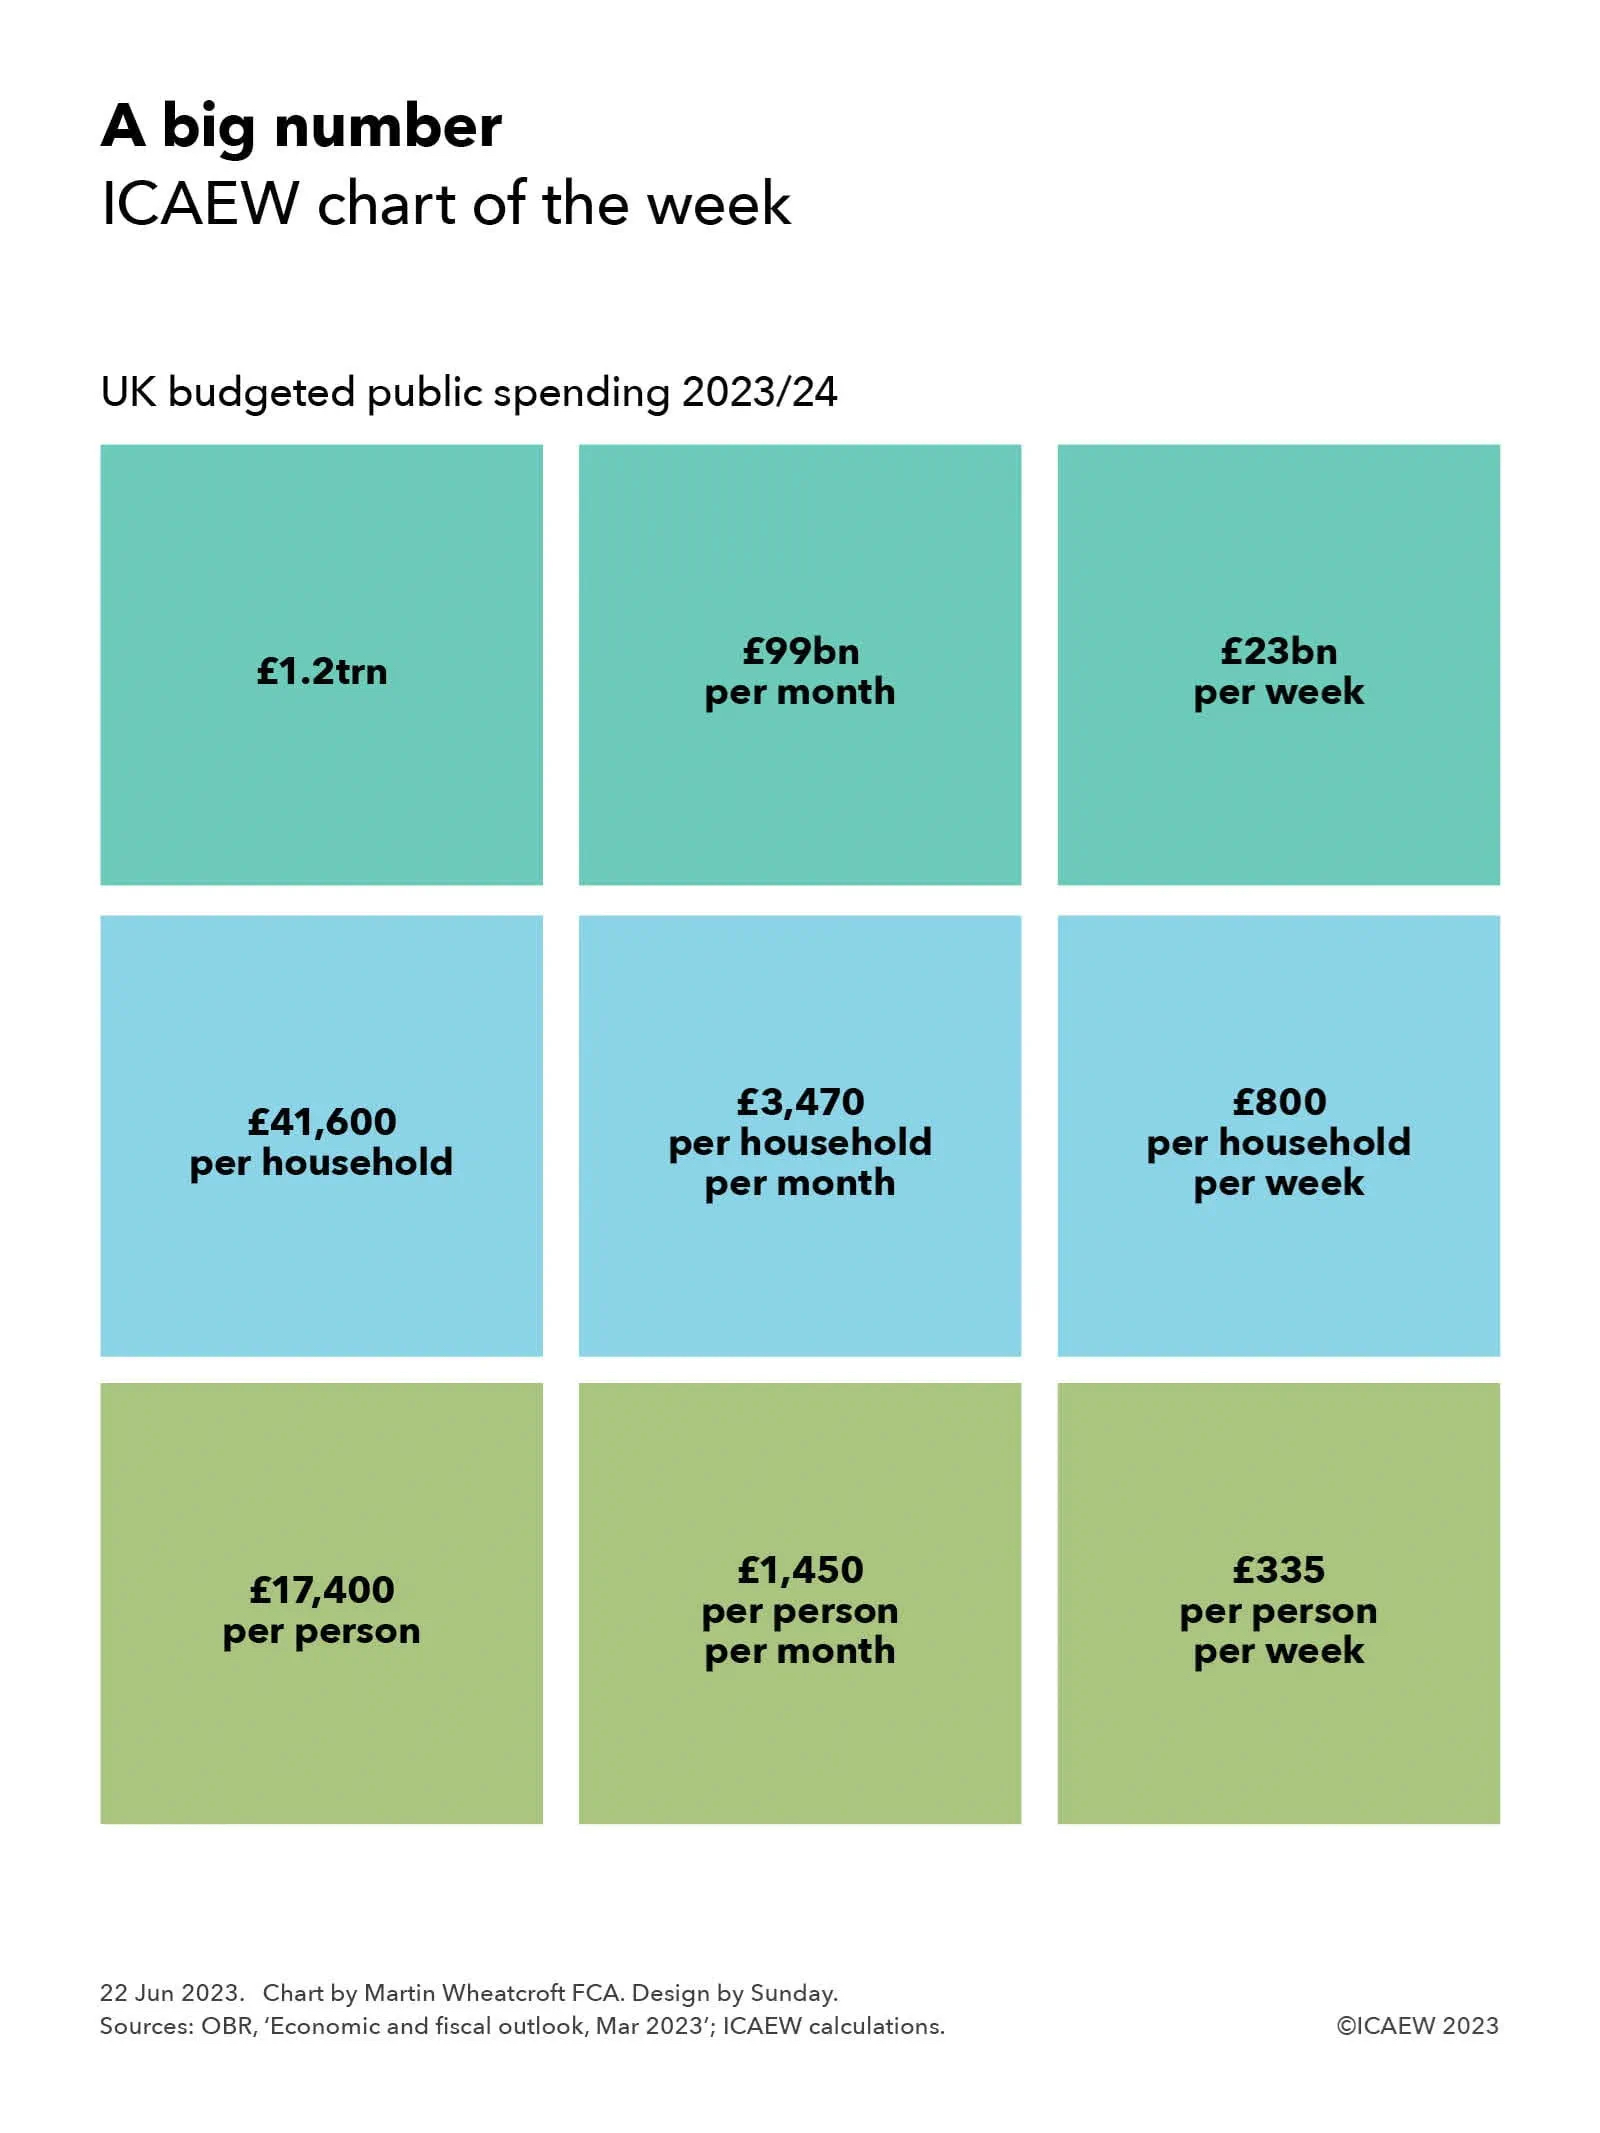
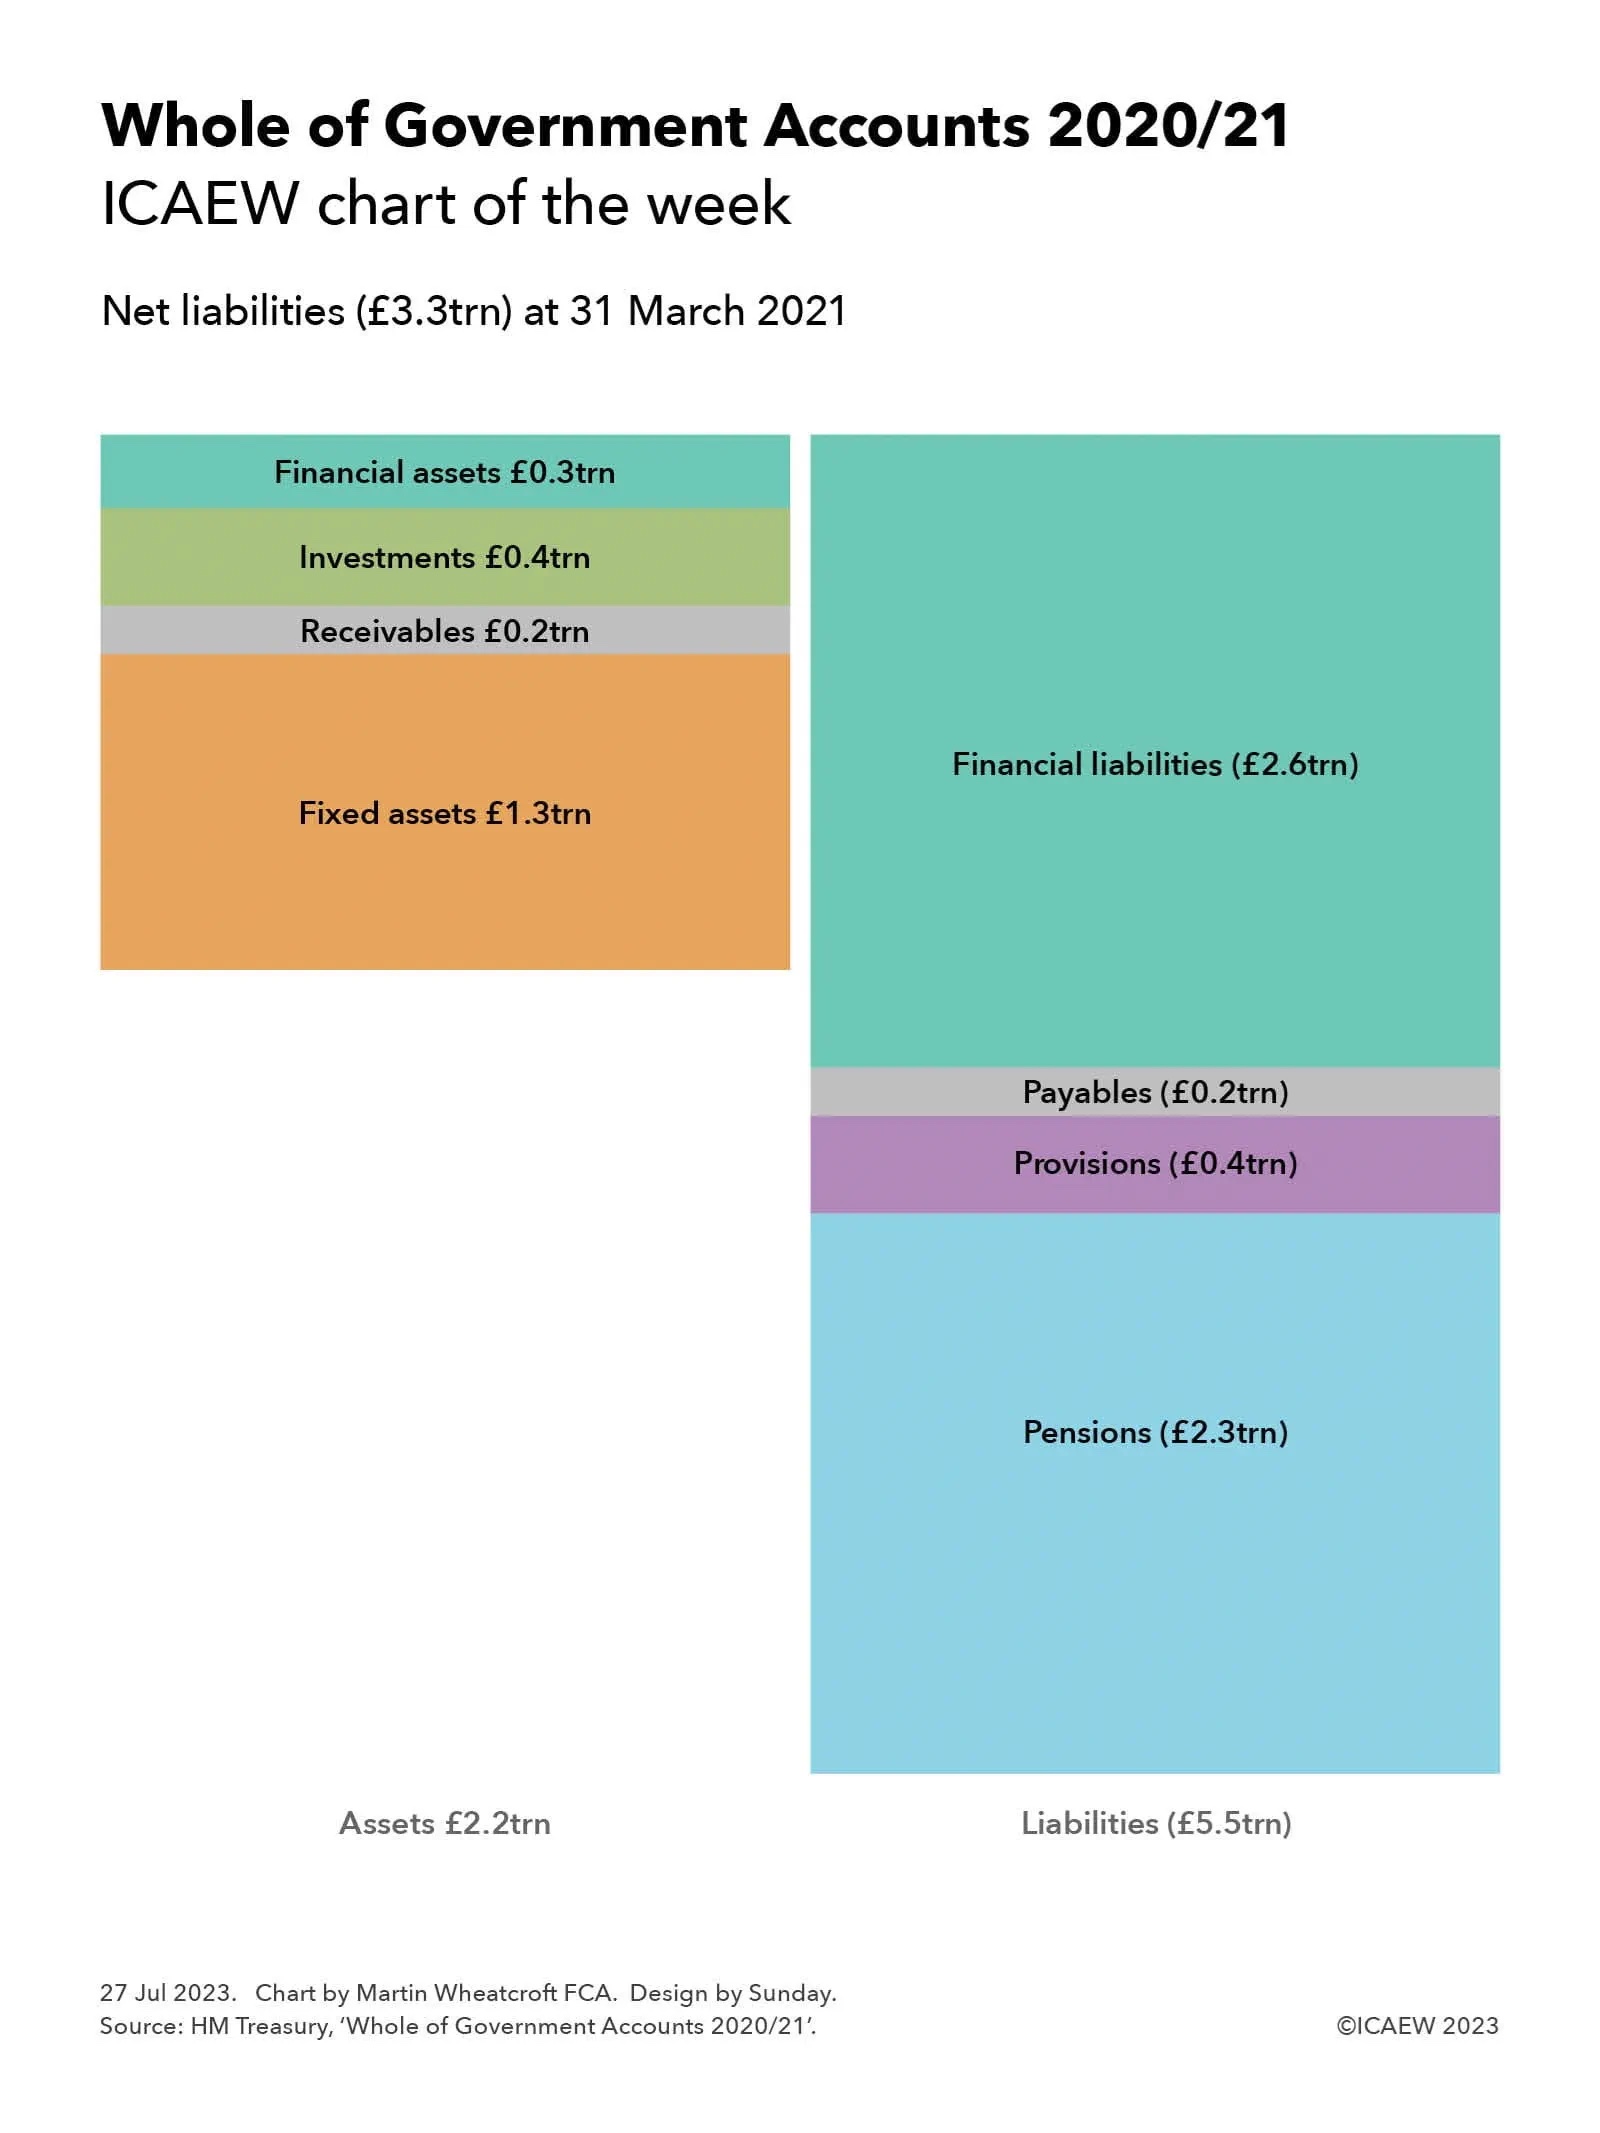
As our chart this week highlights, the statement of financial position (balance sheet) of the UK public sector at 31 March 2021 was in heavily negative territory with £3.3trn in net liabilities, comprising assets of £2.2trn less liabilities of £5.5trn. This compares with net liabilities of £2.8trn a year earlier.
Assets of £2.2trn comprised £1.3trn in tangible and intangible fixed assets, £0.2trn in receivables and other non-financial assets, £0.4trn in non-current investments and £0.3trn in cash and other current financial assets. Liabilities of £5.5trn comprised £2.6trn in debt and other financial liabilities, £0.2trn in payables, £0.4trn in provisions and £2.3trn in net pension obligations.
Fixed assets of £1,313bn consisted of infrastructure assets of £677bn, land and buildings of £409bn, plant and equipment of £184bn, and intangible assets of £41bn. Receivables and other non-financial assets of £218bn comprised £164bn in tax receivable and accrued, £39bn in other receivables, prepayments and accruals, and £15bn in inventories. Non-current investments of £360bn comprised £152bn in loans and deposits, £85bn in student loans, £44bn in equities, £60bn in other financial investments, £16bn in investment properties, and £3bn in assets held for sale. Cash and other current financial assets of £317bn comprised £40bn in cash and cash equivalents, £12bn in gold, £129bn in debt securities, £101bn in loans and deposits, and £35bn of other financial assets.
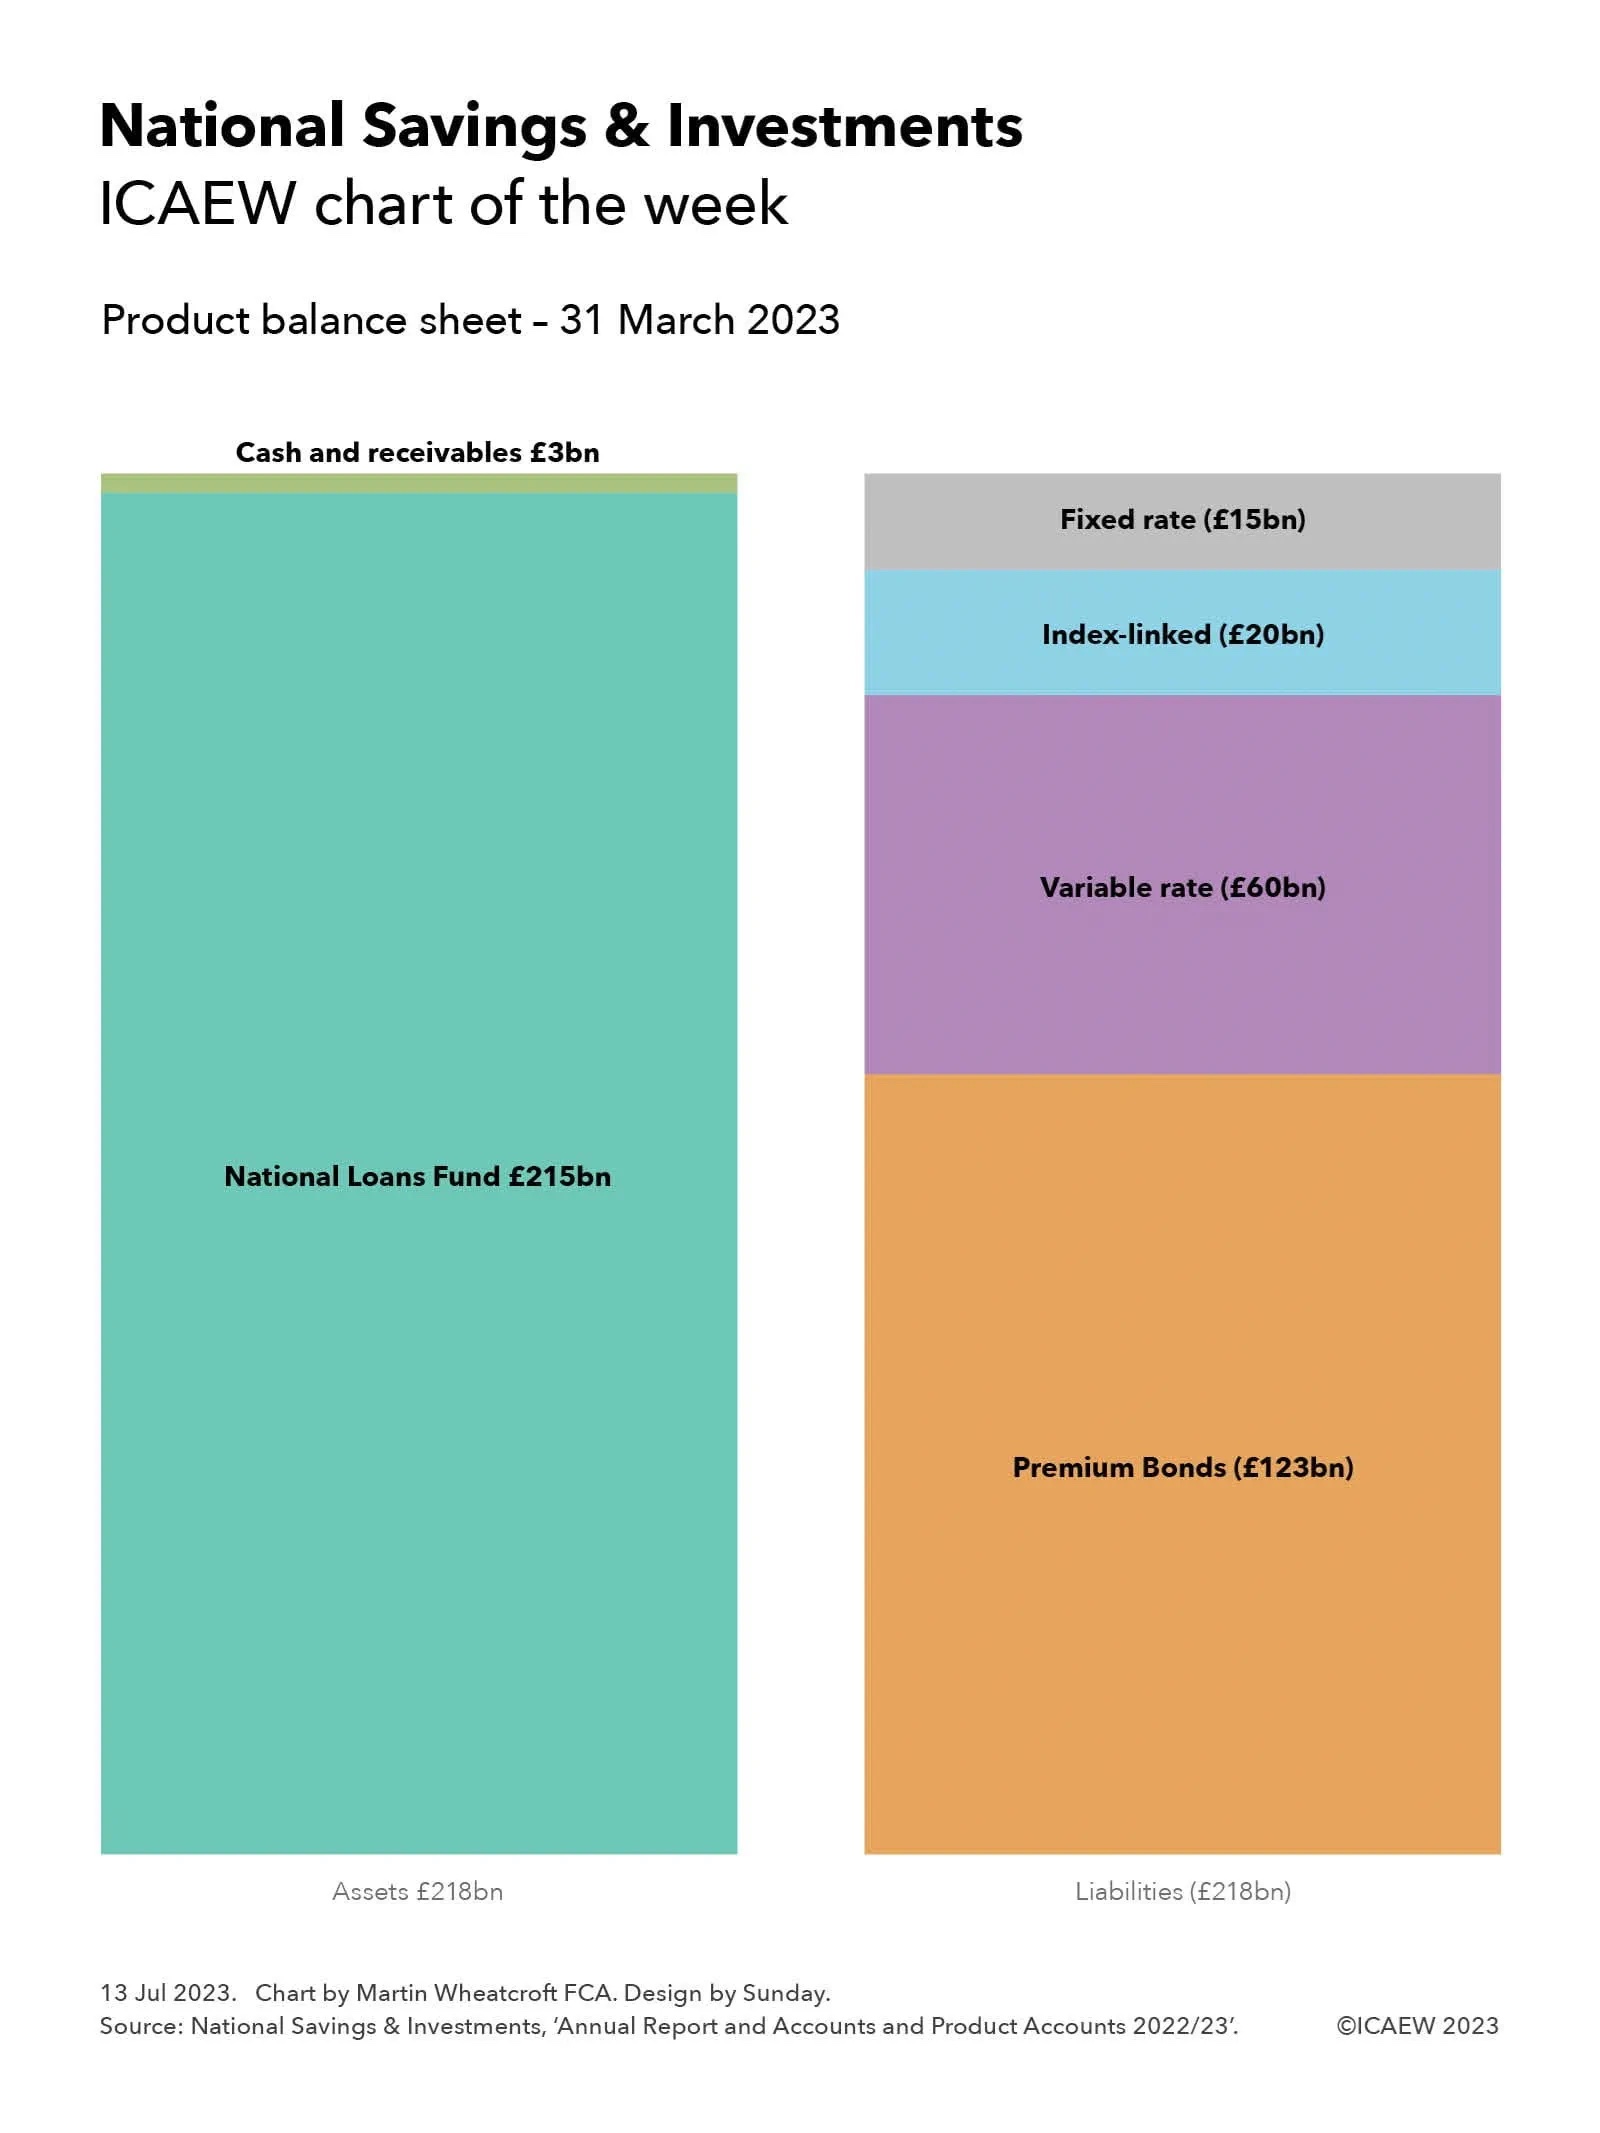
Debt and other financial liabilities of £2,639bn comprised £1,265bn in externally held gilts, £203bn in direct borrowing from the public through National Savings & Investments, £53bn in short-term treasury bills, £815bn in Bank of England deposits, £84bn in bank and other borrowing, £85bn in banknotes, £27bn in derivatives, £20bn in financial guarantees, and £87bn in other financial liabilities. Payables of £221bn comprised £44bn in trade and other payables, £81bn in accruals and deferred income, £55bn in tax refunds, and £41bn on PFI, finance leases and other contracts. Provisions of £366bn consisted of £159bn for nuclear decommissioning, £87bn for clinical negligence, £36bn for payments to the EU, £29bn for the Pension Protection Fund, and £55bn in other provisions for liabilities and charges. Net public sector pension obligations of £2,306bn comprised £2,168bn in unfunded pension obligations (including £792bn for the NHS, £501bn for teachers, £339bn for the civil service, £254bn for the armed forces, £209bn for police and fire services, and £73bn other) and a net £138bn (£479bn of obligations less £341bn in fund assets) for local government and other funded pension schemes.
Not shown in the chart is the revenue and expenditure statement, which reported revenue of £732, expenditure of £1,063bn and finance and other items of £73bn to give a net accounting loss for the year of £404bn – more than twice the £192bn loss reported for the pre-pandemic year. The financial statements covered the first year of the coronavirus pandemic, which saw income fall and costs soar, resulting in net borrowing during the year of £524bn according to the cash flow statement.
The Whole of Government Accounts is probably the most important report published by the UK government each year, but you wouldn’t have known that by the lack of fanfare on its publication amid the wave of hundreds of other documents released ahead of the parliamentary recess. This may be driven by understandable embarrassment by the length of time it has taken to prepare them – more than 27 months after the balance sheet date compared with the nine months that is its long-term aim – as well as by the gaps in preparation caused by local authorities and other public bodies that are substantially behind in producing their individual financial statements, leading to an additional audit qualification for completeness this year.
Despite that, and the other audit qualifications that highlight problems with the numbers reported, every citizen ideally should read the Whole of Government Accounts 2020/21. After all, it tells the financial story of the most dramatic year in recent history.
Read more: Whole of Government Accounts 2020/21.