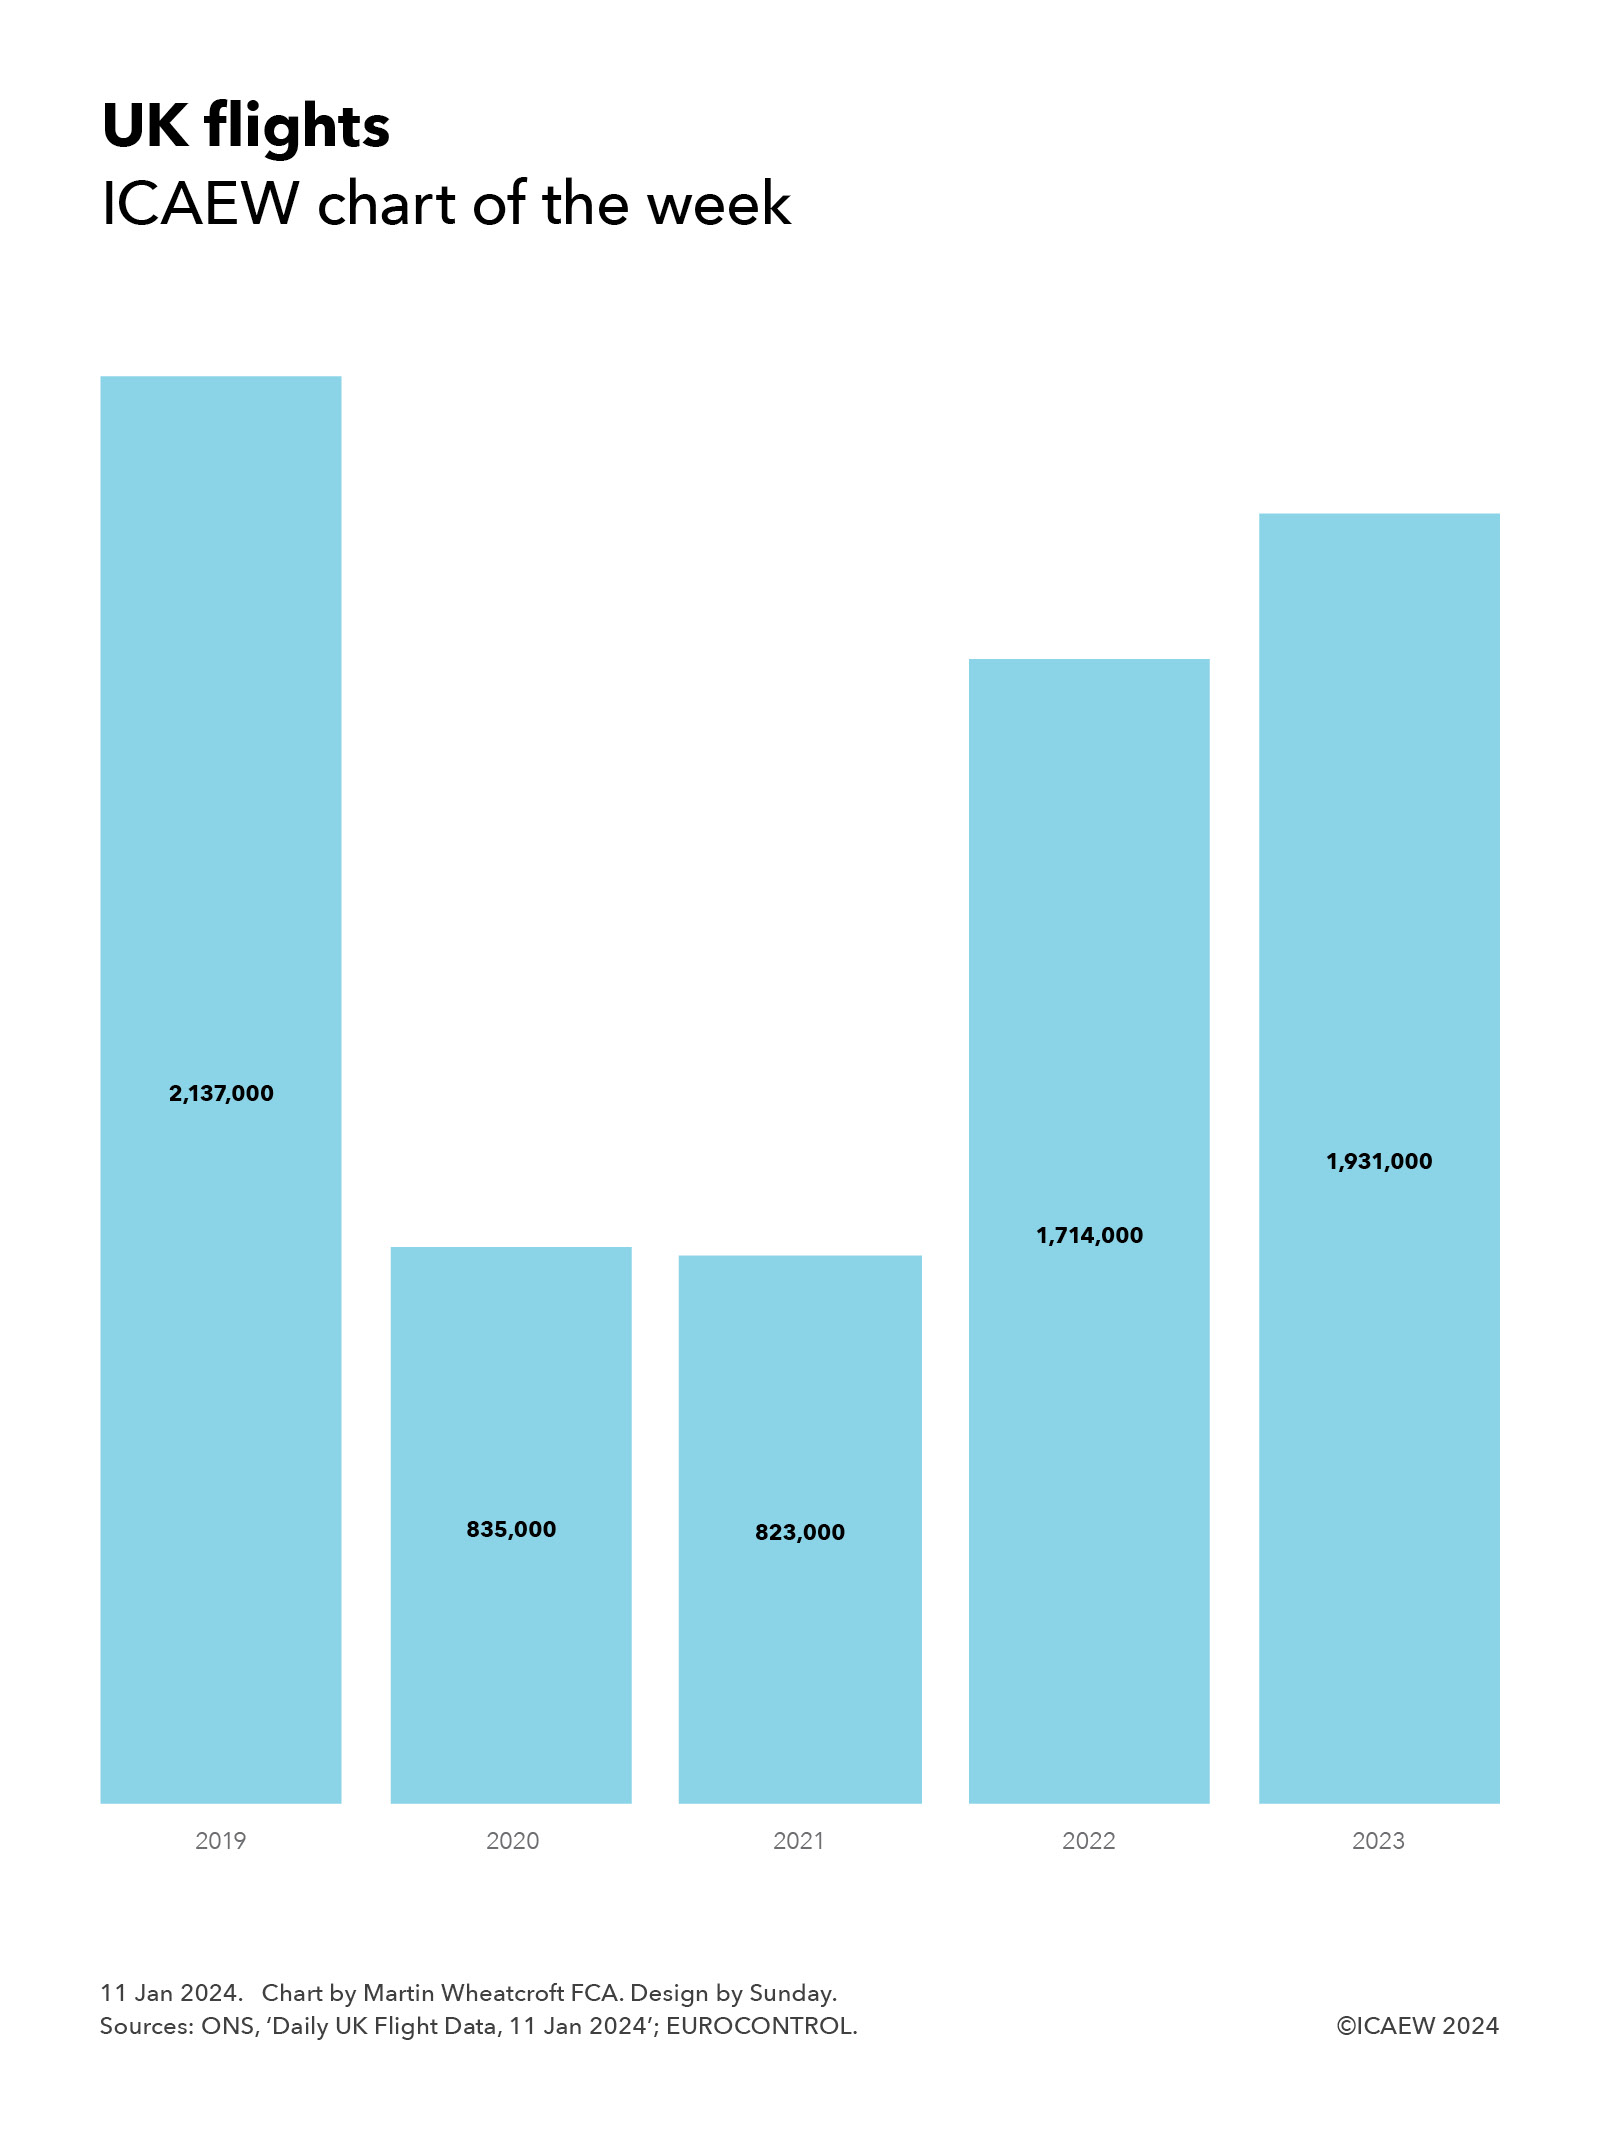
My chart for ICAEW this week illustrates how the number of flights to and from UK airports has not fully recovered since the pandemic.
Our chart this week looks at how the number of flights departing and arriving from UK airports (including internal flights) has changed over the past five years.
According to numbers published by the Office for National Statistics (ONS) – based on data from EUROCONTROL – there were approximately 2,137,000 flights in 2019, 835,000 in 2020, 823,000 in 2021, 1,714,000 in 2022 and 1,931,000 in 2023.
This was equivalent to daily averages of 5,870, 2,282, 2,254, 4,695 and 5,290 in 2019, 2020, 2021, 2022 and 2023 respectively.
Despite reports that consumer demand for air travel has recovered to (or potentially even exceeded) pre-pandemic levels, the number of flights in 2023 was only 90% of that seen in 2019. This is believed to reflect changing travel patterns among business travellers, where video conferencing, corporate carbon reduction targets and cost-saving initiatives are all thought to have contributed to a significant reduction in business trips compared with pre-pandemic times.
For the airline industry, the loss of businesses paying higher prices for flexible bookings has been a key challenge that has caused airlines to focus on improving passenger load factors (ie, seat utilisation), promoting premium tickets to leisure travellers and, in some cases, rebalancing towards the budget carrier market.
With the number of flights in the second half of 2023 around 9% more than in 2022, the industry will be hoping for further growth in demand during 2024.
My chart for ICAEW this week looks at how the pound appreciated in value against the euro, US dollar, yuan and yen respectively during 2023.
My first chart of the week of 2024 for ICAEW looks back at 2023 and how sterling strengthened against the euro, US dollar, yuan and yen – the currencies of the four largest economies in the world – based on exchange rates reported by the Bank of England.
The smallest increase was against the principal currency of the European Union, our largest trading partner, with the sterling to euro exchange rate up by just over 2% from £1:00:€1.128 to £1.00:€1.154 between 30 December 2022 and 29 December 2023.
This contrasted with a 6% rise in sterling against the US dollar during 2023 from £1.00:$1.204 at the end of 2022 to £1.00:$1.275 at the end of 2023, a 9% rise against the Chinese yuan renminbi from £1.00:¥8.31 to £1.00: ¥9.08. Sterling increased, and a 13% increase against the Japanese yen from £1.00:¥159 to £1.00:¥180.
Exchange rate movements can be attributed to multiple factors, including relative rates of inflation and economic growth, interest rates, trade and investment flows, and fiscal credibility among others – both actuals and sentiment about prospects for the future. In sterling’s case, expectations that interest rates in the UK are likely to stay higher for longer than in other major economies is a key contributor to the rise in sterling over 2023, although this is only part of the story.
While sterling has appreciated over the last year against these and many other currencies, the pound is still much lower in value than 10 years ago, being down 4% against the euro compared with £1.00:€1.200 at the end of 2013, down 23% against the US dollar from £1.00:$1.653, and down 9% against the Chinese yuan from £1.00:¥10.01. The exception is the Japanese yen, where the rise this year has more than offset falls over the previous decade to leave sterling 4% higher against the yen than the exchange rate £1.00:¥173 on 31 December 2013.
My chart for ICAEW this week illustrates how the civil service has grown by 92,000 or 23% to 496,000 FTEs over the past five years.
The number of civil servants has increased by 92,000 or 23% from 404,000 full-time equivalents (FTEs) in September 2018 to 496,000 FTEs in September 2023, which may be surprising in the light of government rhetoric about cutting public spending.
As my chart for ICAEW this week illustrates, the size of the UK civil service has grown significantly over the past five years. FTEs in ministerial departments have grown by 38,000 or 21% from 179,000 to 217,000, in the Scottish and Welsh governments by 10,000 or 45% from 22,000 to 32,000, and in agencies and non-ministerial departments by 44,000 or 22% from 203,000 to 247,000.
The civil service is just one part of the public sector workforce, which has increased by 571,000 or 13% from 4,433,000 to 5,004,000 FTEs over the same period. 300,000 of the increase has been in the NHS (up 21% from 1,451,000 to 1,751,000 FTEs in September 2023), which after taking account of the 92,000 increase in the civil service means the rest of the public sector workforce (schools, police, army, local government and others) has grown by a relatively slower number of 179,000 or 7% from 2,578,000 to 2,757,000 over the same period.
The increases in the civil service reverse cuts in the austerity years that saw the civil service fall from 493,000 FTEs in September 2009 to 384,000 in June 2016, just before the Brexit referendum.
The UK’s departure from the EU Single Market and the EU Customs Union on 31 December 2020 has been a major driver in the increase, most prominently in the Home Office, which has grown by 15,000 from 29,000 to 44,000 FTEs. Machinery of government changes make it difficult to track the other impacts, but it is likely that another 20,000 of the increase is likely driven by Brexit, made up of small changes across Whitehall departments and individual agencies, such as the 80% increase in the size of the Rural Payments Agency (from 1,400 to 2,600),
The individual agency with the largest increase is HM Prisons and Probation Service, up 15,000 from 49,000 to 64,000 as the outsourced probation was re-absorbed back into the civil service.
The pandemic also had a small impact on the civil service (as opposed to the NHS) with the Department of Health and Social Security more than doubling in size from just under 1,500 FTEs in September 2018 to almost 3,200 in September 2023.
Some increases are more difficult to attribute, such as the 30% increase in the size of the National Crime Agency from 4,200 to 5,500 or the 9% increase in the size of HM Revenue and Customs from 57,100 to 62,000. Brexit is likely to be part of the story following the reversion of responsibilities from Brussels to London, but the growth of cybercrime (for example) in the past few years will also have been a factor.
The civil service numbers reported by the Office for National Statistics exclude civil servants working for the Northern Ireland Executive and its agencies, but do include both the Scottish and Welsh governments. Most of the growth in numbers from 22,000 to 32,000 has been in Scotland as more powers have been devolved to its devolved administration, with the 16,800 FTEs in September 2018 growing by 9,700 or 58% to 26,500 in September 2023. The size of the civil service in Wales has gone up by a much more modest 700 or 13% from 5,200 to 5,900 in the same period.
One possible driver for some of the other increases is that cuts in the civil service made during the austerity years were never sustainable in the longer-term, with the demands that drove those numbers never having gone away. Another is that governments tend to want to “get things done” and there is therefore a need to find people to do them.
Both of these factors may explain why both government departments and agencies have grown in size over the past half a decade.
While the civil service is less than 10% of the public sector workforce, it is often the first place that the government looks when it wants to find cost savings – and the current government is no different in seeking to cut the size of the civil service again. Whether those costs savings are sustainable in the long-term without more fundamental reform is another matter.
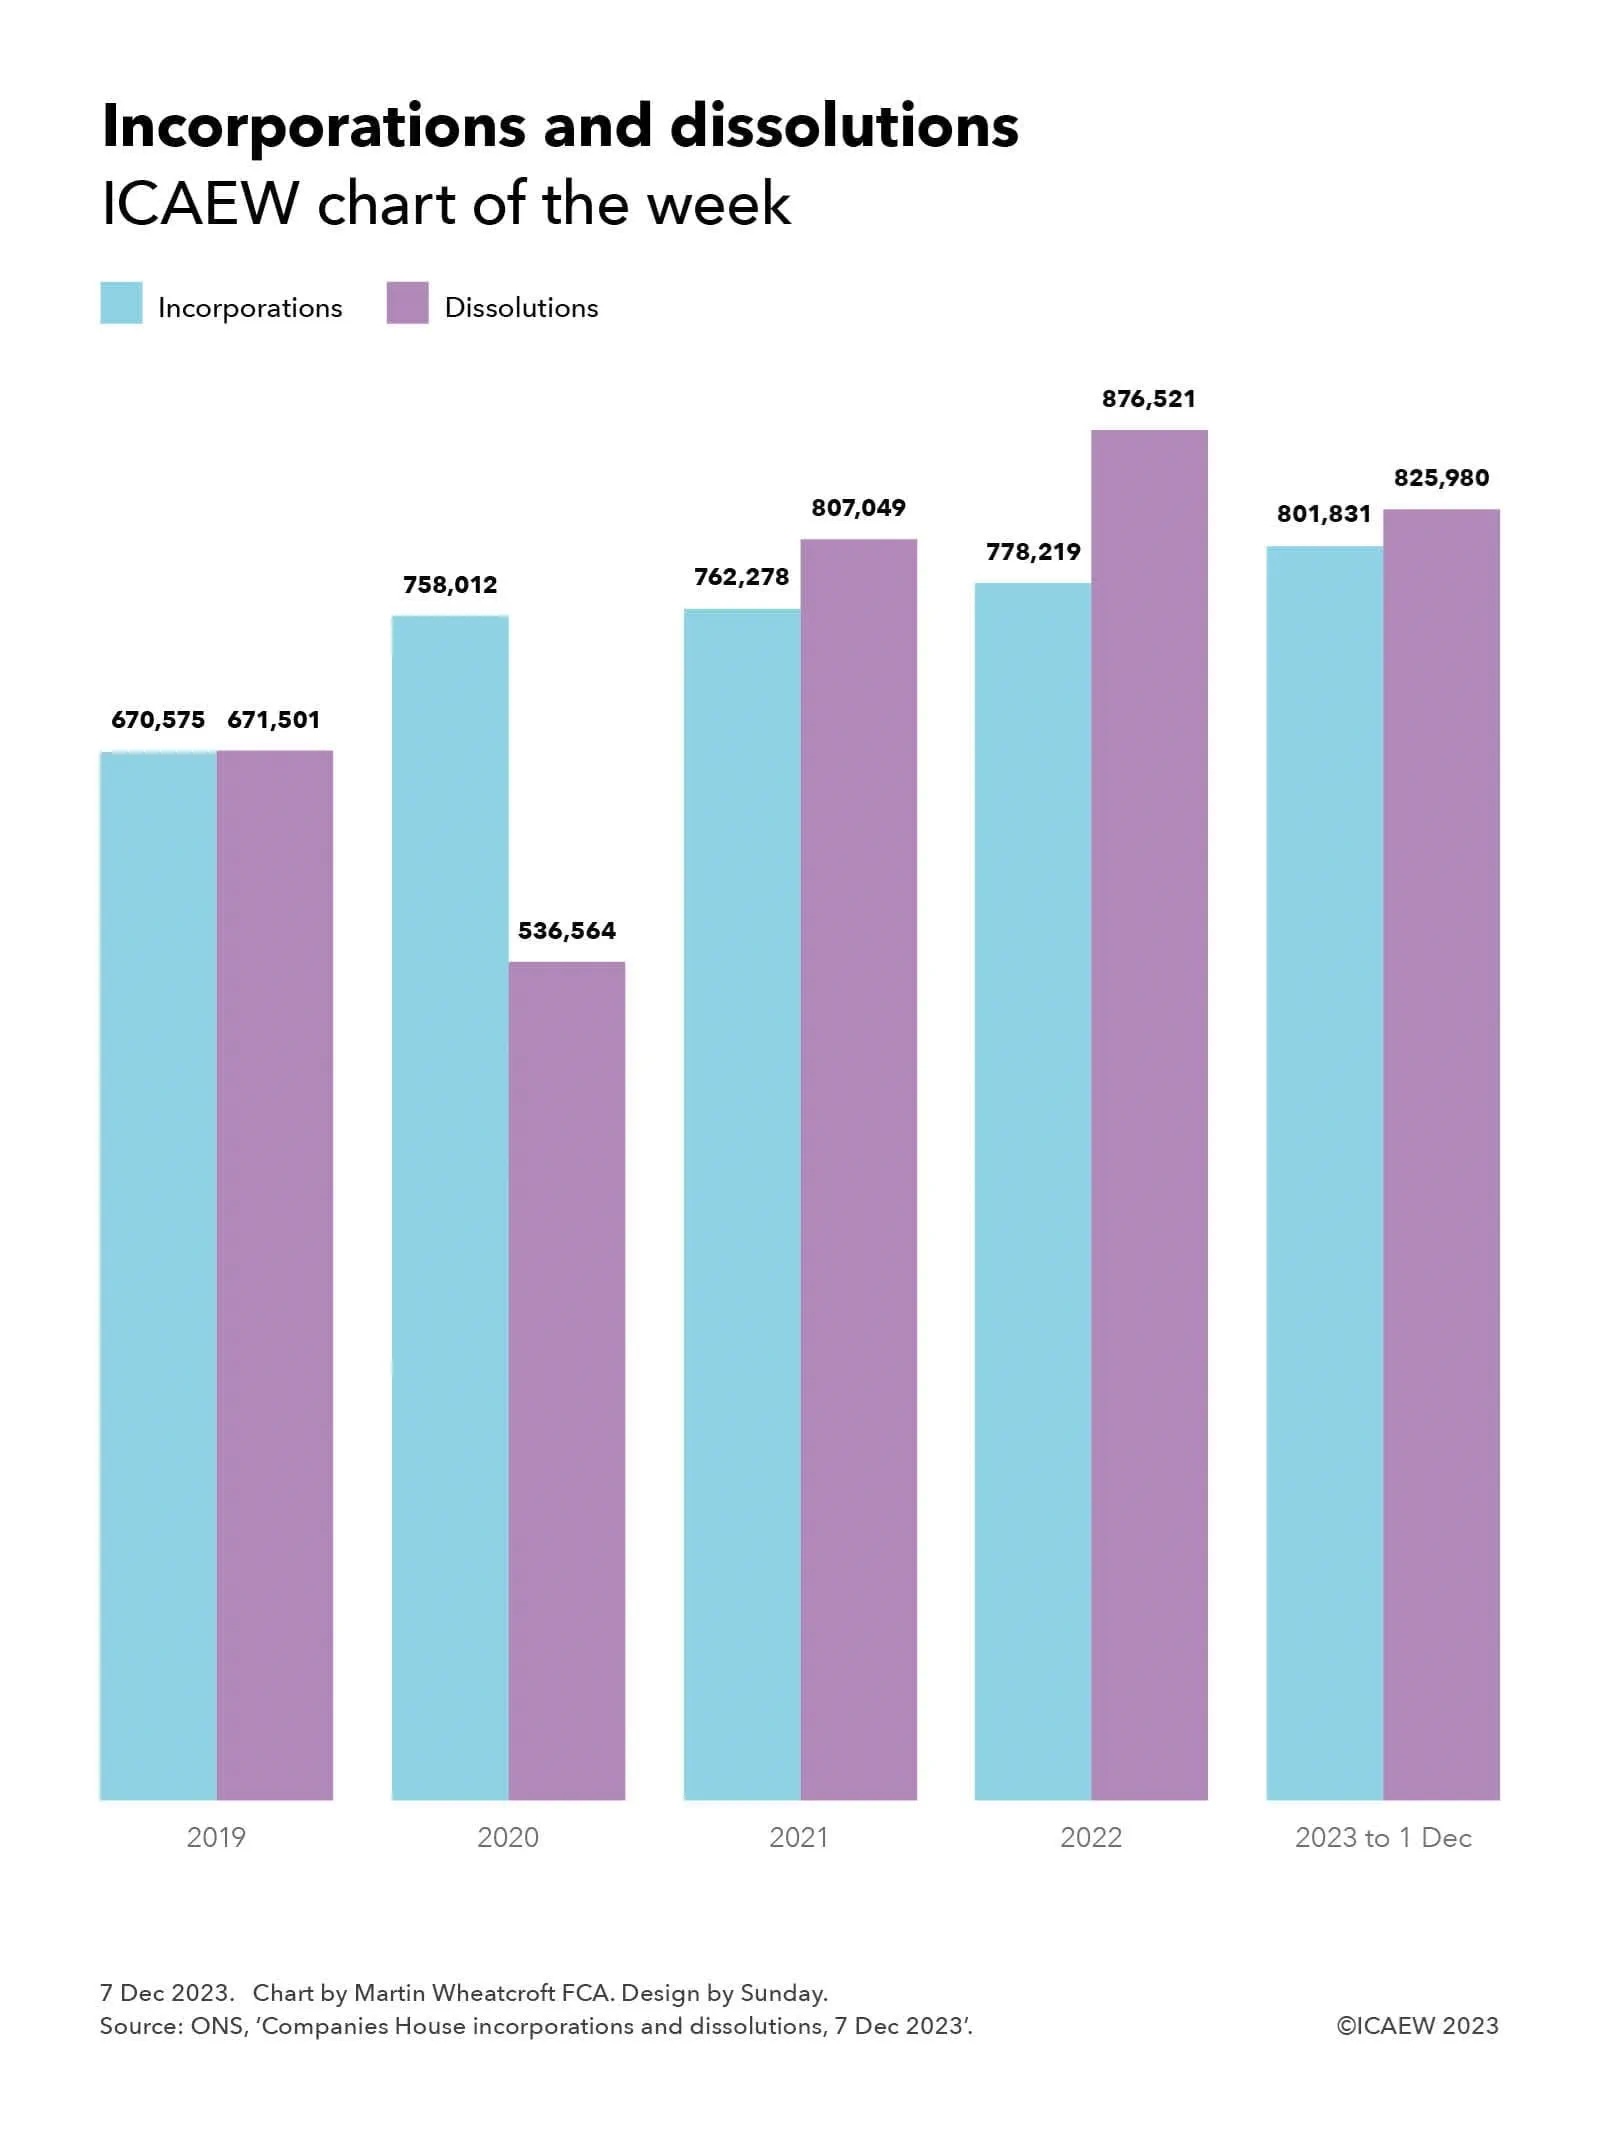
My chart for ICAEW this week illustrates how company dissolutions continue to outpace incorporations as the economy remains in first gear.
A key indicator for the health of the economy is the comparison between how many companies are created each year and the number that are dissolved, and our chart this week illustrates how these compare over the last four years up until 1 December 2023.
In 2019 there were 670,575 company incorporations and 671,501 dissolutions (391,066 compulsorily and 280,435 voluntarily), a net contraction in the number of companies of 926, consistent with the rather tepid economy we were experiencing in the year before the pandemic.
The numbers for 2020 were distorted by the pandemic, with incorporations rising to 758,012 and dissolutions falling to 536,564 (275,933 compulsorily and 260,631 voluntarily) – a net increase of 221,448. The rise in incorporations was no doubt contributed to by people deciding to start new businesses during lockdown, although bulk incorporations may also have been a factor. The significant fall in companies dissolved in 2020 compared with the previous year reflects government support on offer during the pandemic that propped up many companies that would otherwise have failed during 2020.
Incorporations rose further to 762,278 in 2021 and 778,219 in 2022, but these gains were more than offset by a sharp rise in dissolutions, which jumped to 807,049 (508,448 compulsorily and 289,604 voluntarily) in 2021 and 876,521 (572,646 compulsorily and 304,875 voluntarily) in 2022 as government support was withdrawn and reality caught up with many companies. Extremely high energy costs and high inflation were key factors in the demise of many businesses over this period. The net decrease in the number of companies was 44,771 in 2021 and 98,202 in 2022.
The number of companies incorporated during the first 11 months of 2023 was 801,831, a 9% rise on the equivalent period last year, while 825,980 companies were dissolved (539,643 compulsorily and 286,337 voluntarily), a rise of less than 1%. This has narrowed the gap to a contraction of 24,149 companies in the first 11 months of 2023.
While these numbers may be accurate to the nearest digit (unlike most sample-based statistics), their meaning for the economy is much less precise. Many companies are incorporated but never go on to trade, while some incorporations are merely a corporate wrapper around an existing business, or with personal service companies they can be a conversion of economic activity from one legal form to another. Unfortunately, companies are also sometimes incorporated for fraudulent purposes. Similarly, companies are wound up for a range of reasons and not just because they are all the consequence of failing businesses.
Despite that, they do provide a helpful indicator on what is going on with the economy, as the ‘cycle of business life’ is played out. For example, in theory it should be positive that even after a post-pandemic ‘shakeout’ the total number of companies over the period from 2019 to 1 December 2023 has grown by 53,300.
This may also be a statistic worth watching in 2024 as Companies House uses its new powers to weed out companies in the register. Just how significant will the introduction of new verification procedures and more active enforcement activity be to numbers of companies being incorporated and dissolved each year?
My chart for ICAEW this week takes a look at how UK public debt has exploded since the financial crisis to more than quintuple from £0.6trn in March 2008 to a projected £3.1trn in March 2029.
As illustrated by our chart this week, the sums borrowed by the government since the financial crisis of a decade and half ago have been truly astonishing.
In March 2008, the official measure of net debt for the UK public sector was less than £0.6trn. During the financial crisis, government borrowing totalled £0.7trn over a four-year period, causing public sector net debt to more than double to £1.3bn in March 2012.
The eight austerity years saw government cut spending on public services to a significant degree but still borrow a further £0.5trn to see net debt reach £1.8trn in March 2020 – arguably not mending the roof while the sun was shining. This was then followed by an exceptional amount of borrowing during four years of pandemic and energy crisis (including the current financial year) that is expected to see net debt increase by a total of £0.9trn to reach £2.7trn in March 2024.
The Autumn Statement 2023 on Wednesday 22 November saw the Chancellor set out his latest plan for the UK public finances over the next five financial years. This includes a further £0.4trn of borrowing, with public sector net debt projected to amount to £3.1trn in March 2029 – more than quintuple the net amount owed by the UK state 21 years earlier in March 2008.
This assumes that the government can stick to its borrowing plans – many commentators have suggested that planned cuts in spending on public services are unrealistic, meaning more borrowing if taxes are not to rise.
The £2.5trn increase in debt between 2008 and 2029 comprises £2.2trn in borrowing to fund 21 years of deficits (the annual shortfall between receipts and spending) and £0.3trn in other borrowing to fund government lending (such as student loans) and working capital requirements.
As a share of the economy, the increase is less dramatic but still significant – rising from a net debt to GDP ratio of 35.6% in March 2008, to 74.3% in March 2012, to 85.2% in March 2020, to an anticipated 97.9% in March 2024. However, the good news is that net debt / GDP is expected to fall to 94.1% in March 2029 as inflation and economic growth offset the additional borrowing.
The worry for this (or any alternative) government is that while borrowing levels in the OBR’s forecast spreadsheet for the next five years appear manageable and are (just) within the current fiscal rules, the numbers assume that we don’t enter another recession or other economic crisis in that time. Otherwise, we could see debt exploding again.
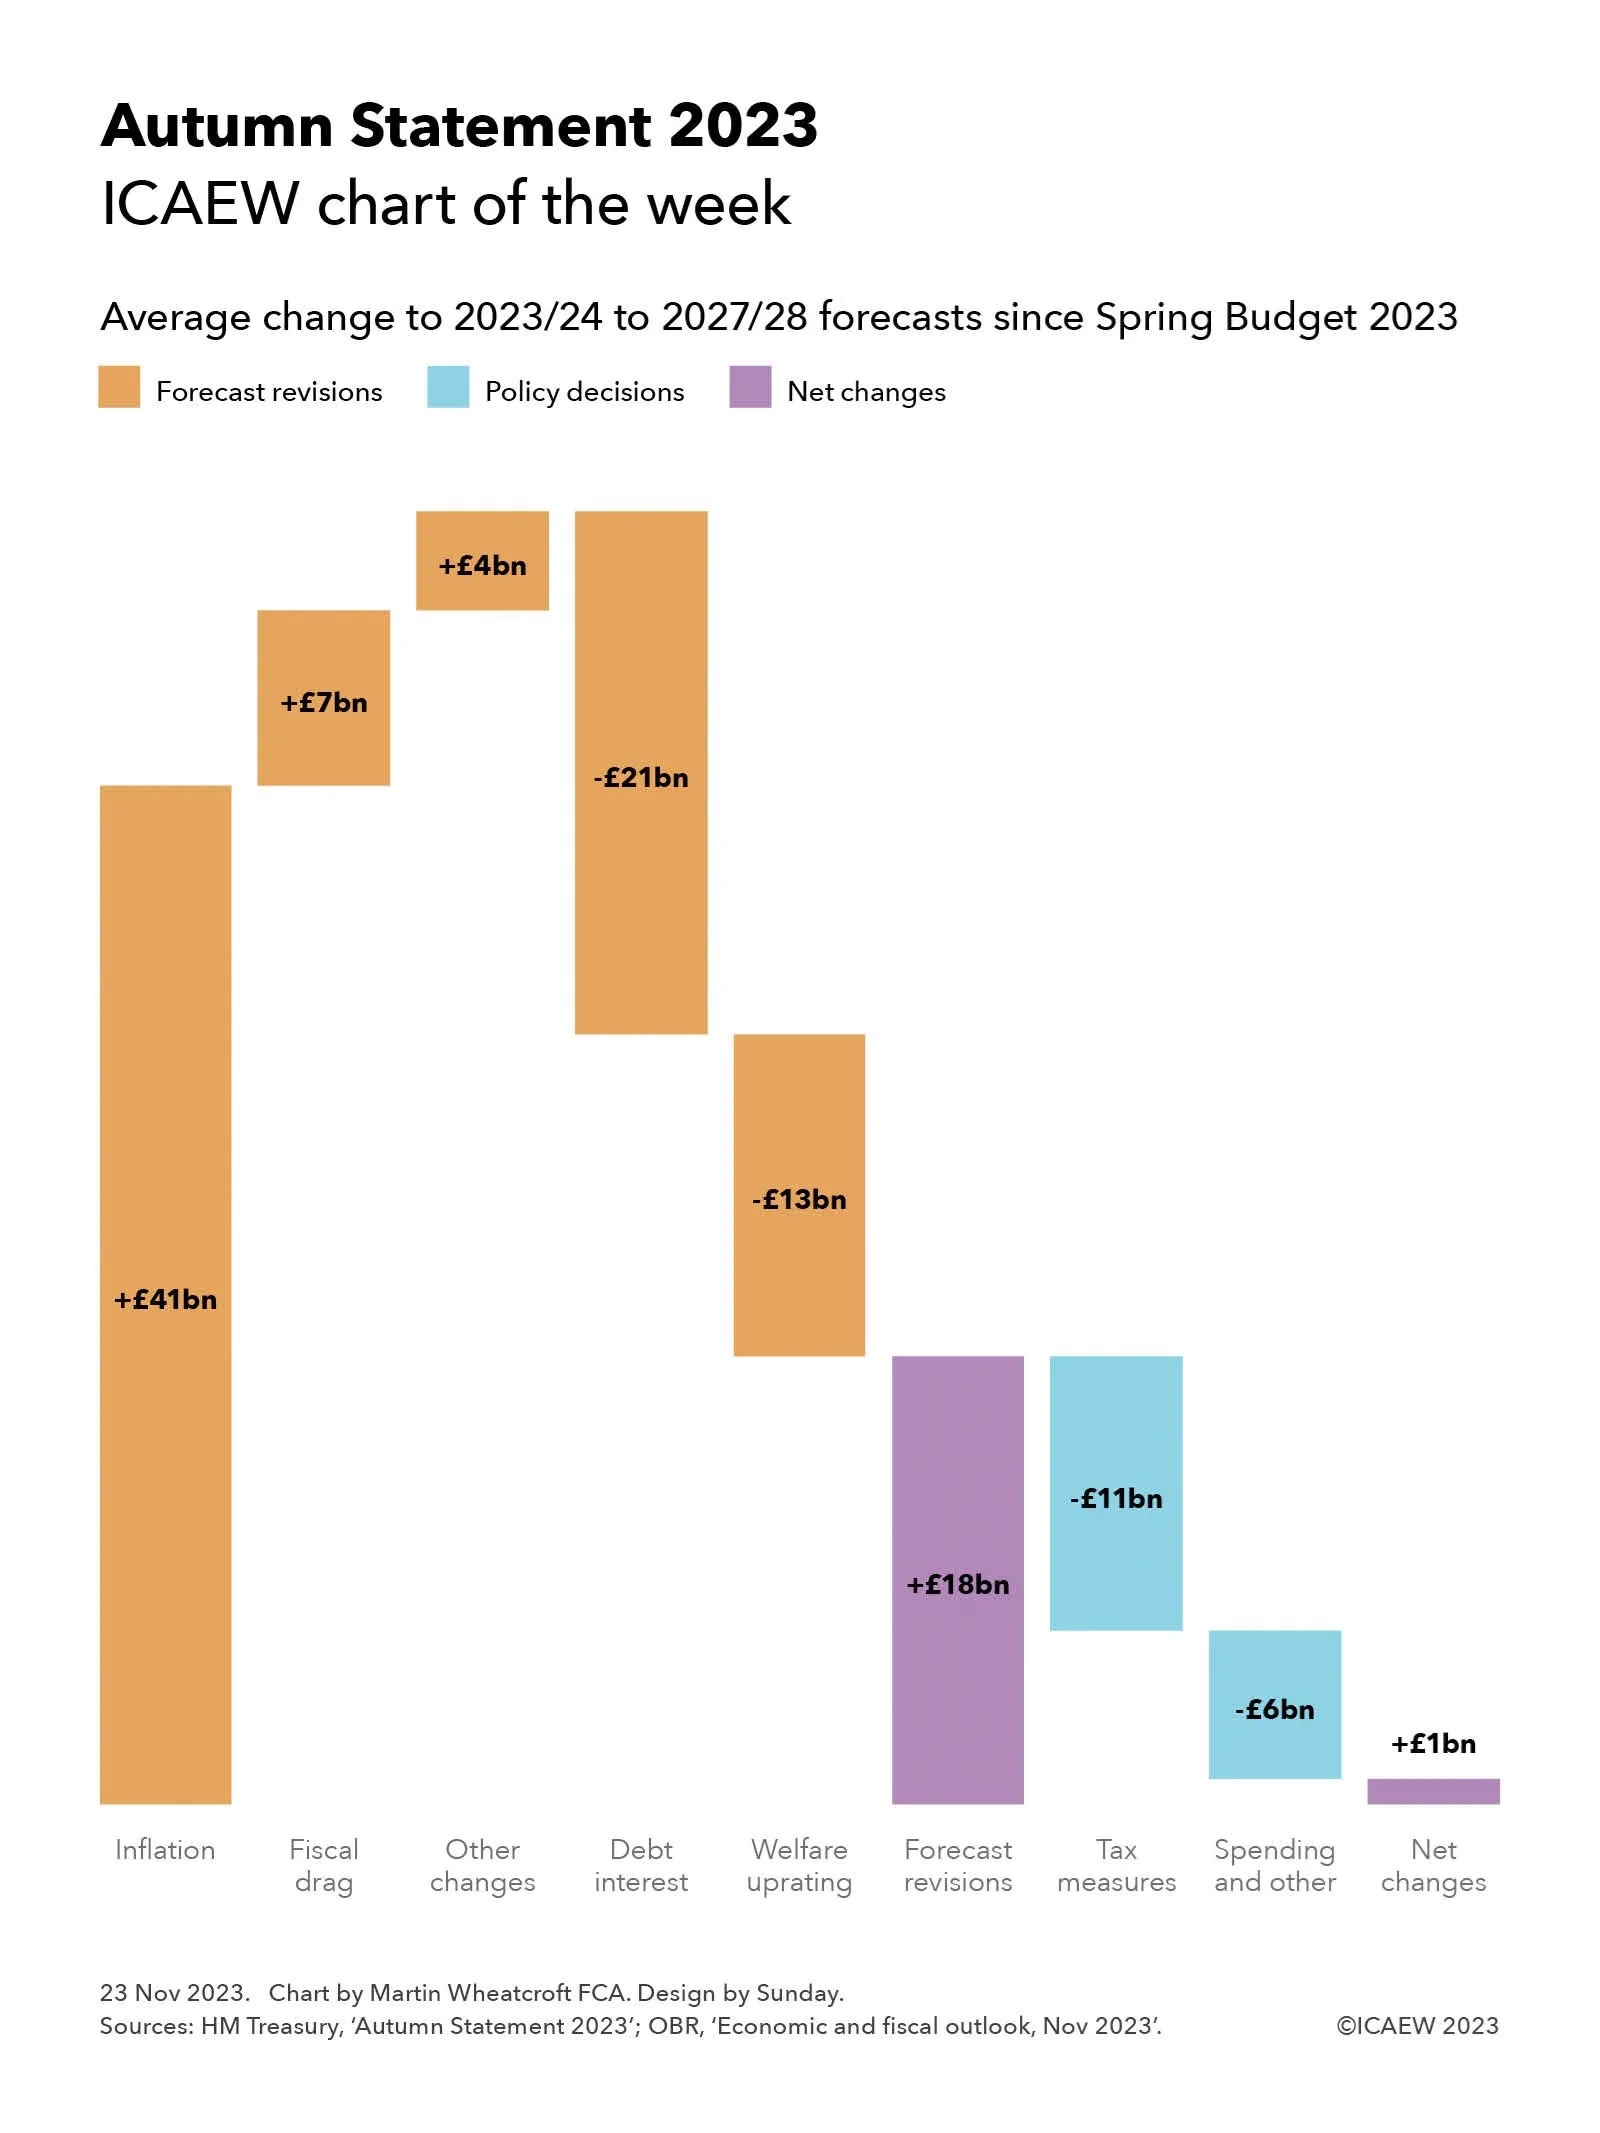
My chart for ICAEW this week illustrates how Chancellor Jeremy Hunt used almost all of the available upside from inflation and fiscal drag to fund his tax measures and a series of business growth initiatives.
The Autumn Statement 2023 on Wednesday 22 November featured a surprise tax cut to national insurance and a perhaps less surprising decision to make full expensing of business capital expenditure permanent.
As my chart illustrates, the forecasts for the deficit over the next five years benefited by £41bn a year on average in higher receipts from inflation, £7bn a year on average in additional ‘fiscal drag’ as higher inflation erodes the value of frozen tax allowances more quickly, and a net £4bn in other upward forecast revisions. These improvements to the forecasts were offset by an average of £21bn a year in higher debt interest and £13bn from the expected inflation-driven uprating of the state pension and welfare benefits, to arrive at a net improvement of £18bn a year on average over the five financial years from 2023/24 to 2027/28 before policy decisions.
In theory, these upward forecast revisions should be absorbed by more spending on public services as higher inflation feeds through into salaries and procurement costs. However, the Chancellor has chosen to (in effect) sharply cut public spending and use almost all of the upward revisions to fund tax measures and business growth initiatives instead. These amounted to £11bn a year on average in tax changes and £6bn a year on average in spending increases and other changes to reduce the net impact to just £1bn a year on average over the five-year period.
The resulting net change of £1bn on average in forecasts for the deficit is to reduce the forecast deficit by £8bn for the current year (from £132bn to £124bn) and by £1bn for 2024/25 (to £85bn), with no net change in 2025/26 (at £77bn), an increase of £5bn in 2027/28 (to £68bn), and no net change for 2027/28 (at £49bn).
The main tax changes announced were the cuts in national insurance for employees by 2 percentage points from 12% to 10% and by 1 percentage point for the self-employed from 9% to 8%, reducing tax receipts by an average of £9bn over five years. This is combined with the effect of making full expensing permanent of £4bn – this change mainly affects the later years of the forecast (£11bn in 2027/28), although ironically the average is a better proxy for the long-term cost of this change, which the OBR estimates is around £3bn a year.
Other tax changes offset this to a small extent.
Spending and other changes of £6bn a year on average comprise incremental spending of £7bn a year plus £2bn higher debt interest to fund that spending, less £3bn in positive economic effects from that spending and from the tax measures above.
Although the cumulative fiscal deficit over five years has been revised down by £4bn, the OBR has revised its forecast for public sector net debt as of 31 March 2028 up by £94bn from to £3,004bn. This principally reflects changes in the planned profile of quantitative tightening and higher lending to students and businesses.
The big gamble the Chancellor appears to be making by choosing to opt for tax cuts now is that the OBR and Bank of England’s pessimistic forecasts for the economy are not realised – enabling him to find extra money in future fiscal events to cover the effect of inflation on public service spending. Otherwise, while it may be possible to cut public spending by as much as the Autumn Statement suggests, it is difficult to see how he can do so without a further deterioration in the quality of public services given he is not providing any additional investment in technology, people and process transformation to deliver sustainable efficiency gains.
The ‘elephant in the room’ of growing numbers of pensioners and what that will mean for the long-term prospects of the public finances is likely to be avoided yet again at next week’s Autumn Statement.
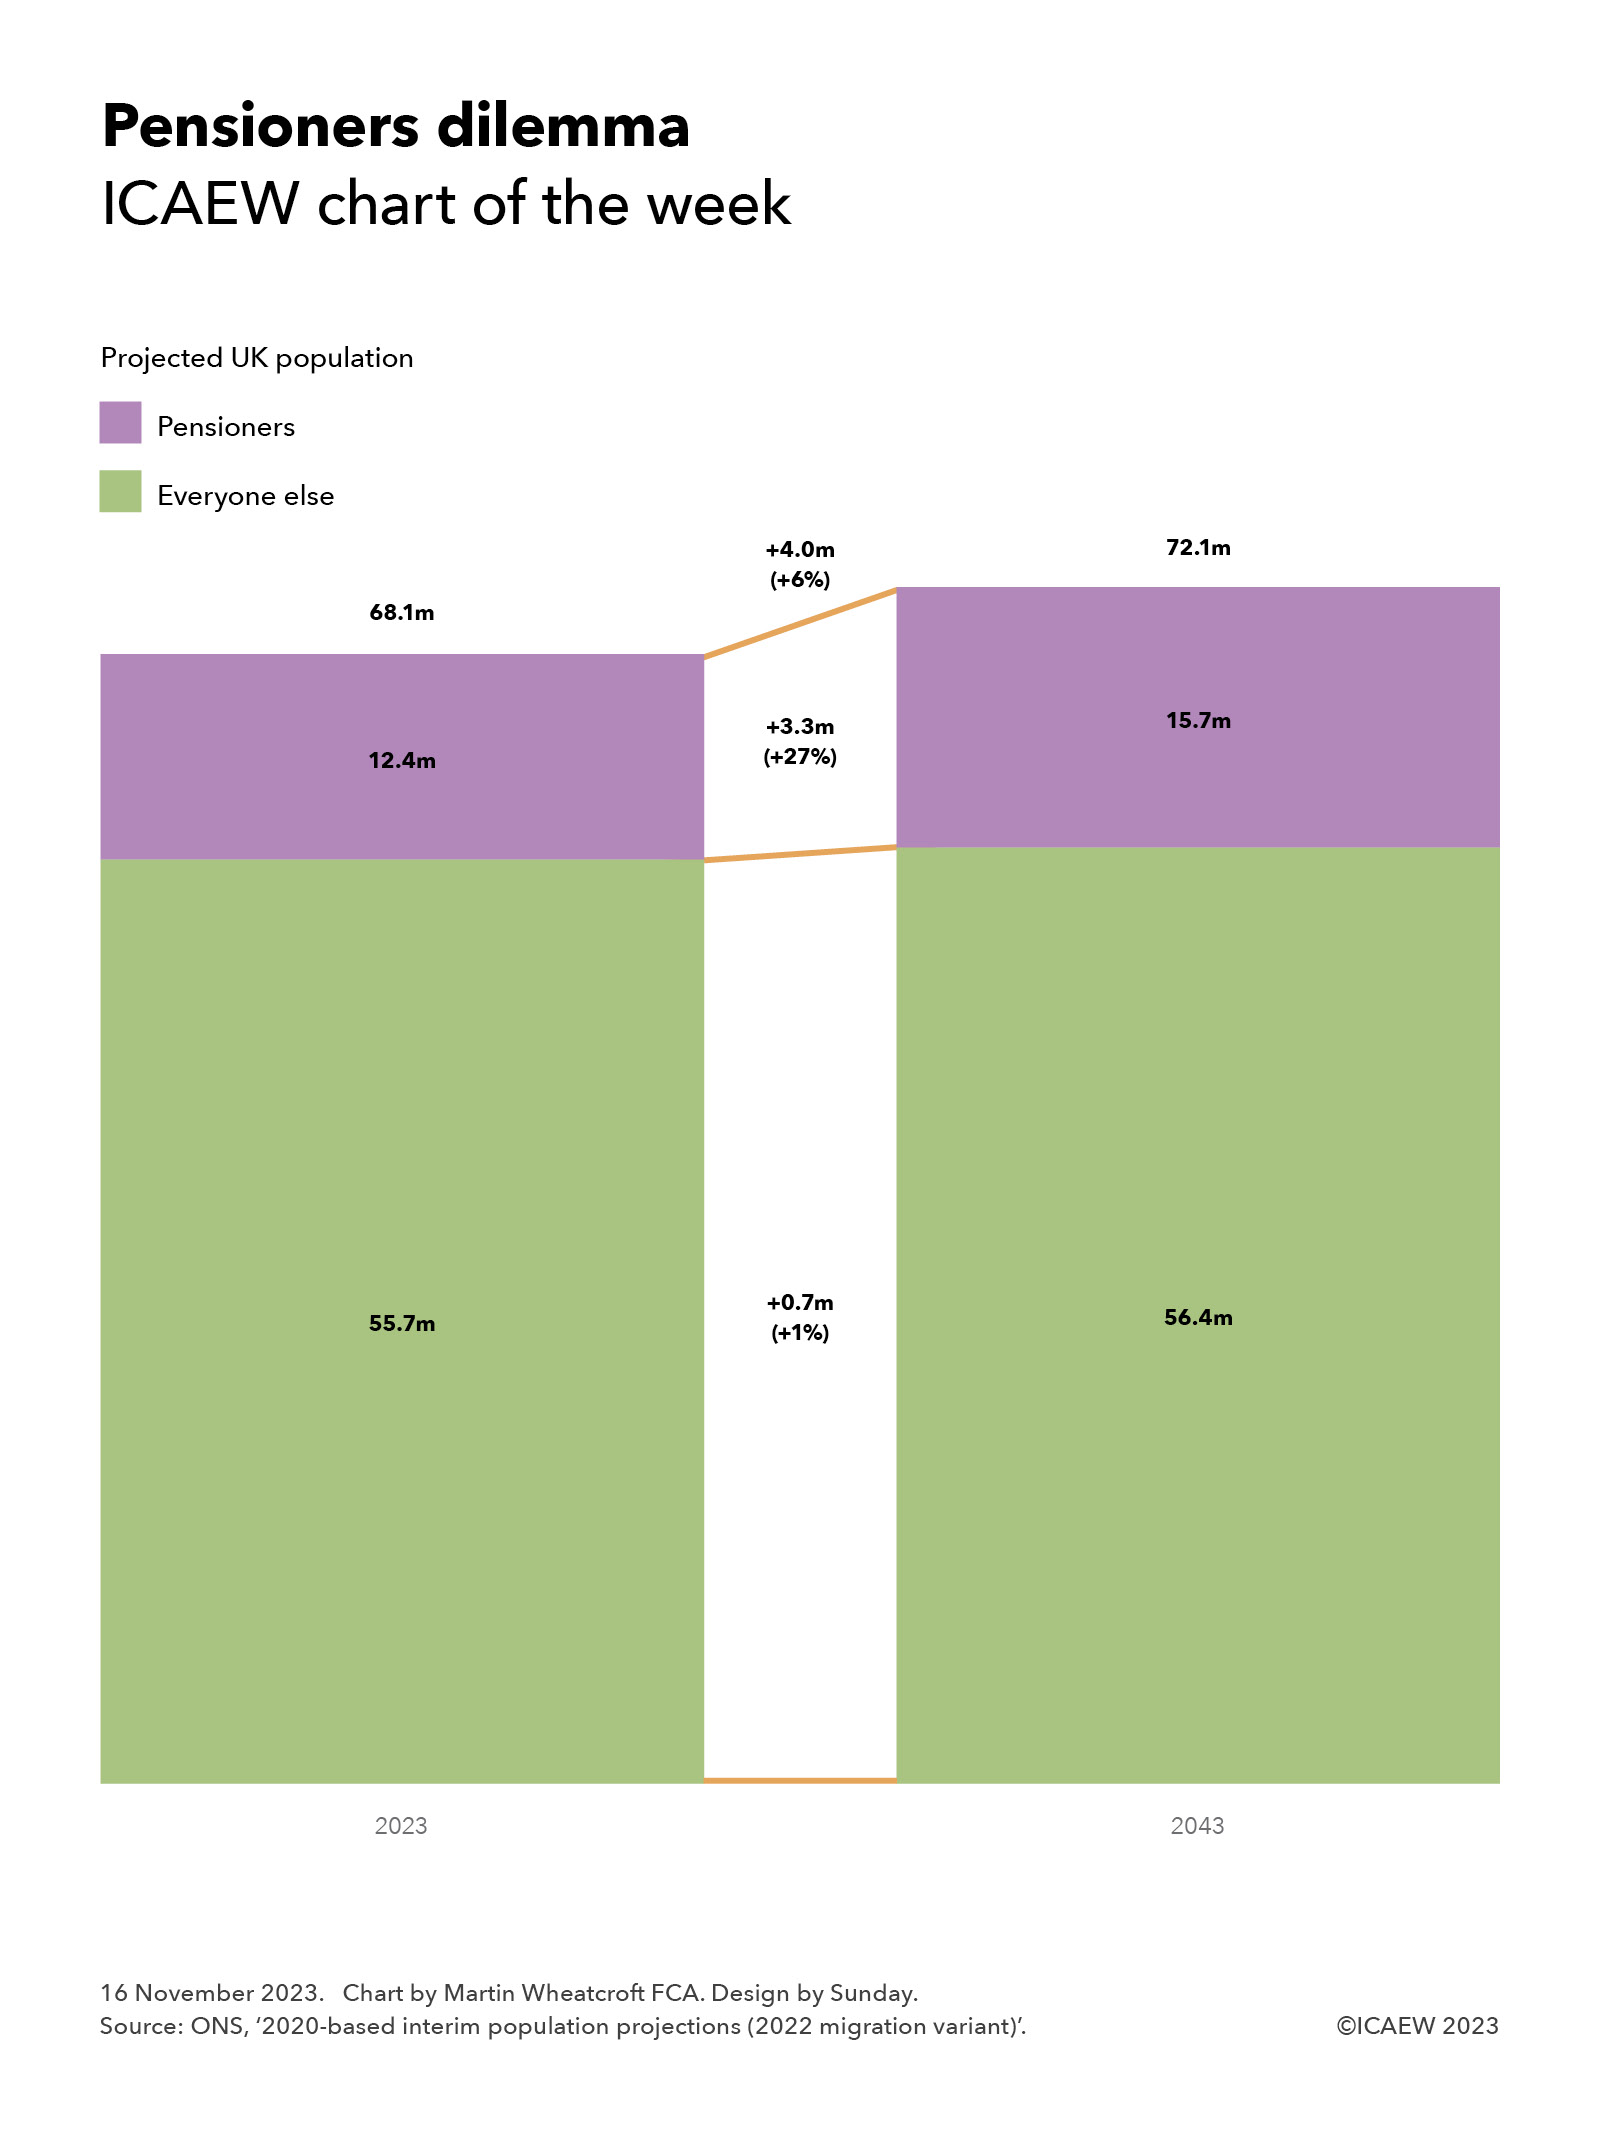
My chart for ICAEW this week is on the ‘elephant in the room’ that haunts fiscal events such as next week’s Autumn Statement – the rapidly rising number of pensioners that is driving some of the biggest line items in the national budget: pensions, health and social care.
This fiscal event is unlikely to be any different, with the Chancellor expected to focus most of his statement on short-term measures to free up headroom for pre-election tax cuts at a time of stagnant economic growth.
Any substantive discussion on the long-term prospects for the public finances is likely to be absent beyond a continued commitment to seeing the debt to GDP ratio start to fall within the next five years. How he – or more likely his successors – might be able to avoid having to raise taxes significantly in the coming decades to pay for the cost of pensions, health and social care for many more people, living longer, sometimes less healthy lives, is unlikely to be at the core of what is announced.
To illustrate the dilemma facing policymakers and the public, our chart shows how pensioners represent 3.3m out of the 4.0m projected increase in the size of the UK population between 2023 and 2043. The total population of the UK is projected to increase by 6% from 68.1m in 2023 to 72.1m in 2043, with the number of pensioners expected to increase by 27% from 12.4m this year to 15.7m in 20 years’ time.
The number of non-pensioners is expected to increase by 0.7m or 1% from 55.7m to 56.4m, with net inward migration of 5.0m over that period offsetting what would otherwise be a significant fall in the numbers below retirement age. (Not shown in the chart is a projected 3% rise in the working age population and a 7% fall in the number of children.)
The projected 27% rise in the number of pensioners is despite a planned increase in the state pension age from age 66 to age 67 in 2027, one of the few long-term steps the government has taken to mitigate the fiscal effects of rising pensioner numbers. However, increasing the retirement age doesn’t directly impact health and social care costs, as well as being partly offset by the cost of supporting increasing numbers of people out of work between traditional retirement age and the age at which they can take their state pension.
Given the significance of the demographic challenge to the public finances, there is very little public debate on what to do, especially as the current policy of cutting the proportion of spending going on public services outside of health appears increasingly unsustainable.
Spending on defence and security (the traditional budget to raid) is already close to the NATO minimum and appears likely to need to increase given the global security situation, while extracting further savings from other public services seems extremely unlikely, especially given the reluctance of successive governments to put in the level of upfront and ongoing capital investment that might make operational savings possible.
The irony is that, unlike the game-theory scenario of the prisoners’ dilemma that makes optimal decision-making difficult for two prisoners who can’t communicate with each other, there is no theoretical restriction on the ability of policymakers to talk to the public about the pensioners dilemma and to have a proper debate about that might mean for taxes and public services in the long term.
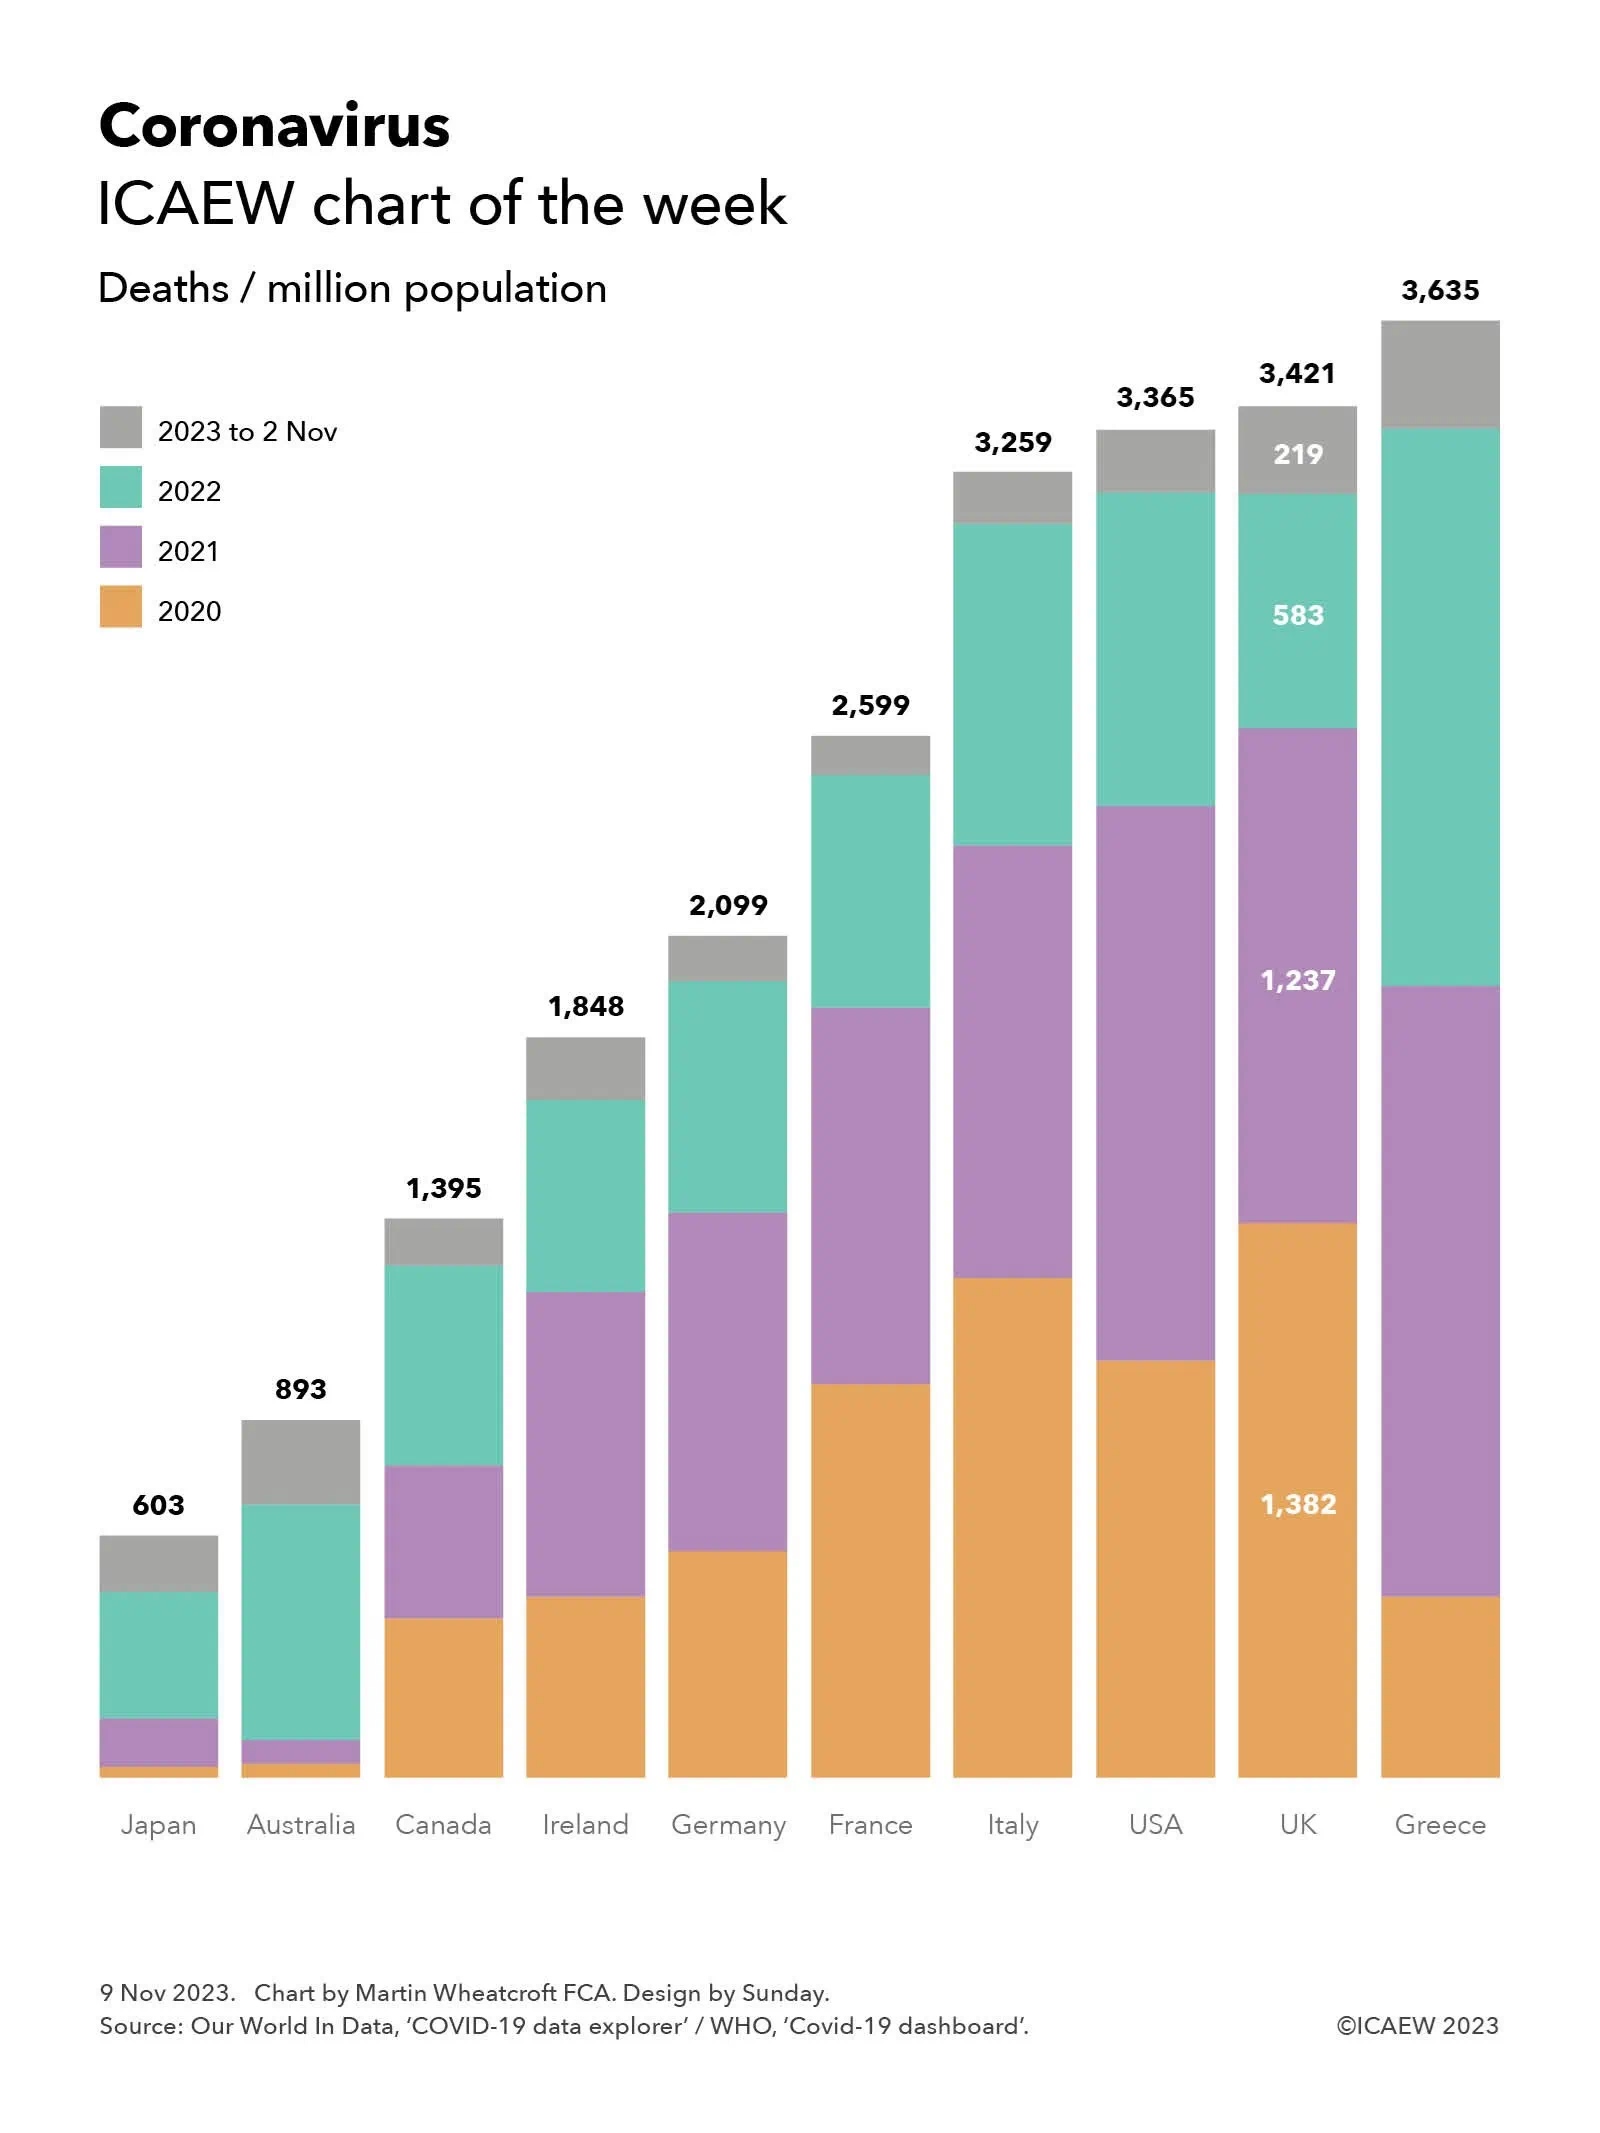
My chart this week looks at one of the big questions being looked at by the UK COVID-19 Inquiry: why did the UK experience one of the highest death rates in the developed world?
According to the official statistics, there were 3,421 deaths per million population attributed to COVID-19 in the UK between 1 January 2020 and 2 November 2023. This compares with 603 deaths per million in Japan, 893 in Australia, 1,395 in Canada, 1,848 in Ireland, 2,099 in Germany, 2,599 in France, 3,259 in Italy, 3,365 in the US and 3,635 in Greece.
Not shown in the chart are the total number of cumulative deaths attributed to COVID-19 (ie before dividing by the population) of 74,694 in Japan, 23,289 in Australia, 53,297 in Canada, 9,281 in Ireland, 174,979 in Germany, 167,985 in France, 192,406 in Italy, 1.14m in the USA, 230,974 in the UK, and 37,738 in Greece.
Both Our World In Data and the WHO give warnings about the data, especially given difficulties in identifying which deaths were caused by the coronavirus (especially in 2020 before testing was widely available), whether deaths are recorded when they happened or when they were reported, and differences in how countries attribute deaths to causes.
Despite those factors, these statistics give an overall impression of how badly the coronavirus affected different countries, especially when combined with other data, such as excess mortality (also not shown in the chart). According to Our World In Data, the cumulative difference between total deaths reported from all causes and projected deaths (based on an extrapolation from the years prior to the pandemic) changes the rankings for the countries in our chart, improving the UK’s position to an extent with the US has more excess deaths proportionately than the UK, and Italy more than Greece. Australia has the lowest level of excess deaths for these countries, below Japan, while France is between Canada and Ireland.
The chart also illustrates the deaths per million of population by year, highlighting how for the UK this was 1,382 in 2020, 1,237 in 2021, 583 in 2022, and 219 in 2023, up to 2 November 2023.
The UK COVID-19 Inquiry is looking at much more than the number of deaths as it considers how coronavirus affected all of us over the past few years, how people were affected, including short- and long-term impacts on health and how people died, as well as the impact on the economy and our lives more generally of COVID-19 – and the UK Government’s response to it.
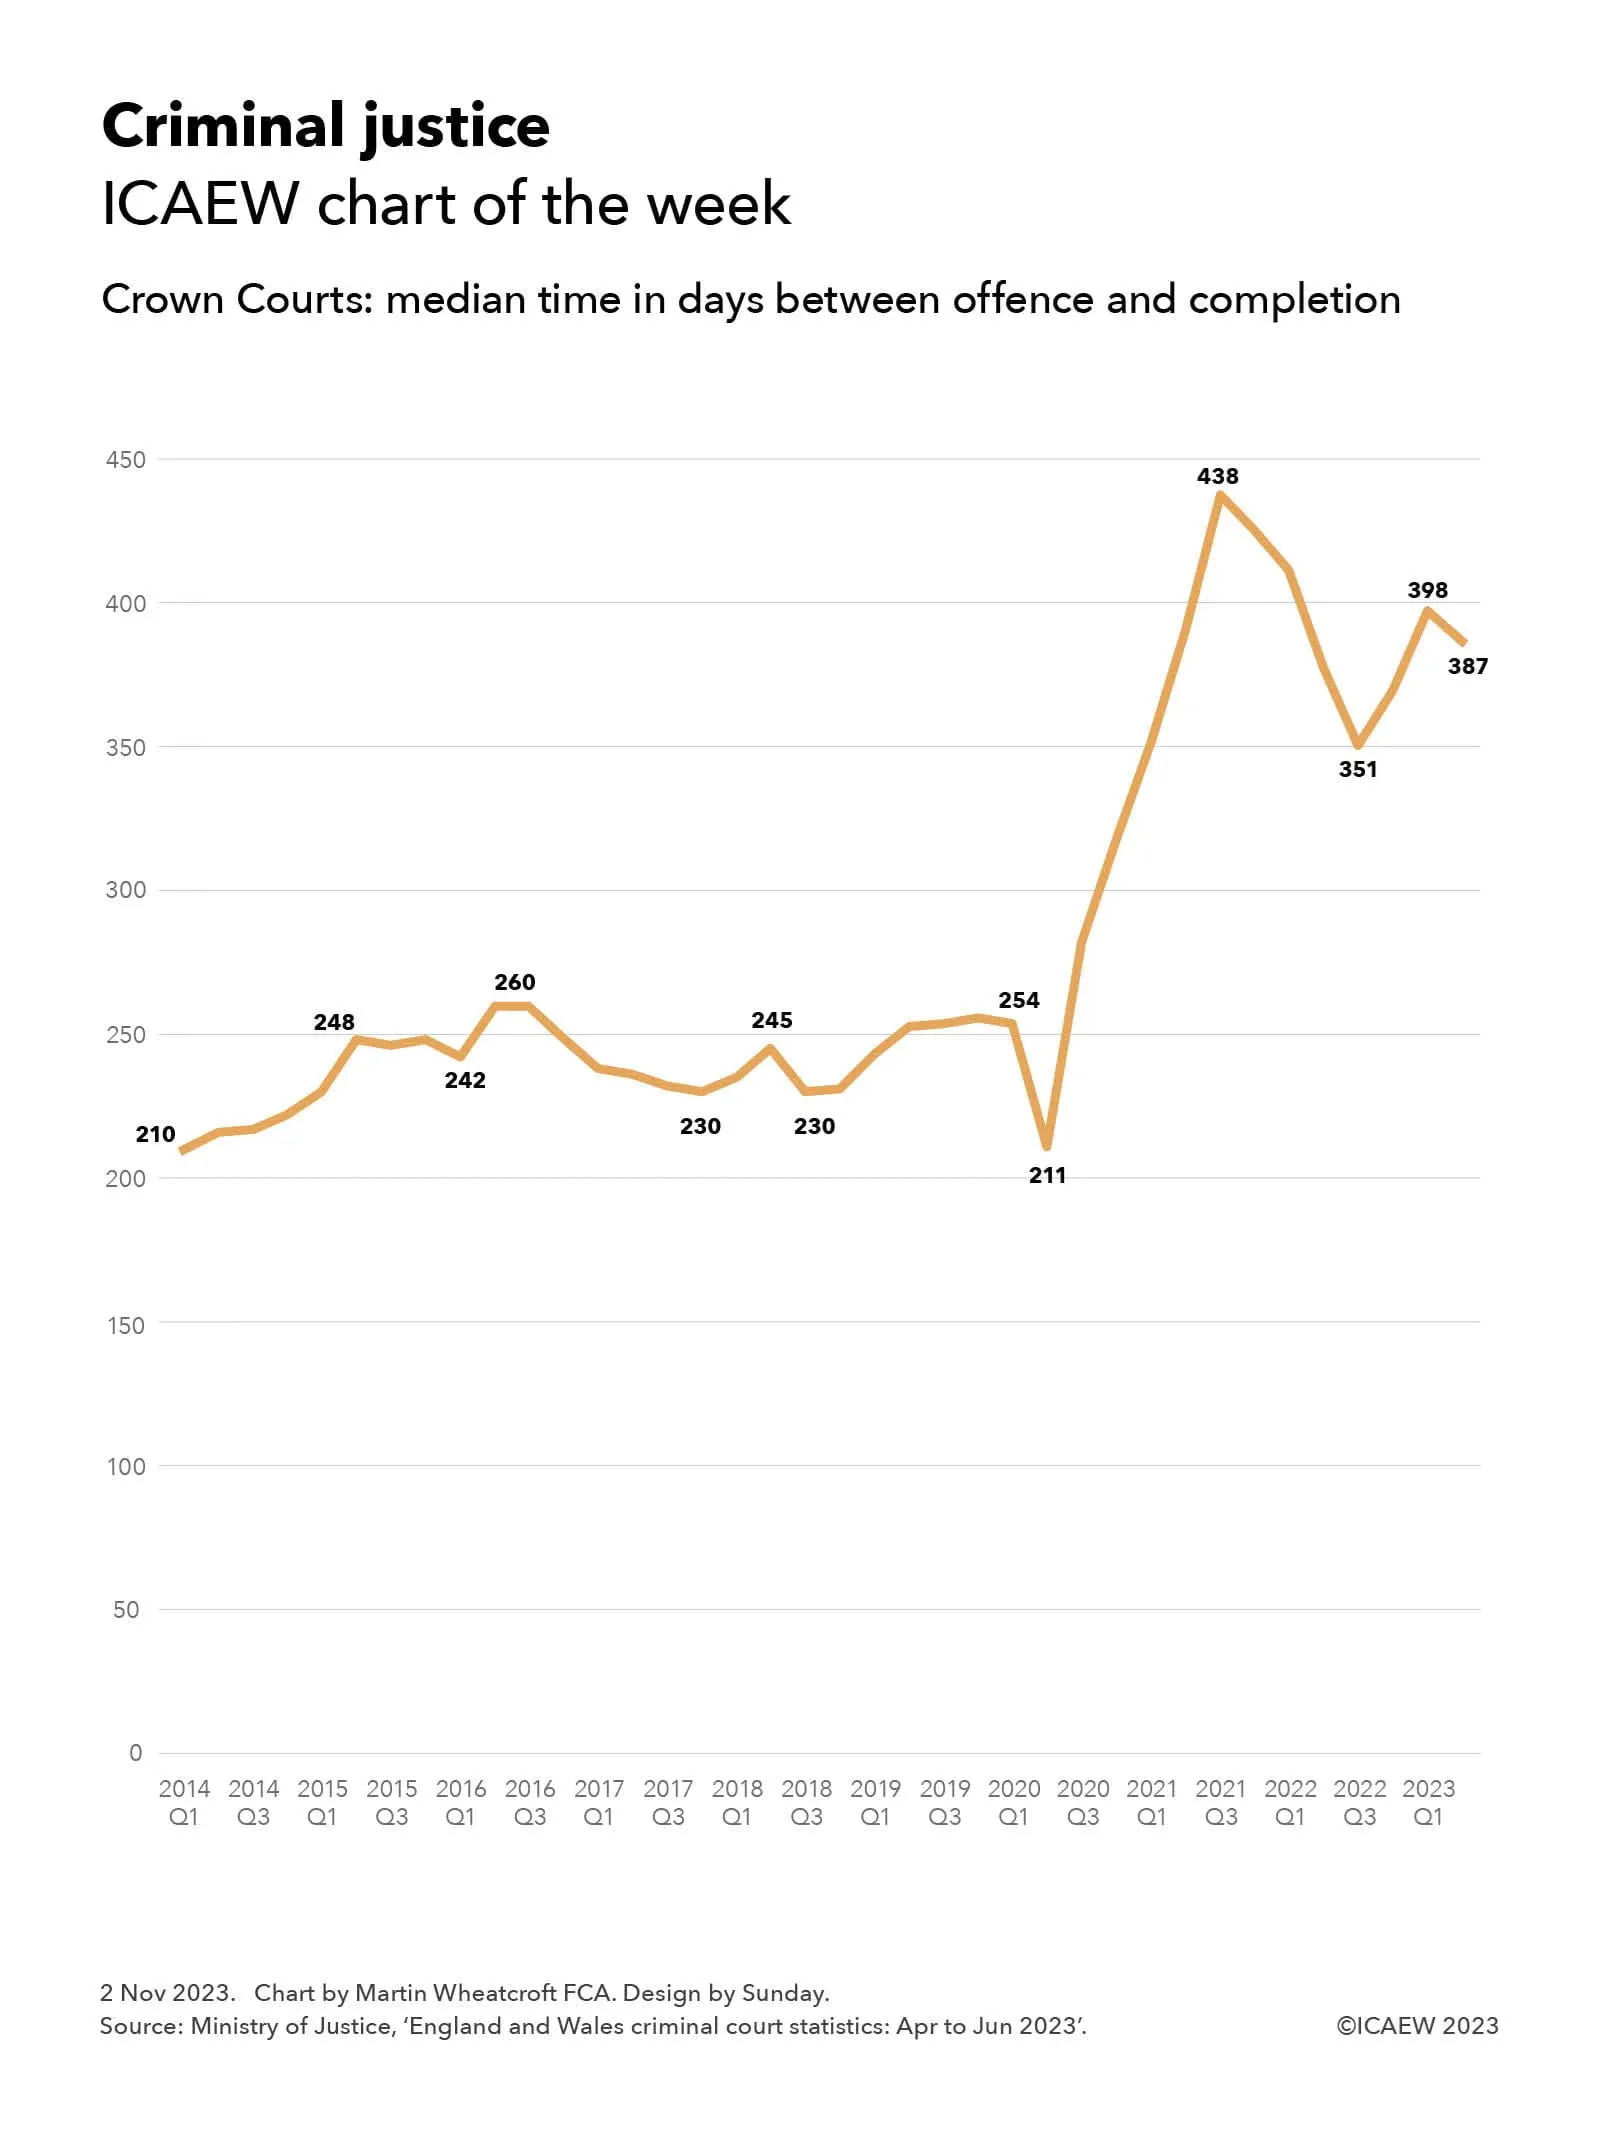
My chart this week looks at how the criminal justice system in England and Wales is performing by examining how long cases are taking to make their way through the Crown Courts to completion.
My chart this week is inspired by the Institute for Government (IfG) and CIPFA Performance Tracker 2023 published on 31 October 2023. Concluding that “government is stuck in a public service doom loop”, IfG and CIPFA together analyse how the performance of key public services has deteriorated in recent years, and not just because of the pandemic.
The chart (an expanded version of Figure 0.1 in the Performance Tracker) is based on the median time between an offence being committed and completion (conviction, acquittal or dismissal) in Crown Courts in England and Wales, according to Ministry of Justice statistics for the criminal justice system up to June 2023.
This is a key metric in understanding how efficient the police, prosecutors and courts together are in bringing criminals to justice, as well as an indicator of just how long the lives of victims, their families, witnesses and defendants are being put on hold while cases work their way through the system.
Back in the first quarter of 2014, the median time from offence to completion was 210 days (6.9 months). This trended up to reach 248 days (8.2 months) in 2015 Q2, before hovering around that level in the years before the pandemic, with our chart highlighting how it fell to 242 in 2016 Q1, rose to 260 in 2016 Q2 and Q3, fell to 230 in 2017 Q4, rose to 245 in 2018 Q2, back to 230 the following quarter, before rising to 254 days (8.4 months) in the first quarter of 2020 at the start of the pandemic.
The median fell to 211 days in 2020 Q2 as more complex cases were deferred during the first lockdown, increasing sharply to reach a peak of 438 days (14.4 months) by the third quarter of 2021. The time taken improved to 351 days (11.5 months) by the third quarter of 2022 as the courts started to clear the backlog, but then increased to 398 days (13.1 months) in the first quarter of 2023. The most recent data is for the second quarter, with a median average time taken of 387 (12.7 months) for cases completing in that quarter.
While there are inevitably going to be a number of complex criminal cases that are going to take a long time to be investigated and then come to trial, for the median average case to be taking more than a year to complete its journey through the justice system in England and Wales is not a good sign.
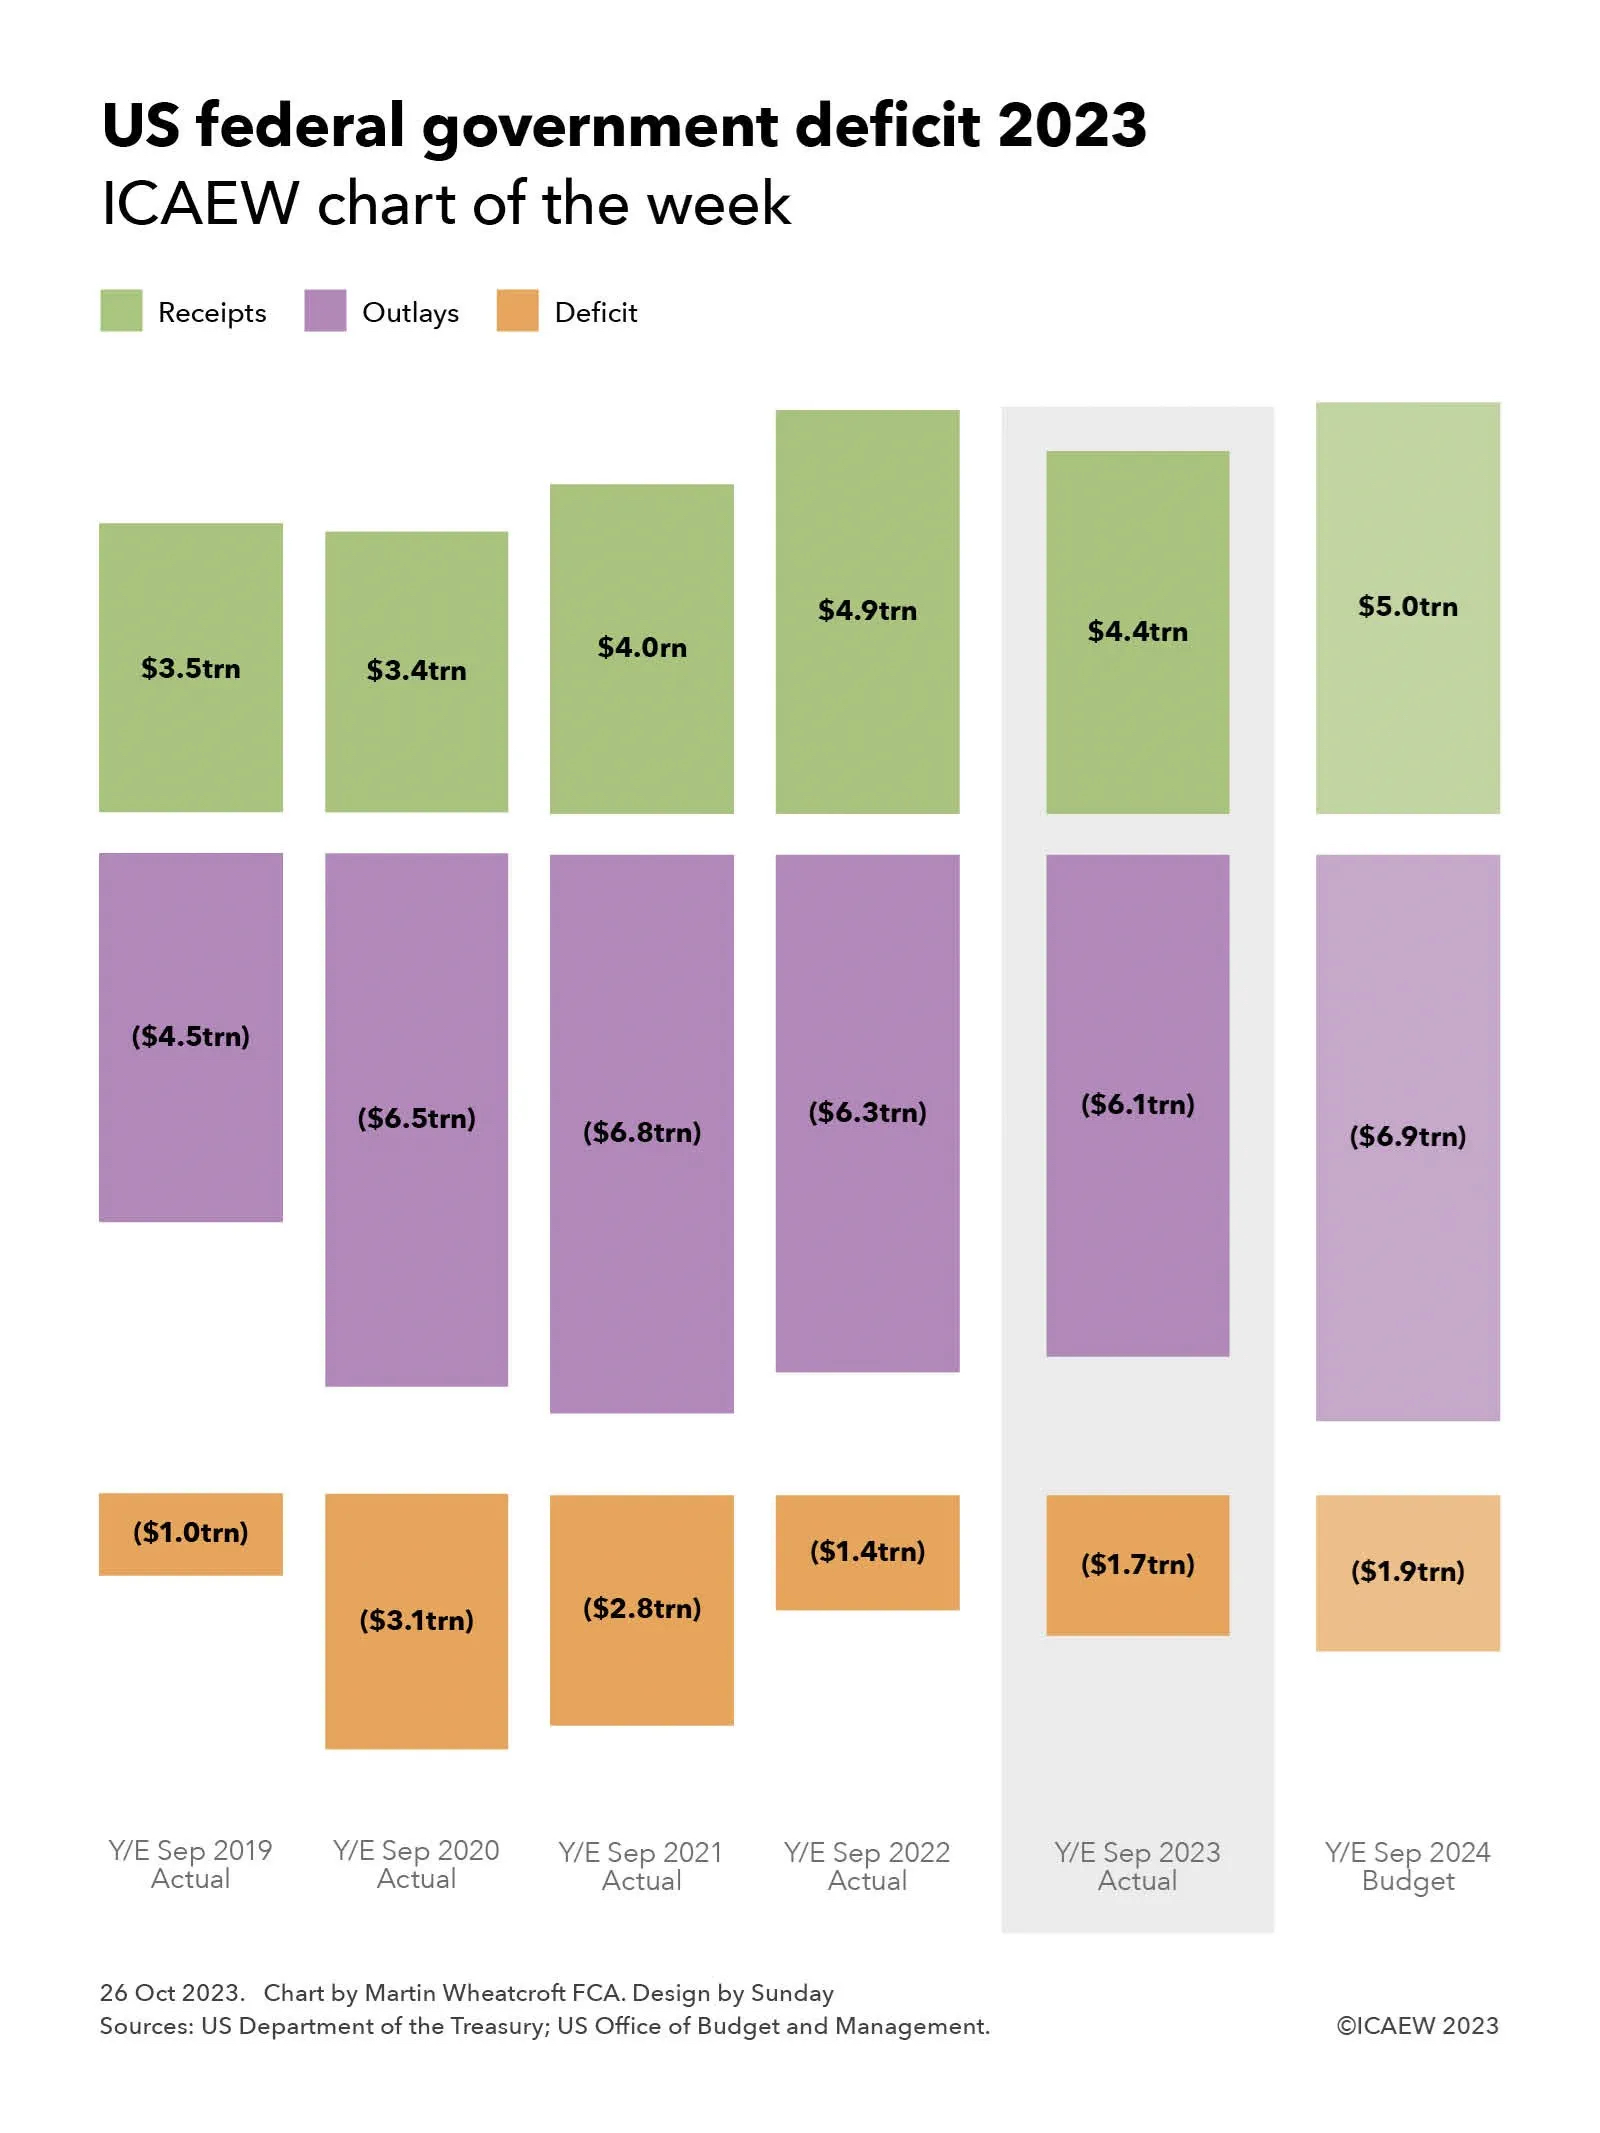
My chart this week looks at the federal deficit of $1.7trn reported by the US government for its recently completed financial year ended 30 September 2023.
The US Department of Treasury published on 20 October 2023 its final monthly treasury statement for the US government’s financial year ended 30 September 2023 (FY2023), enabling our chart this week to look at the actual numbers over the past five years and the budget for the new financial year that started on 1 October.
Our chart illustrates how the deficit increased significantly from the $1.0trn reported for FY2019 ($3.5trn receipts less $4.5trn outlays) to $3.1trn in FY2020 ($3.4trn-6.5trn) and $2.8trn in FY2021 ($4.0trn-$6.8trn) at the height of the pandemic, before falling to $1.4trn in FY2022 ($4.9trn-$6.3trn) as the US economy recovered. The deficit by $0.3trn increased to $1.7trn in FY2023 ($4.4trn-$6.1trn) and is budgeted to increase by a further $0.2trn to $1.9trn in FY2024 ($5.0trn forecast receipts-$6.9trn forecast outlays).
Not shown in the chart is the excess of financial liabilities over financial assets, which increased by $1.7trn from $22.3trn on 30 September 2022 to $24.0trn on 30 September 2023. This differs from ‘debt held by the public’ (the headline measure of federal debt), which increased by $2.0trn from $24.3trn to $26.3trn, more than the federal deficit because of movements in other financial assets and liabilities.
Receipts in FY2023 of $4,439bn comprised $2,176bn in individual income taxes, £1,614bn in social security and retirement contributions, $420bn in corporation income taxes, $80bn in customs duties, $76bn in excise taxes, £34bn in estate and gift taxes and $39bn in other receipts. Outlays for same period of $6,134bn comprised $1,737bn on health and Medicare, $1,354bn on social security, $821bn on defence, $774bn in welfare benefits, $659bn in interest, $302bn for veteran services and benefits, $127bn on transportation, $100bn on commerce, and $260bn on other outlays.
The latter includes the administration of justice, agriculture, community and regional development, education, training, employment and social services, energy, general government, general science, space and technology, international affairs, natural resources and environment, and undistributed offsetting receipts.
These amounts are different from the accruals-based US GAAP federal government financial statements for FY2023 that are expected to be published next April, which will show a much larger accounting loss than the federal deficit reported here. For example, the FY2022 net operating cost (ie accounting loss) of $4.2trn was $2.8trn higher than the federal deficit of $1.4trn for last year, of which the largest difference of $2.6trn related to accruals for federal employee and veteran benefits.
These amounts appear astronomical, especially to those of us living in smaller (and unfortunately) less prosperous countries than the 335m people who live in the US, with its estimated GDP of $26.3trn in FY2023 – equivalent to around $6,600 per person per month.
Federal receipts and outlays in FY2023 represented 17% and 23% of GDP respectively or on a per capita basis were approximately $1,105 and $1,525 per person per month. The federal deficit was therefore equivalent to 6% of GDP or $420 per person per month.
The excess of financial liabilities over financial assets and debt held by the public were 91% and 100% of GDP respectively, equivalent to an amount owed of around $71,500 or $78,500 per person, depending on which measure is used.


![Exploding debt
Step chart showing how UK public sector net has changed between March 2008 and the projected position in March 2029.
[debt bars shaded orange, changes shaded in purple]
March 2008: £0.6trn
Financial crisis: +£0.7trn
March 2012: £1.3trn
Austerity years: +£0.5trn
March 2020: £1.8trn
Pandemic / energy crisis: +£0.9trn
March 2024: £2.7trn
[bar colours shaded by 50% to indicate the following are projected numbers]
Latest plan: +£0.4trn
March 2029: £3.1trn
30 Nov 2023.
Chart by Martin Wheatcroft FCA. Design by Sunday.
Source: OBR, 'Public finances databank - Nov 2023'.](https://martinwheatcroft.com/wp-content/uploads/2023/11/icaewchart286debt.jpg)