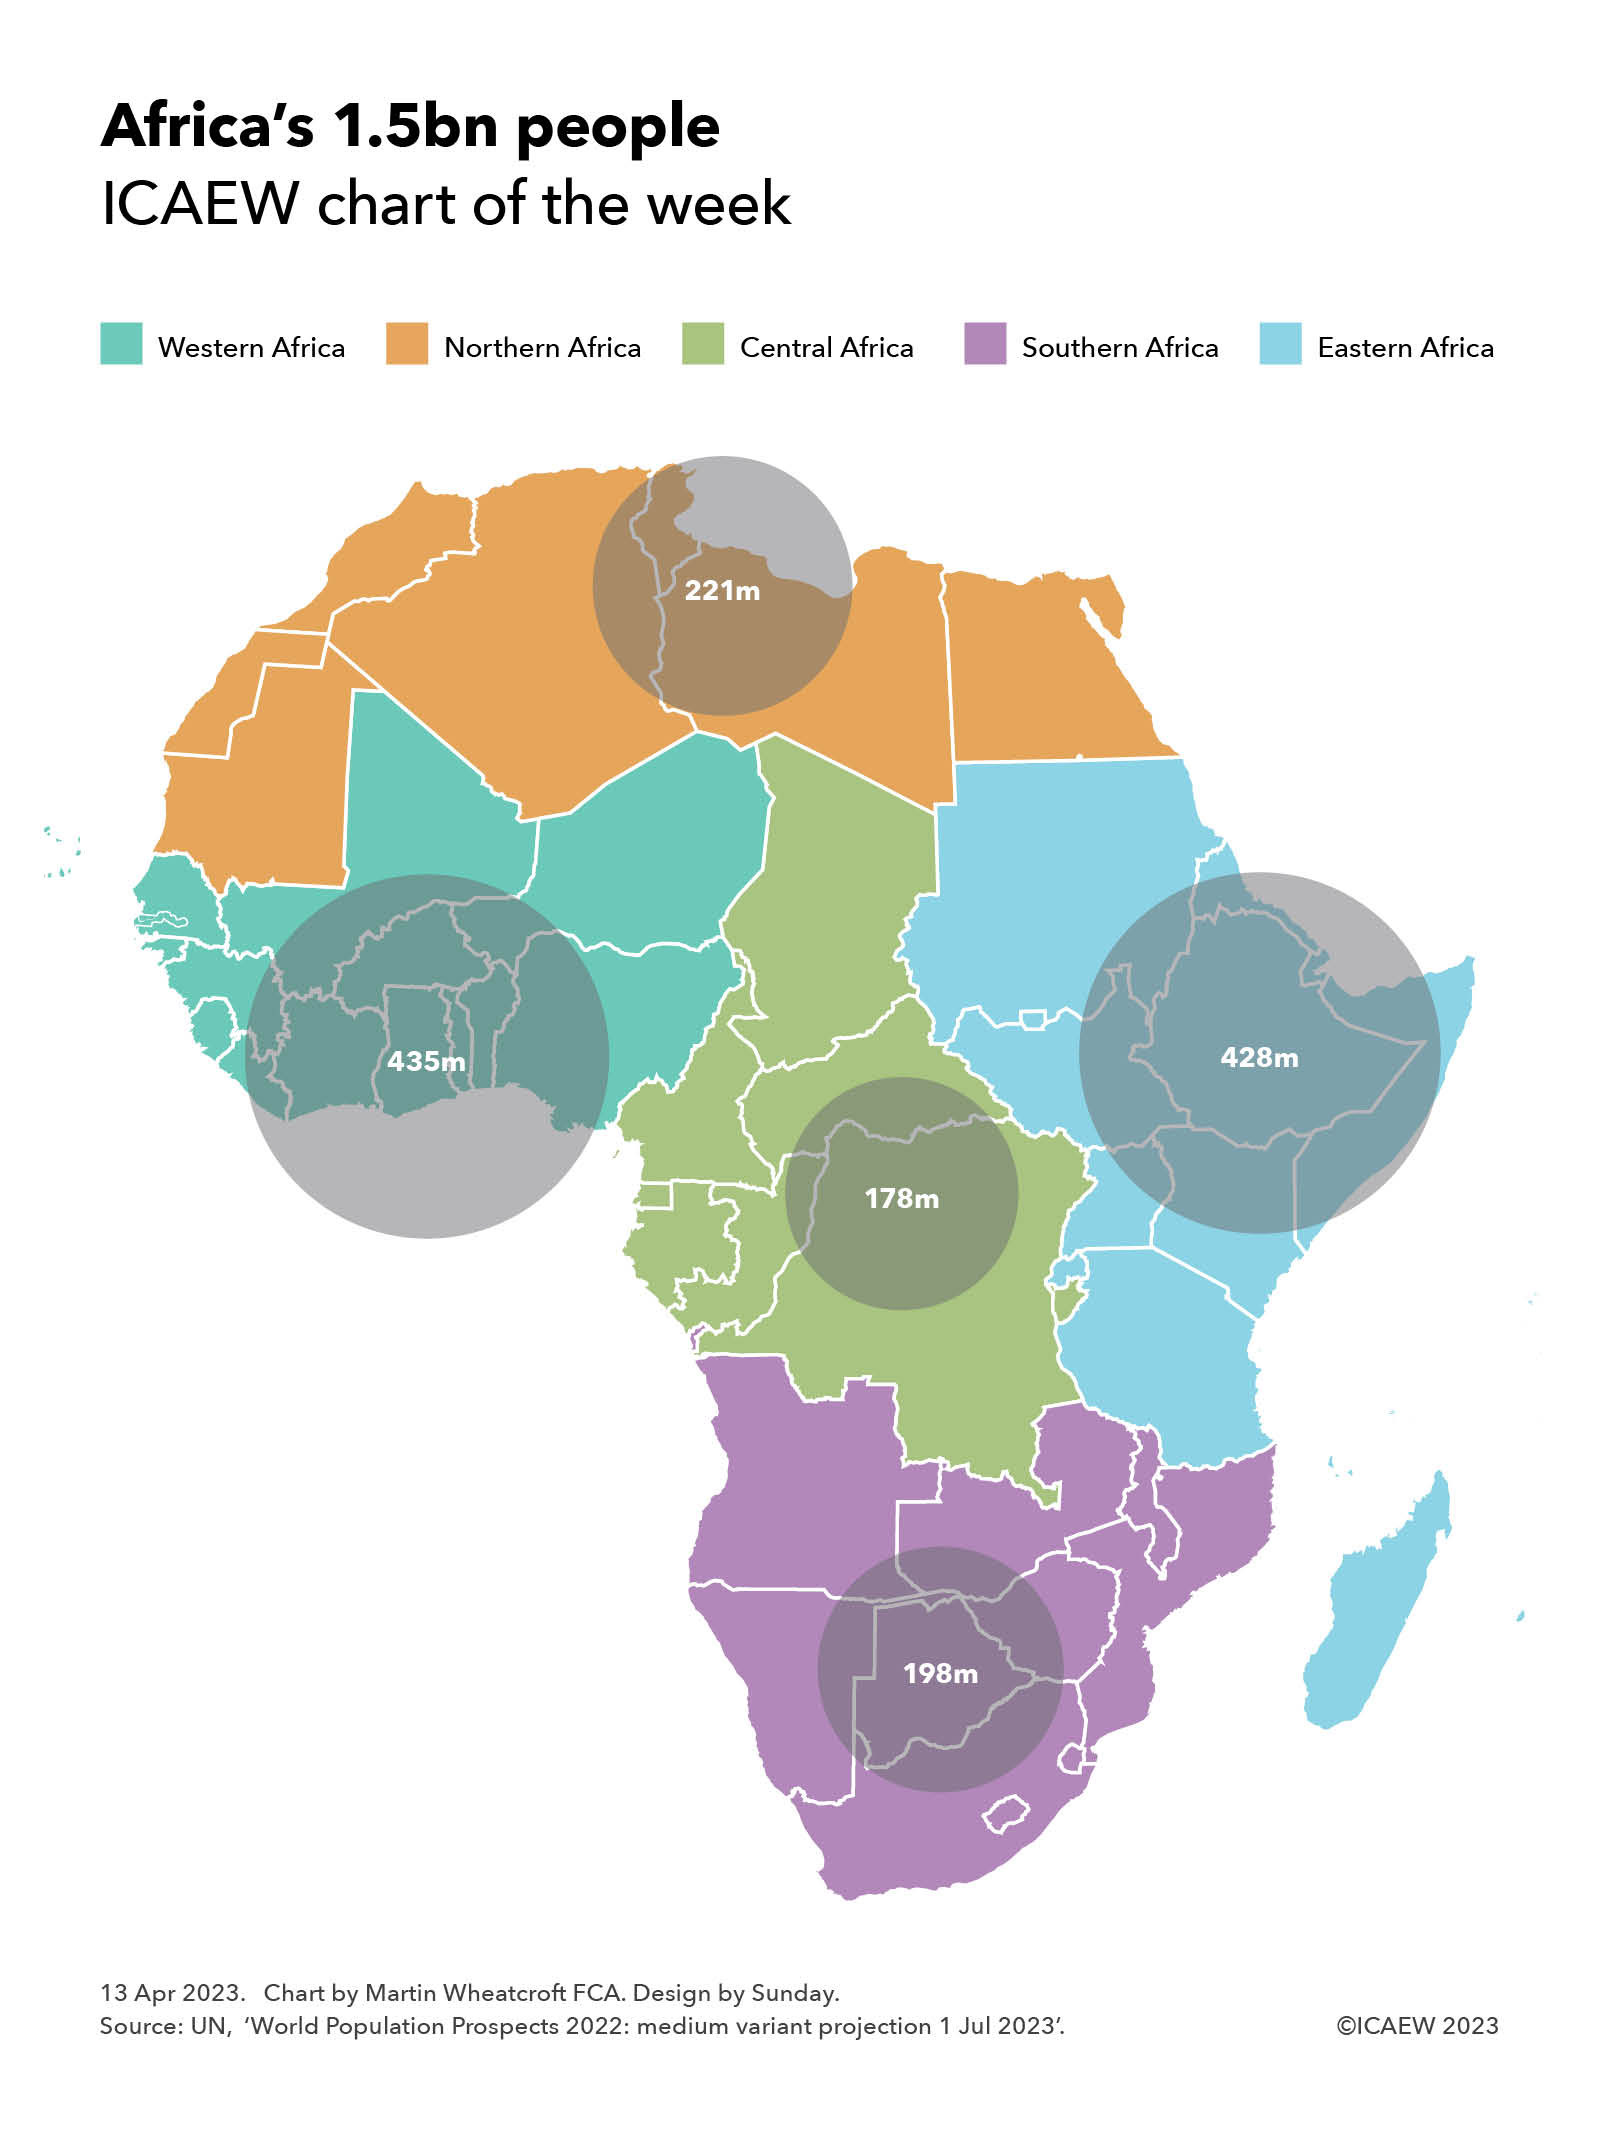
As the ONS reports that just over 600,000 more people came to live in the UK in 2022 than left to live elsewhere, this week’s chart looks at the numbers behind the comings and goings.
Net inward migration of 606,000 in the year ended 31 December 2022 was boosted by a quarter of a million Ukrainians, Hong Kongers and asylum seekers according to ONS experimental statistics on international migration to and from the UK.
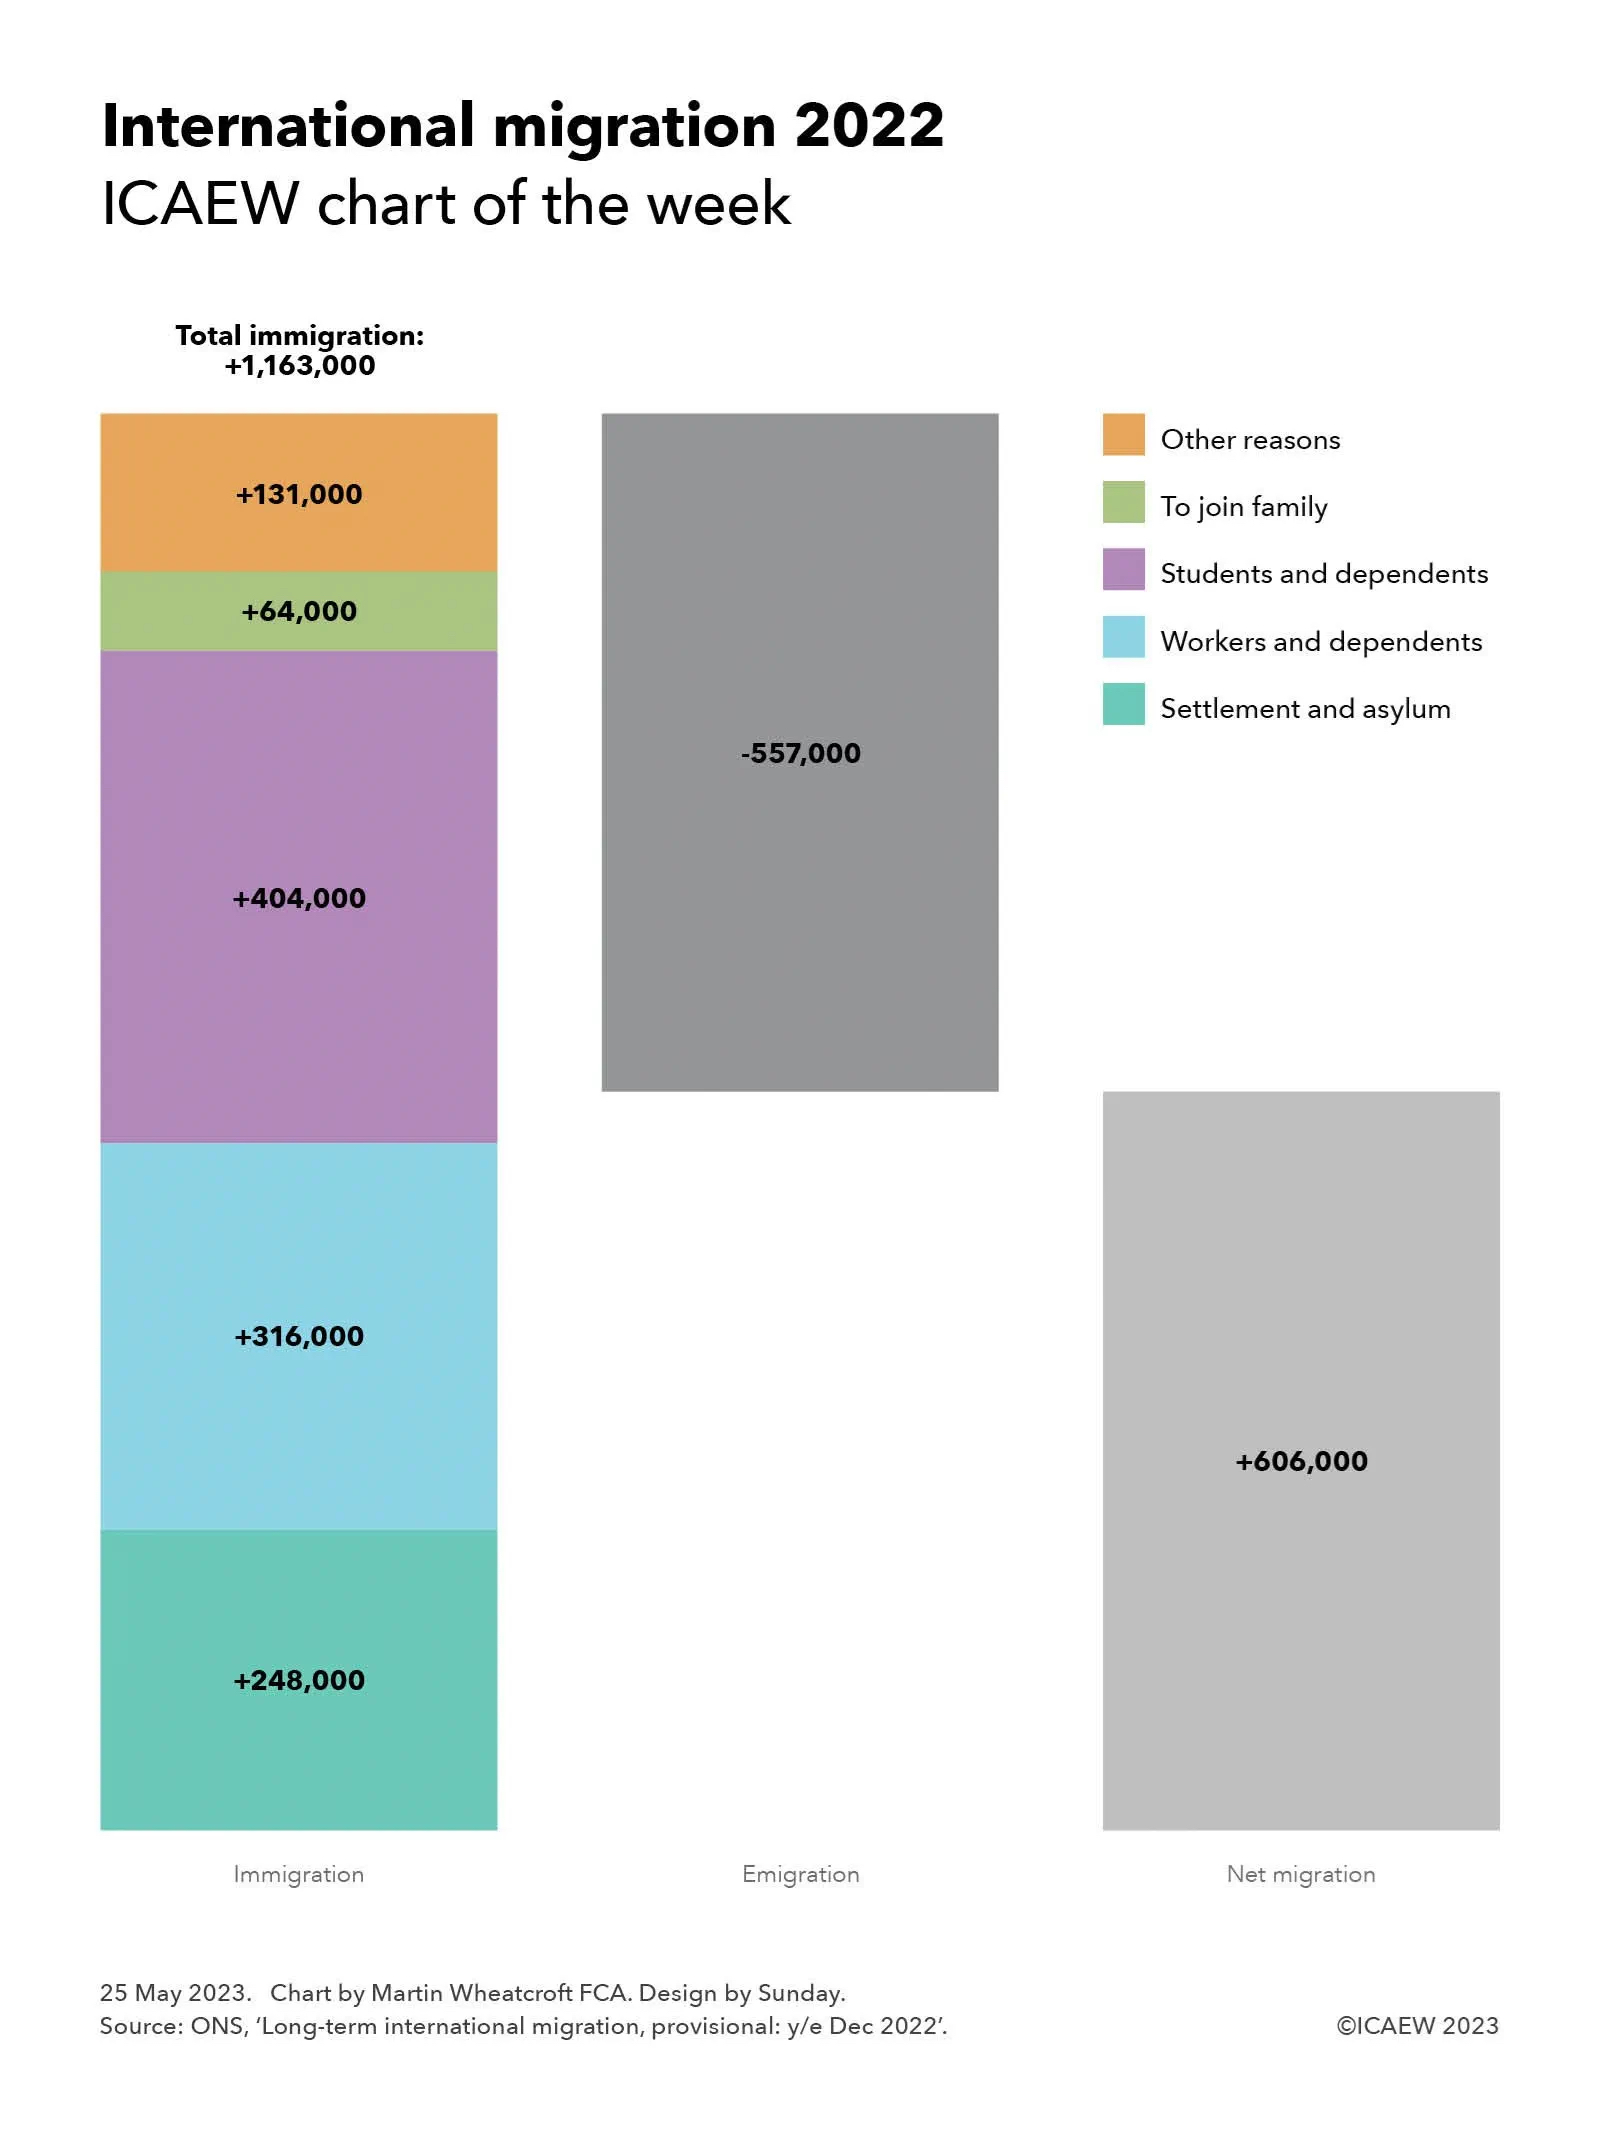
The Office for National Statistics (ONS) released provisional numbers for international migration on 25 May 2023, providing its estimate of long-term arrivals and departures from the UK for the 2022 calendar year, with 1,163,000 immigrants arriving in the UK and 557,000 emigrants, a net migration number of 606,000.
These numbers exclude tourists and other travellers planning to stay for less than a year, as well as UK residents going abroad on holiday or likewise planning to be away for less than a year. However, the numbers include students and others coming for more than a year who don’t plan to stay in the UK after they finish their courses or their work visas expire.
Traditionally these statistics have been prepared using arrival and departure surveys completed by a sample of travellers when they arrive or depart from UK airports and ports, but these have been found to be inaccurate in recent years. The ONS has started to address this by using other administrative sources to improve the quality of their analysis, in the meantime slapping this dataset with ‘experimental’ and ‘provisional’ labels to emphasise how less than definitive it is.
As our chart of the week illustrates, 248,000 immigrants arrived through settlement schemes or to claim asylum, 316,000 came for work reasons, 404,000 for study, 64,000 to join family, and 131,000 for other reasons.
All of the 248,000 immigrants who arrived through settlement schemes or to claim asylum came from outside the EU. They comprised 114,000 Ukrainian refugees, 52,000 British Overseas Nationals from Hong Kong, 6,000 through other resettlement schemes (principally Afghanistan), and 76,000 asylum seekers. Some 3,000 asylum seekers were believed to have left the country in 2022, but the ONS does not have sufficient data to identify the number of Ukrainian refugees or other settlers who may have returned or moved elsewhere.
Of the 316,000 who came for work reasons, 235,000 were from outside the EU (of which 127,000 came to work and 108,000 were dependents), 62,000 came from EU countries, and 19,000 were UK citizens. Unfortunately, the ONS has not been able to analyse the number of EU or UK citizens who left for work reasons (either to start a new job elsewhere or because their UK-based job came to an end), but they have estimated that 56,000 non-EU non-UK workers and dependents left the UK in 2022 (29,000 workers and 27,000 dependents).
Study was the biggest immigration category in 2022, as the higher education sector continued to recruit international students as part of a big export drive. 404,000 people arriving during 2022. This comprised 361,000 from outside the EU (of which 276,000 came to study and 85,000 were dependents), 39,000 students from the EU and 4,000 being UK citizens who lived elsewhere before coming to the UK to study. The ONS reports that 153,000 non-EU citizens left the UK in 2022 after courses were completed (136,000 students and 17,000 dependents), but doesn’t report equivalent numbers for EU and UK citizens.
The number of non-EU students and dependents arriving has risen quite significantly over the last couple of years (from 121,000 in 2019 and 113,000 in 2020 to 301,000 in 2021) and so the net impact should reduce significantly in 2024 and thereafter as courses complete. The net number could turn negative if the recently announced restrictions on masters students bringing dependents (masters courses often being the first step towards PhD study) causes incoming numbers to fall below the level of departures.
The majority of the 64,000 arriving to join family came from outside the EU, with 51,000 arriving from non-EU countries, 8,000 from the EU, and 5,000 being UK citizens. Again, the ONS does not have data on EU and UK citizens leaving to join family or returning after a long-term stay with family, but it does report 42,000 non-EU citizens in this category left the UK in 2022.
‘Other’ arrivals comprise a combination of genuine other reasons for people choosing to settle in the UK as well as data collection issues, with the ONS finding it difficult to identify the reasons why many EU and UK citizens arrive or leave the UK. Of the 131,000 immigrants classified as other, 29,000 came from outside the EU, 42,000 came from EU countries and around 60,000 were returning UK nationals.
While the headlines about the migration numbers have not necessarily been that favourable to the government, the Chancellor may be more cheerful than many of his colleagues given the recent improvement in the IMF’s short-term economic outlook for the UK, partly as a consequence of migrants arriving to fill domestic labour shortages, as well as the contribution to the economy of a growing number of fee-paying students.