Higher self-assessment tax receipts and end of energy support payments help improve what is otherwise a disappointing set of numbers.
The monthly public sector finances for July 2023 were released by the Office for National Statistics (ONS) on Tuesday 22 August 2023. These reported a provisional deficit for the fourth month of the 2023/24 financial year of £4bn, bringing the total deficit for the four months to £57bn, £14bn more than in the first third of the previous year.
Alison Ring OBE FCA, Public Sector and Taxation Director for ICAEW, said: “These numbers reflect a mixed set of results for the first four months of the financial year, as higher self assessment tax receipts and the end of energy price guarantee support payments led to an improved fiscal situation in July. But debt remains on track to hit £2.7trn by the end of the year, up from £1.8trn before the pandemic, adding to the scale of the challenge facing the government and taxpayers in repairing the public finances.
“Stubbornly high core inflation and the prospect of further interest rate rises will concern the Chancellor as he bears down on public spending in the hope of freeing up the money he needs to both pay for the state pension triple-lock and find room for pre-election tax cuts.”
Month of July 2023
The provisional shortfall in taxes and other receipts compared with total managed expenditure for the month of July 2023 was £4bn, being tax and other receipts of £93bn less total managed expenditure of £97bn, up 5% and 9% respectively compared with July 2022.
This was the fifth-highest July deficit on record since monthly records began in 1993, despite being a £3bn improvement over July 2022, driven by higher self assessment tax receipts and the end of payments under the energy price guarantee.
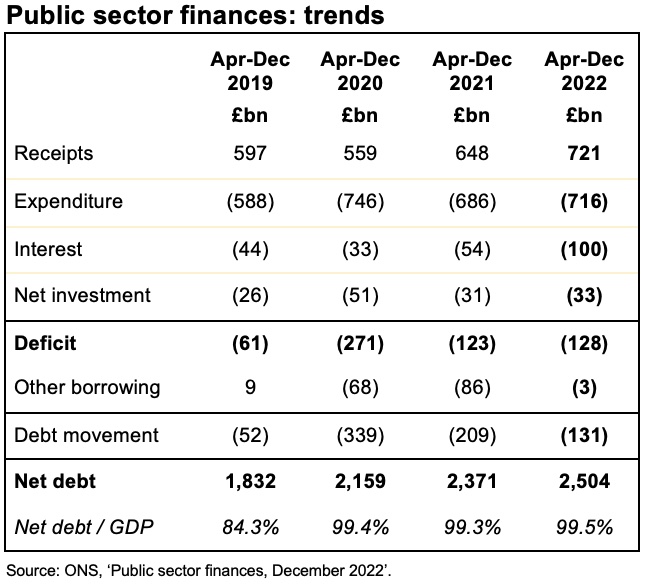
Four months to July 2023
The provisional shortfall in taxes and other receipts compared with total managed expenditure for the four months to July 2023 was £57bn, £14bn more than the £43bn deficit reported for the first third of the previous financial year (April to July 2022). This reflected a widening gap between tax and other receipts for the four months of £343bn and total managed expenditure of £400bn, up 7% and 10% respectively compared with April to July 2022.
Inflation benefited tax receipts for the four months, with income tax up 13% to £85bn and VAT up 9% to £65bn. The rise in corporation tax, up 17% to £30bn, reflected both inflation and the increase in the corporation tax rate to 25% from 1 April 2023. However, national insurance receipts were down by 3% to £57bn because of the abolition of the short-lived health and social care levy last year, while the total for all other taxes was down by 1% to £69bn as economic activity slowed. Other receipts were up 17% to £37bn, driven by higher investment income.
Total managed expenditure of £400bn in the four months to July can be analysed between current expenditure excluding interest of £334bn (up £26bn or 8% over the same period in the previous year), interest of £51bn (up £7bn or 16%), and net investment of £15bn (up £4bn or just over a third).
The increase of £26bn in current expenditure excluding interest compared with the prior year has been driven by £11bn from the uprating of benefit payments, £8bn in higher central government staff costs, £3bn in central government procurement and £5bn in energy support scheme costs, less £1bn in net other changes.
The rise in interest costs of £7bn to £51bn reflects a fall in the interest payable on index-linked debt of £6bn from £30bn to £24bn as inflation has moderated compared with the same period last year, combined with a £13bn increase in interest on non-inflation linked debt from £14bn to £27bn as the Bank of England base rate rose.
The £4bn increase in net investment spending to £15bn in the first four months of the current year reflects high construction cost inflation among other factors that saw a £5bn or 17% increase in gross investment to £35bn, less a £1bn increase in depreciation to £20bn.
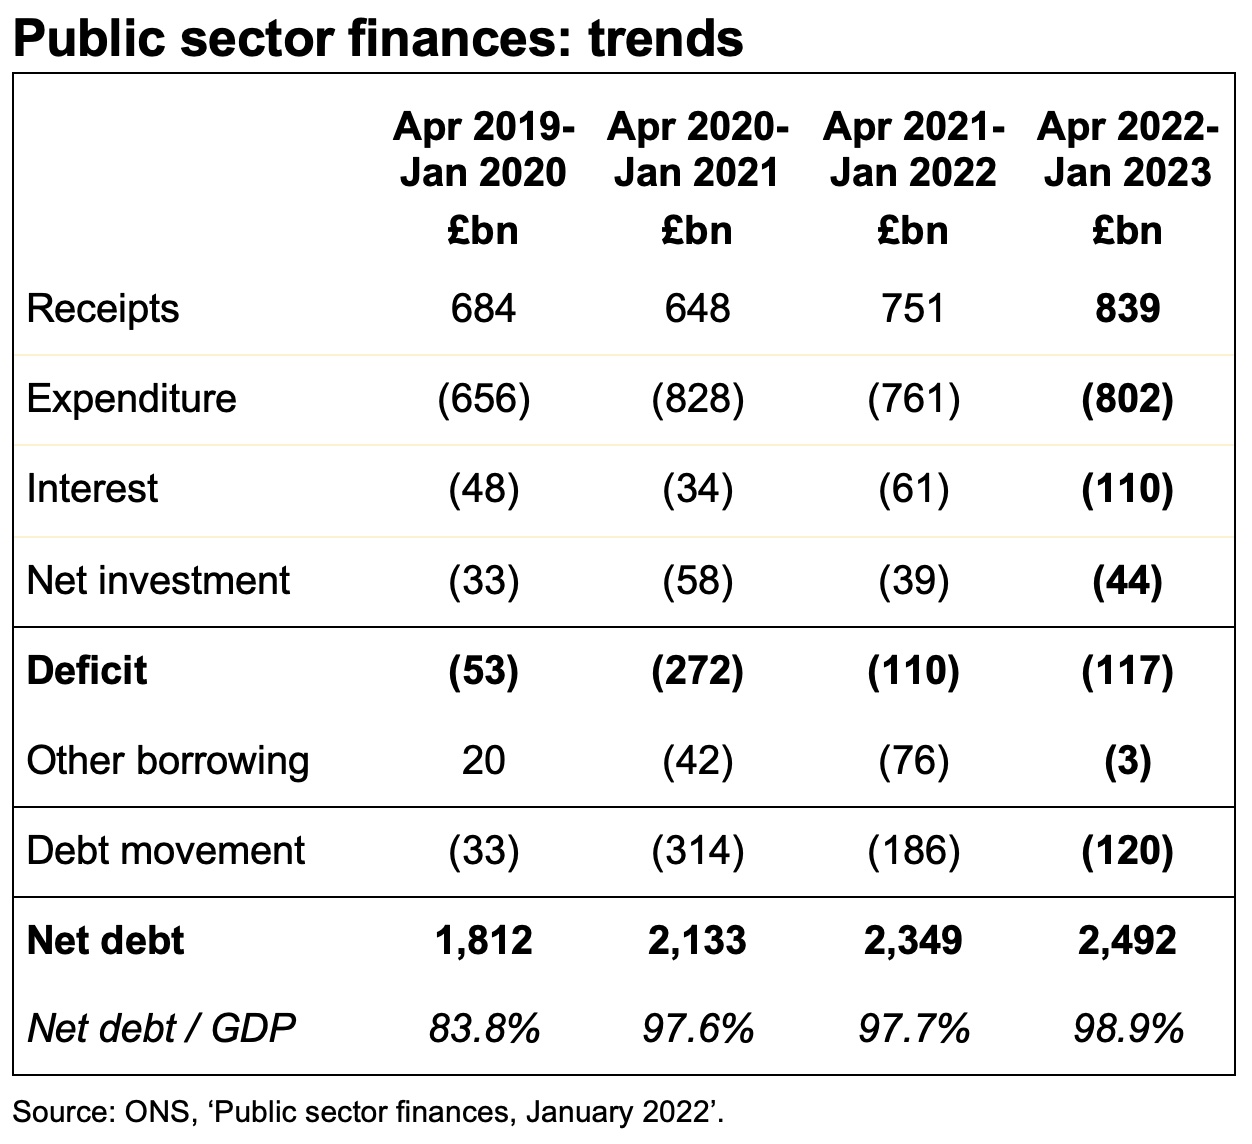
Public sector finance trends: July 2023
| Four months to | Jul 2019 (£bn) | Jul 2020 (£bn) | Jul 2021 (£bn) | Jul 2022 (£bn) | Jul 2023 (£bn) |
| Receipts | 270 | 234 | 282 | 320 | 343 |
| Expenditure | (259) | (348) | (310) | (308) | (334) |
| Interest | (24) | (15) | (23) | (44) | (51) |
| Net investment | (10) | (26) | (13) | (11) | (15) |
| Deficit | (23) | (155) | (64) | (43) | (57) |
| Other borrowing | 4 | (66) | (22) | 5 | 10 |
| Debt movement | (19) | (221) | (86) | (38) | (47) |
| Net debt | 1,796 | 2,036 | 2,239 | 2,420 | 2,579 |
| Net debt / GDP | 80.1% | 96.9% | 97.7% | 96.6% | 98.5% |
Caution is needed with respect to the numbers published by the ONS, which are expected to be repeatedly revised as estimates are refined and gaps in the underlying data are filled. The latest release saw the ONS revise the reported deficit for the three months to June 2023 down by £2bn as estimates of tax receipts and expenditure were updated for better data, as well as reduce the reported deficit for the 2022/23 financial year by £1bn from £132bn to £131bn for similar reasons. The ONS also revised its estimates of GDP for more recent economic data, resulting in a lower reported net debt / GDP ratio.
Balance sheet metrics
Public sector net debt was £2,579bn at the end of July 2023, equivalent to 98.5% of GDP.
The debt movement since the start of the financial year was £47bn, comprising borrowing to fund the deficit for the four months of £57bn plus £10bn in net cash inflows as loan repayments and positive working capital movements exceeded cash outflows for lending to students, business and others.
Public sector net debt is £764bn or 42% higher than it was on 31 March 2020, reflecting the huge sums borrowed since the start of the pandemic.
Public sector net worth, the new balance sheet metric launched by the Office for National Statistics this year, was -£631bn on 31 July 2023, comprising £1,604bn in non-financial assets, £1,011bn in non-liquid financial assets and £336bn in liquid financial assets less public sector gross debt of £2,915bn and other liabilities of £667bn. This is a £54bn deterioration from the -£577bn reported for 31 March 2023.
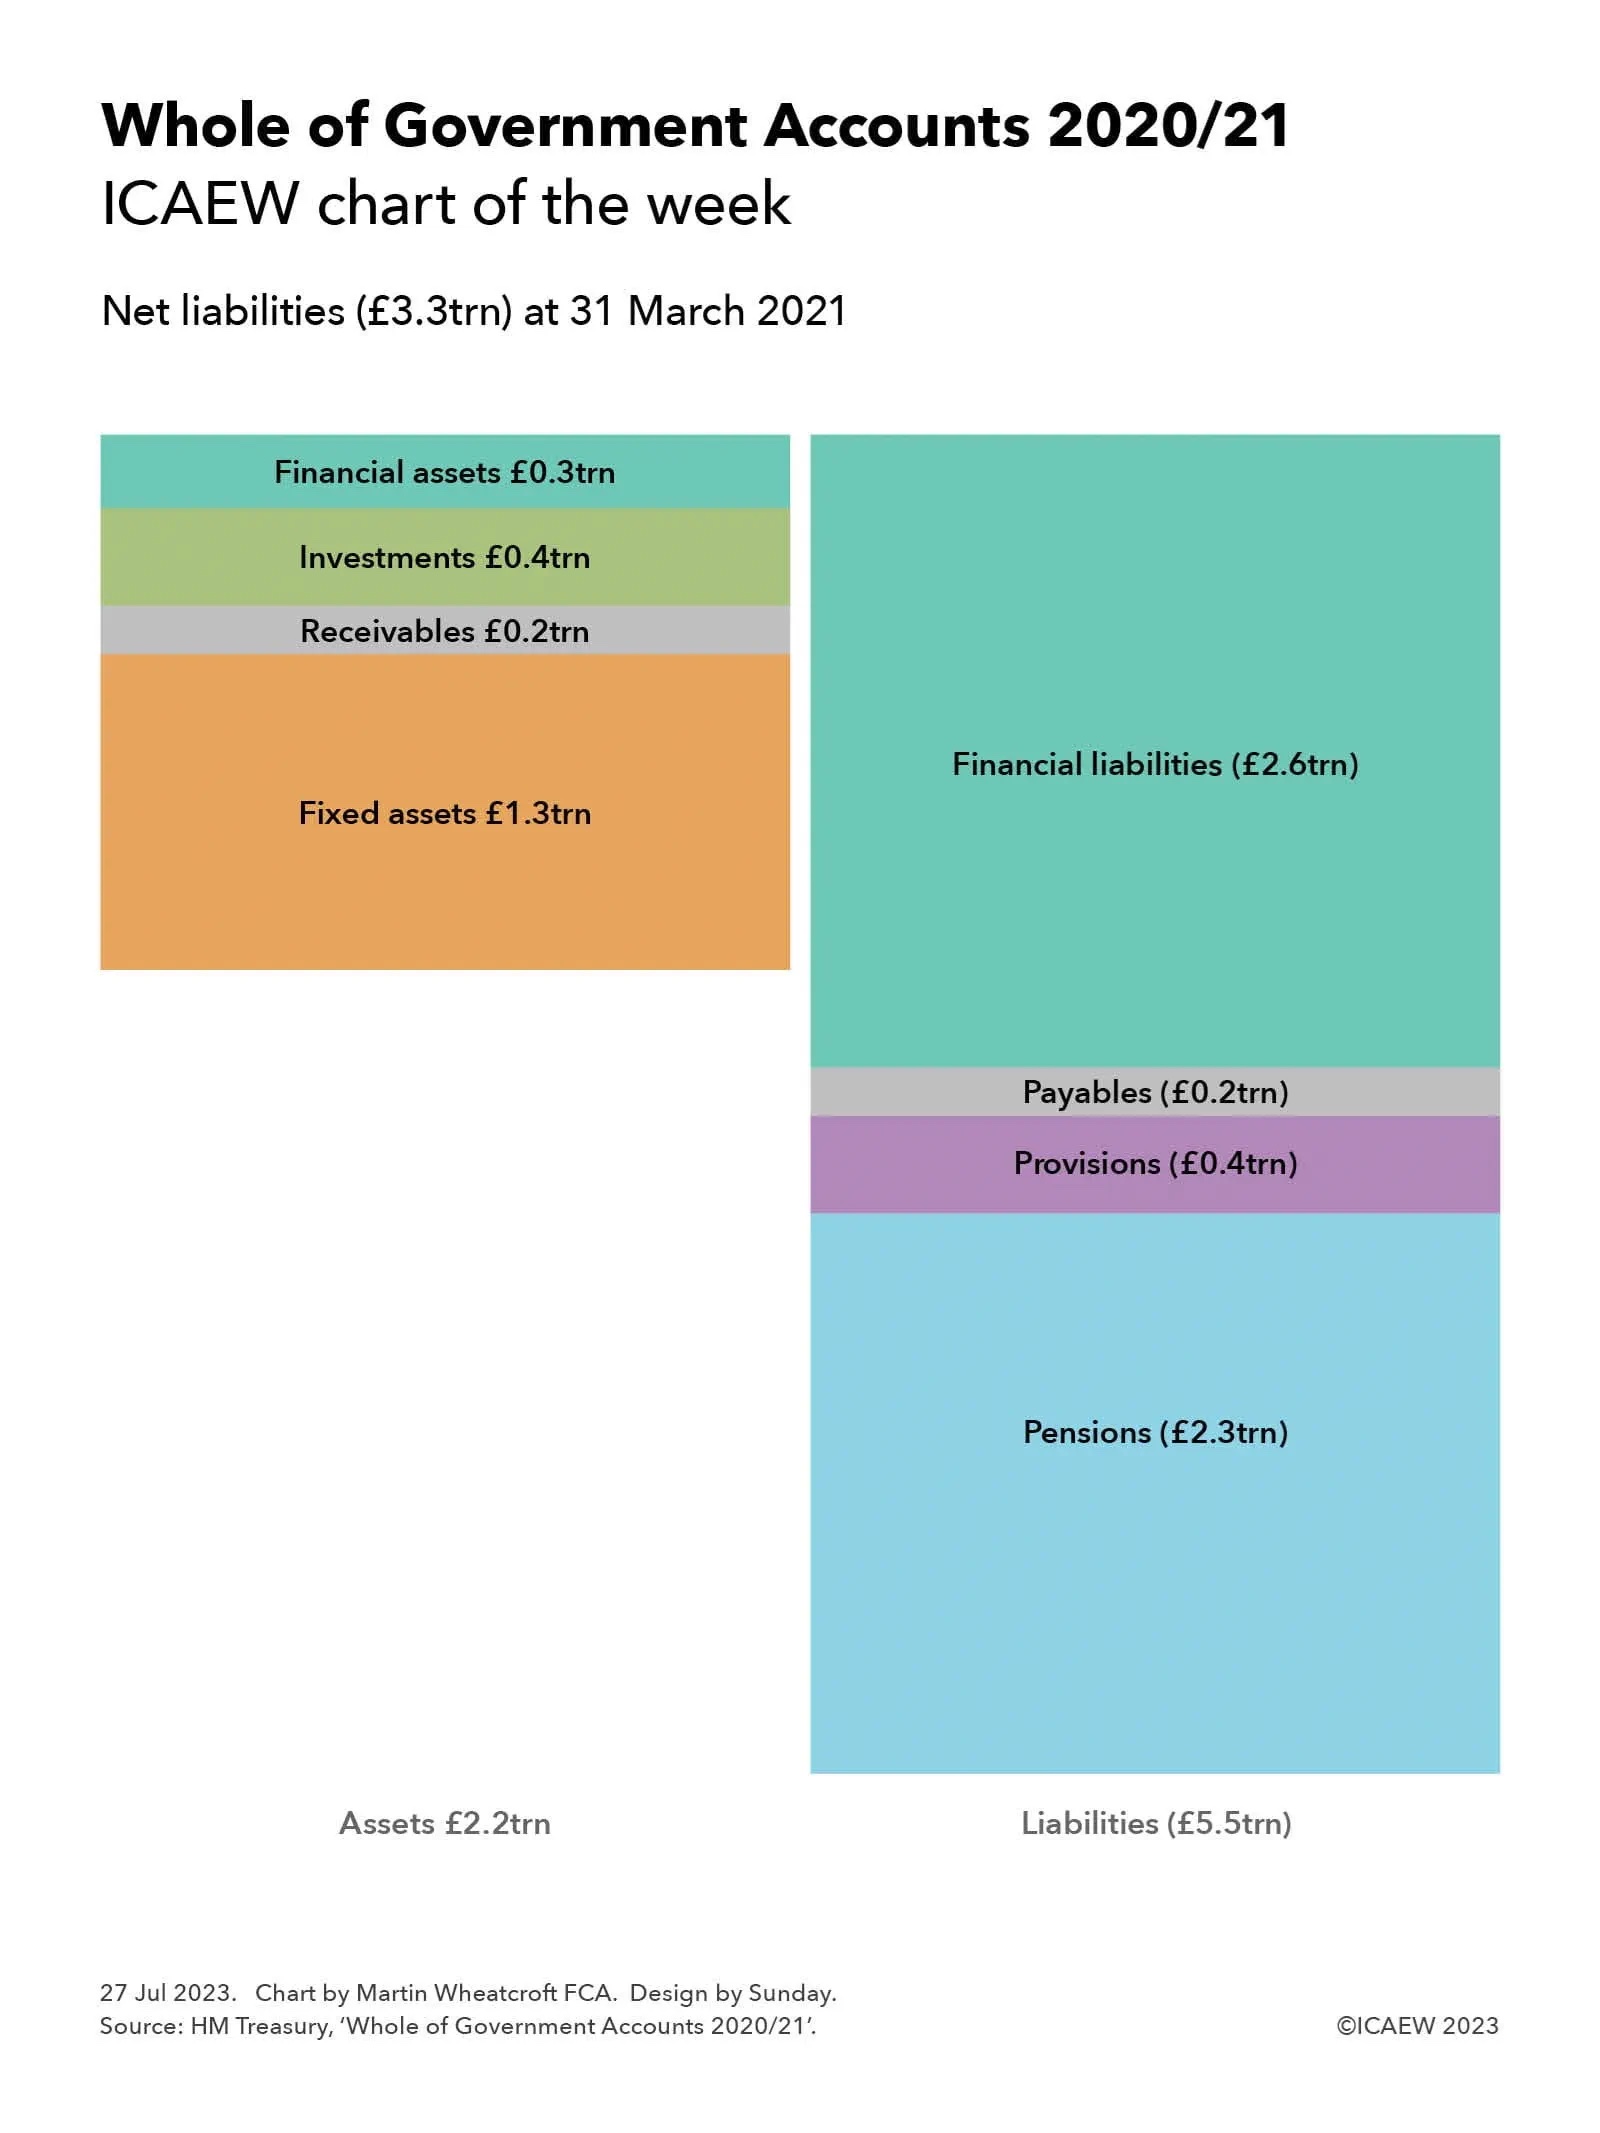
This new measure seeks to capture more assets and liabilities than the narrowly focused public sector net debt measure traditionally used to assess the financial position of the UK public sector. However, it excludes unfunded employee pension liabilities that amounted to more than £2trn at 31 March 2021 according to the Whole of Government Accounts, although they are expected to be much lower today as discount rates have risen significantly since then.
For further information, read the public sector finances release for July 2023.