First quarter fiscal deficit in line as Chancellor ponders tax rises

Despite borrowing to fund the deficit in the first three months of the financial year of £58bn being in line with expectations, it was still the third-highest first quarter result on record.

The monthly public sector finances release for June 2025 published by the Office for National Statistics (ONS) on 22 July reported a provisional deficit of £21bn for the month of June and £58bn for the three months then ended. This is £4bn more and in line with budget respectively, and £7bn and £8bn more in each case than the first fiscal quarter a year ago.

Alison Ring OBE FCA CPFA, ICAEW Director of Public Sector and Taxation, says: “Even if borrowing to fund the deficit in the month of June was only a little higher than expected and was in line with expectations in the first three months of the financial year, the first quarter was still the third highest since monthly records began. This trajectory will not have lightened the Chancellor’s mood as she decides which taxes to put up in the Autumn Budget later this year. 

“The government has two big problems with the public finances: the short-term outlook – which is bad – and their long-term prospects – which are worse. Public spending continues to outpace tax receipts by a significant margin, while the OBR has reiterated its conclusion that the public finances are unsustainable over the next 25 to 50 years if this and future governments continue on the current path. 

“Unfortunately, the major challenges facing the public finances over the next quarter of a century and beyond means that this will not be the last time a chancellor of the exchequer needs to come back asking for more. Now is the time to stop kicking the can down the road and develop a comprehensive long-term fiscal strategy to put the public finances onto a sustainable path.”

Month of June 2025

The fiscal deficit for June 2025 was £21bn, £4bn more than budgeted and £7bn more than a year previously. According to the ONS, this was the second-highest June deficit since monthly records began in 1993, with only June 2020 during the pandemic being higher.

First quarter to June 2025

The deficit for the first three months of the 2025/26 financial year was £58bn, £8bn more than a year previously. Despite being in line with budget, this is the third-highest first quarter deficit since monthly records began (after the first quarter deficits in 2020/21 and 2021/22). 

Table 1 highlights how total receipts and total current spending in the three months to June 2025 of £278bn and £323bn were up 7% and 8% respectively, compared with the same period last year.

Receipts were boosted by the employer national insurance increase from April 2025 onwards in addition to the effect of fiscal drag on income tax caused by the continued freeze in personal tax allowances. Meanwhile, the increase in current spending over the past year was primarily as a consequence of public sector pay rises, higher supplier costs and rises in welfare benefits.

The increase in debt interest of £5bn to £42bn consisted of a £6bn increase in indexation on inflation-linked debt as inflation returned less a £1bn reduction in interest on variable and fixed-interest debt. The latter was primarily the effect of a lower Bank of England base rate offsetting a higher level of debt compared with a year ago.

Net investment of £13bn in the first quarter of 2025/26 was £1bn or 8% higher than the same period last year. Capital expenditure of £22bn was up by £1bn and capital transfers (capital grants, research and development funding, and student loan write-offs) of £9bn were up by £1bn, less depreciation of £18bn up by £1bn.

Table 1: Summary receipts and spending

3 months to June2025/26
£bn
2024/25
£bn
Change
%
Income tax6460+7%
VAT5250+4%
National insurance4841+17%
Corporation tax2624+8%
Other taxes5756+2%
Other receipts3130+3%
Current receipts278261+7%
Public services(178)(165)+8%
Welfare(77)(72)+7%
Subsidies(8)(8)
Debt interest(42)(37)+14%
Depreciation(18)(17)+6%
Current spending(323)(299)+8%
Current deficit(45)(38)+18%
Net investment(13)(12)+8%
Deficit(58)(50)+16%

Borrowing and debt

Table 2 summarises how the government borrowed £64bn in the first quarter to take public sector net debt to £2,874bn on 30 June 2025. The movements comprised £58bn in public sector net borrowing (PSNB) to fund the deficit and £6bn to fund government lending activities and working capital movements.

The table also illustrates how the debt to GDP ratio increased from 95.2% of GDP at the start of the financial year to 96.3% on 30 June 2025, with the incremental borrowing partly offset by the ‘inflating away’ effect of inflation and economic growth adding to GDP, the denominator in the net debt to GDP ratio.

Table 2: Public sector net debt and net debt/GDP

3 months to June2025/26
£bn
2024/25
£bn
PSNB5850
Other borrowing6(3)
Net change6447
Opening net debt2,8102,686
Closing net debt2,8742,733
PSNB/GDP2.0%1.8%
Other/GDP0.2%(0.1%)
Inflating away(1.1%)(1.5%)
Net change1.1%0.2%
Opening net debt/GDP95.2%95.6%
Closing net debt/GDP96.3%95.8%

Public sector net debt on 30 June 2025 of £2,874bn comprised gross debt of £3,286bn less cash and other liquid financial assets of £412bn. 

Public sector net financial liabilities were £2,504bn, comprising net debt of £2,874bn plus other financial liabilities of £706bn less illiquid financial assets of £1,076bn. Public sector negative net worth was £878bn, being net financial liabilities of £2,504bn less non-financial assets of £1,626bn.

Revisions

Caution is needed with respect to the numbers published by the ONS, which are repeatedly revised as estimates are refined and gaps in the underlying data are filled. This includes local government where the numbers are only updated in arrears and are based on budget or high-level estimates in the absence of monthly data collection.

The latest release saw the ONS revise the previously reported deficit for the two months to May 2025 down by £1bn and revise public sector net debt on 31 May 2025 up by £7bn.

For further information, read the public sector finances release for June 2025.

This article was originally published by ICAEW.

ICAEW chart of the week: climate change and the public finances

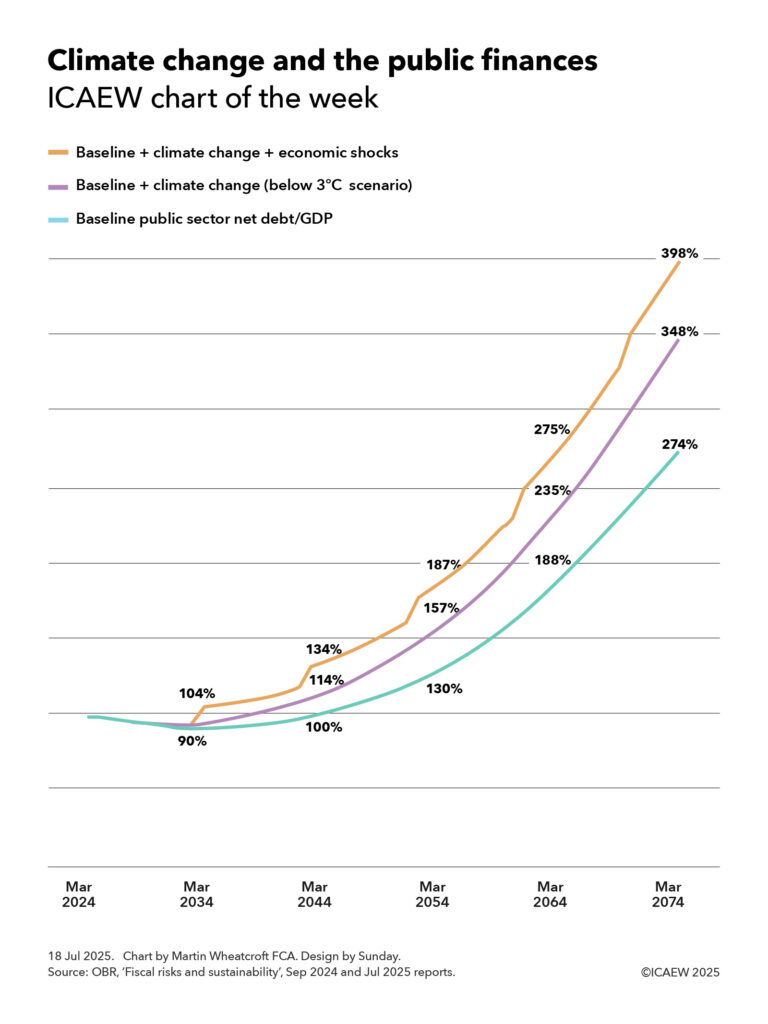
My chart for ICAEW this week looks at how climate change is now expected to make the OBR’s dire predictions for the public finances even worse.

A line chart on climate change and the public finances, with three curved lines for public sector net as a share of GDP over fifty years. with labels from March 2034 onwards. 

Bottom line: Baseline public sector net debt/GDP. Falls from just under 100% of GDP to 90% of GDP in March 2034 and then rises to 100%, 130%, 188% and 274% of GDP in March 2044, 2054, 2064 and 2074 respectively. 

Middle line: Baseline + climate change (below 3°C scenario). Rises from 94% of GDP in March 2034 (label not shown) to 114%, 157%, 235% and 348% of GDP in March 2044, 2054, 2064 and 2074 respectively. 

Top line: Baseline + climate change + economic shocks. Rises from 104% in March 2034 to 134%, 187%, 275% and then 398% in March 2074. 

18 Jul 2025. Chart by Martin Wheatcroft FCA. Design by Sunday. Sources: OBR, 'Fiscal risks and sustainability', Sep 2024 and Jul 2025 reports.

ICAEW’s chart of the week is on climate change this week, illustrating how it could add a further 74 percentage points to the Office for Budget Responsibility (OBR)’s already disheartening baseline projection for public sector net debt of 274% of GDP to reach 348% of GDP, or potentially 398% if economic shocks are included.

The baseline projection, published by the OBR in September 2024, showed public sector net debt as a proportion of the size of the economy falling from just under 100% of GDP to 90% of GDP in March 2034 and then rising to 100%, 130%, 188% and 274% of GDP in March 2044, 2054, 2064 and 2074 respectively. 

One of the main drivers of the baseline projection is the expected rise in spending on pensions, health and social care as more people live longer, sometimes less healthy lives, combined with a falling fertility rate that means there will be proportionately fewer working age adults to pay the taxes needed to fund that rise.

Incorporating the OBR’s new central projection for climate change, public sector net debt would be 94% of GDP in March 2034 (not shown in the chart because of a lack of space between lines) and then 114%, 157%, 235% and 348% of GDP in March 2044, 2054, 2064 and 2074 respectively. Adding potential economic shocks on top would increase the projection for public sector net debt/GDP to 104% in March 2034 rising to 134%, 187%, 275% and then 398% in March 2074.

The September 2024 baseline projection included the loss of fuel duty receipts from the phasing out of petrol and diesel vehicles between now and 2050, but the OBR in its recent July 2025 fiscal and sustainability report has looked in more detail at both the incremental costs of transitioning to net zero and the damage that is likely to result from a much warmer and wetter climate in several different scenarios.

OBR’s central ‘below 3°C’ scenario is based on global average temperatures rising by 2.9°C above pre-industrial levels by 2100, of which weather and other damage associated with a much warmer and wetter climate is projected to add 17 percentage points to accumulated debt over the next half century from direct and indirect costs and revenue losses. Climate damage is also expected to result in slower economic growth that would add 27 percentage points over 50 years by reducing the denominator in the debt to GDP ratio. The government’s share of transition costs (including lower tax receipts from higher private sector spending) is projected to add 7 percentage points, while there is a 22 percentage point impact from the incremental debt interest that would be incurred on a higher level of debt.

This is before taking account of recessions and other potential economic shocks, which based on historical patterns are expected to add 10% of GDP to public sector net debt every decade or so.

The chart does not reflect other risks identified by the OBR in its latest report, where it reports that the exposures to the public finances have increased since its assessment last year. One risk they did look at in some detail is the prospect of higher interest rates on government borrowing on the basis that demand for gilts reduces as the Bank of England winds down its holdings of gilts (quantitative tightening) and defined benefit pension schemes gradually sell their holdings of gilts to fund pension payments. This risk might be mitigated by selling shorter-dated gilts, although shorter maturities would make the public finances less resilient by increasing the amount of debt needing to be refinanced each year.

The OBR’s dismal assessment of the prospects for the public finances highlights just how difficult a financial position the UK finds itself in, with a lot to do (and some luck needed) if it is to be restored to a sustainable path. At the same time, the costs of climate change are now becoming that much more apparent as extreme weather events and other climate-related costs start to show up in public finance and insurance data.

For more information about the role of the accountancy profession in climate change, visit ICAEW’s climate hub.

This chart was originally published by ICAEW.

ICAEW chart of the week: Spending up

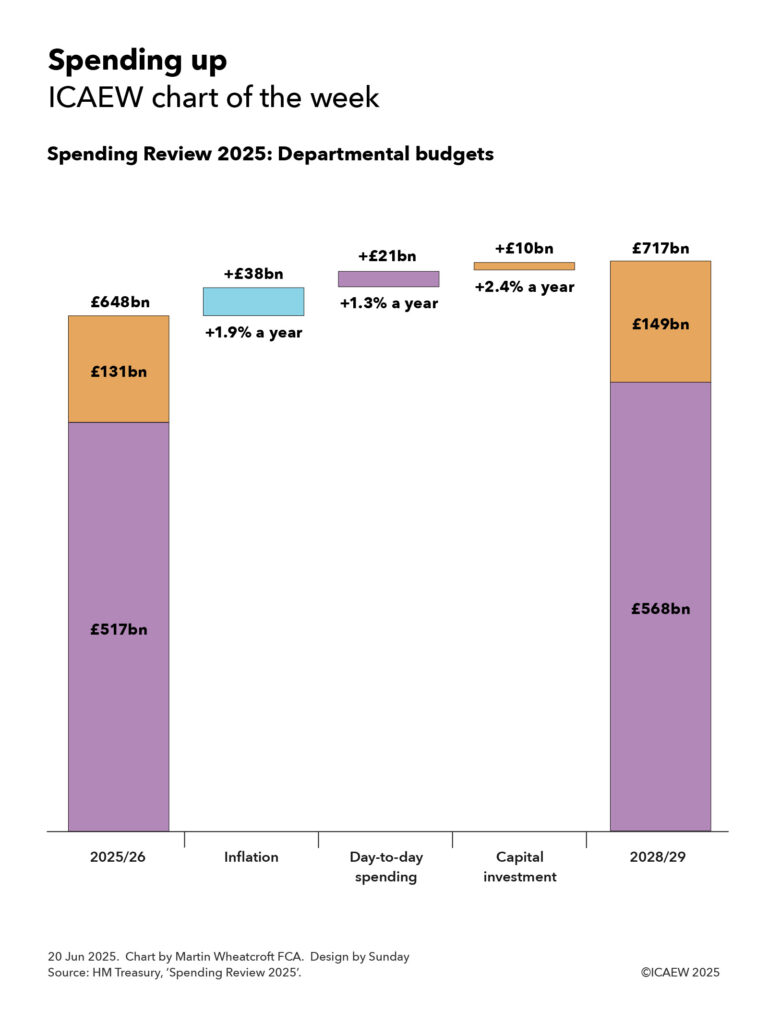
My chart for ICAEW this week looks at what the Spending Review 2025 does to total day-to-day spending and capital budgets over the next three years.

A step chart showing the Spending Review 2025 change in total departmental budgets over three years. 

2025/26: Day-to-day spending £517bn + Capital investment £131bn = total £648bn. 

Inflation: +£38bn (+1.9% a year). 

Day-to-day spending: +£21bn (+1.3% a year). 

Capital investment: +£10bn (+2.4% a year). 

2028/29: Day-to-day spending £568bn + Capital investment £149bn = total £717bn. 

20 Jun 2025. Chart by Martin Wheatcroft. Design by Sunday. 
Source: HM Treasury. 'Spending Review 2025'.

Last week’s chart of the week looked at the winners and losers between departments in the Spending Review 2025. This week’s chart looks at the overall picture and the government’s different approaches between operating and capital expenditure.

As my chart this week illustrates, total departmental budgets for the current financial year ending on 31 March 2026 (2025/26) of £648bn are expected to rise to £717bn by 2028/29. This comprises departmental ‘day-to-day’ operating budgets of £517bn in 2025/26 that rise to £568bn in 2028/29 and departmental capital budgets going from £131bn to £149bn over the same period.

Inflation of 1.9% a year on average is expected to add £38bn a year to total departmental spending by the end of the three-year period, with a real-term increase in operating budgets of £21bn by 2028/29 or 1.3% a year on average, and a real-term increase in capital budgets of £10bn or 2.4% a year on average. 

In practice, the increase in day-to-day spending is not much of an increase at all given that ‘government inflation’ is often higher than the GDP inflator all-economy measure of inflation used in HM Treasury’s calculations. Pay awards and supplier price rises are likely to absorb a significant proportion of this additional money, with departments needing to find significant efficiency savings and productivity improvements if they are to avoid cuts to public services, let alone improve them. And, as our chart last week highlighted, several departments are in effect having their operating budgets cut over the spending review period. 

Unlike operating budgets, where total planned departmental spending increases each year broadly in line with inflation and the 1.3% average real-term increase, the average annual real-term increase of 2.4% a year in capital budgets over three years comprises a 6.9% real-term increase in 2026/27, a real-term cut of 0.2% in 2027/28, and a real-term increase of 0.7% in 2028/29. (There is also no increase after inflation in the fourth year to 2029/30, which would reduce the average annual increase over four years to 1.8%.)

This follows an 11.6% real-term increase in capital budgets in 2025/26 that was enabled by the Chancellor’s change to the fiscal rules in the Autumn Budget 2024. This gave the government more flexibility to borrow for capital investment, and the Chancellor chose to front load that investment, no doubt in the hope of accelerating the economic benefits of that investment and of improving public services more quickly than might be possible if spreading the increase more evenly over the spending review period.

Whether the government will be able to actually deliver its planned capital programmes as quickly as it might hope remains to be seen, as will whether that investment in turn actually results in stronger economic growth and better public services. Let’s hope it does, as we could definitely do with a boost.

This chart was originally published by ICAEW.

ICAEW chart of the week: Spending Review 2025

My chart for ICAEW this week looks at the government’s priorities as expressed through departmental budgetary allocations over the next three years.

A bar chart showing the average annual real-term percentage increase in departmental spending over the three years to 2028/29.

Defence +3.8%. 
Security +3.7%. 
Business & Trade +3.0%. 
Health +2.7%. 
Local Government. +2.6% (central funding +1.1%, balance from local taxation). 
Justice +2.0%. 
Overall average increase +1.5%. 
Science +0.9%. 
Education +0.8%. 
Devolved administrations +0.7%. 
Energy & New Zero +0.7%. 
Home Office +0.5%. 
Cabinet Office +0.4%. 
DWP -0.2%. 
Transport -0.5%. 
Culture, Media & Sport -1.4%. 
HMRC -1.5%. 
Hm Treasury -1.9%. 
Agriculture & Rural Affairs -2.3%. 
Foreign & Development -8.3%. 
Asylum -13.1%. 

13 Jun 2025. Chart by Martin Wheatcroft. Design by Sunday. Source: HM Treasury, 'Spending Review 2025'.

The Spending Review 2025 establishes base operating budgets for government departments for the three financial years from 1 April 2026 (2026/27, 2027/28 and 2028/29) and base capital budgets for four financial years (extending to 2029/30).

Departmental budgets for the current financial year ending on 31 March 2026 (2025/26), total £648bn and are expected to rise to £678bn in 2026/27, £697bn in 2027/28, and £717bn in 2028/29, an increase of 10.6% over the three years or 3.4% a year. This is equivalent to an average increase of 1.5% a year in real terms after adjusting for inflation of 1.9% a year on average over the spending review period.

The totals can be analysed between operating or ‘day-to-day’ budgets of £517bn, £536bn, £552bn and £568bn in 2025/26, 2026/27, 2027/28 and 2028/29 respectively and capital budgets of £131bn, £143bn, £145bn and £149bn. These are real terms increases of 1.2% and 2.4% a year on average over three years. 

The capital budget in 2029/30 is £152bn, a cut in real terms that reduces the average annual increase in capital budgets over four years to 1.8% a year on average.

My chart this week highlights how the 1.5% average annual real increase over three years in total budgets (operating and capital) has been allocated across departments, starting with the Ministry of Defence, which leads the pack with an average increase in its budget of 3.8% a year, followed closely by the security services, with an average annual increase of 3.7%. This reflects the elevation of national defence and security to the top of the government’s priorities since the general election last year, even though this increase will only move defence and security spending from 2.3% of GDP currently to 2.6% of GDP by 2027, a long way off the proposed 3.5% of GDP new minimum to be discussed at the NATO summit.

Economic growth and the NHS are the next highest priorities for the government and so it is perhaps unsurprising that the Department of Business & Trade does well with an annual average increase of 3.0%, closely followed by the Department of Health & Social Care, which receives 2.7%. The latter is the biggest increase in cash terms, at £31bn in total or about £12bn more in 2028/29 after adjusting for inflation.

Local government finances are in a parlous state and so the government has pencilled in a 2.6% average annual increase in core budgets for local authorities in England over the next three years. However, it is only increasing central funding by 1.1% a year on average, implying the balance will need to be made by local taxation, principally council tax.

The Ministry of Justice has been awarded 2.0% a year on average as the government seeks to tackle significant backlogs in the courts, overcrowded prisons and significantly under-resourced probation services.

The Department of Science, Innovation and Technology has received a below average annual increase of 0.9% over the next three years, but this follows an almost 12% increase over the past two years as the government has sought to increase investment in research and development to boost economic growth.

Despite being a key priority for the government, the Department for Education has only received a 0.8% average annual increase, partly because of falling primary school rolls in line with a significant fall in the birth rate over the last decade.

The devolved administrations – Scotland (0.8%), Wales (0.7%) and Northern Ireland (0.5%) – are budgeted to receive an average of 0.7% a year over three years as a consequence of the Barnett formula that links UK national government spending in England to the block grants provided to each devolved administration, adjusted for relative changes in population among other factors.

The Cabinet Office is expected to receive just 0.4% on average reflecting the contribution that planned efficiency savings are expected to contribute to administrative budgets. This is also the reason for the 0.2% a year real-terms fall in the Department for Work and Pensions (DWP) budget as automation helps reduce the cost of administering the welfare system.

The budget of the Department for Transport is expected to fall by 0.5% a year overall, but this partly reflects a fall in spending on High Speed 2 as it comes closer to completion. If that is excluded, the department’s budget is expected to increase by 0.5% a year on average. The actual increase in spending should be even higher, as the budget is net of passenger revenues that are expected to grow at a faster rate over the next three years.

Extra money for housing was found within the spending review, but this wasn’t enough to stop the budget for the Department of Housing, Communities and Local Government from shrinking by an annual average of 0.6% a year as other activities are cut back, while the Department for Culture, Media & Sport (-1.4% a year on average) has also been asked to cut back its activities.

HMRC (-1.5% a year) and HM Treasury (-1.9% a year) see their budgets reduced significantly, with digitisation and efficiency savings expected to contribute significant sums.

The Department for Farming, Agriculture, and Rural Affairs (-2.3%) is also expected to see significant cuts over the next three years, as is the Foreign, Commonwealth and Development Office (-8.3%), although in the latter case that is principally driven by the decision to reduce overseas development assistance from 0.5% of GDP to 0.3% of GDP although some will come from back office savings.

Not shown in the chart are small and independent bodies and the government legal function, which are together expected to increase by 0.4% a year on average, although this comprise a -0.5% annual reduction in the former and a 5.3% average annual increase in the latter. The net changes after inflation are a fall of less than £0.1bn and an increase of just over £0.1bn respectively, which are rounding errors in the hundreds and hundreds of billions of pounds spent by government departments each year. 

ICAEW chart of the week: Pre-Spring Forecast forecast

Our chart looks ahead to next week’s Spring Statement by looking back at the fiscal forecast prepared by the OBR last October.

A seven-column chart showing the OBR forecast for the deficit from October 2024, prior to its March 2025 to accompany the Spring Statement. 

2023/24 Outturn: Current budget deficit (£61bn) + net investment (£70bn) = Fiscal deficit (£131bn). 

2024/25 Forecast: (£55bn) + (£72bn) = (£127bn). 

2025/26 Forecast: (£26bn) + (£80bn) = (£106bn). 

2026/27 Forecast: (£5bn) + (£83bn) = (£88bn). 

2078/28: £11bn current budget surplus + (£83bn) net investment = (£72bn). 

2028/29: £9bn + (£81bn) = (£72bn).  

2029/30: £10bn + (£81bn) = (£71bn). 

21 Mar 2025. Chart by Martin Wheatcroft FCA. Design by Sunday. Sources: ONS, 'Public sector finances, Jan 2025'; OBR, 'Economic and fiscal outlook, Oct 2024'.

There has been some confusion on both the title of next week’s Spring Forecast and whether it will or will not constitute a formal ‘fiscal event’. 

Traditionally, each Chancellor of the Exchequer stands up in Parliament twice a year to announce policy decisions on tax, spending and borrowing, and to set out the latest economic and fiscal forecasts, which since 2010 have been prepared by the independent Office for Budget Responsibility (OBR). One of these fiscal events is a ‘Budget’, which involves requesting parliamentary approval of the annual budget for the upcoming financial year, while the alternate has historically been described as a ‘Statement’.

Chancellor Rachel Reeves set out an ambition on taking office for there to be only one fiscal event a year – an Autumn Budget – mostly in the hope of creating a more stable tax system by reducing the frequency of tax changes, but also to provide a more stable budgeting framework for the public sector. However, she is still legally required to present fiscal forecasts to Parliament twice a year, and so HM Treasury’s decision to relabel the second event as a Spring Forecast was originally intended to emphasise that there wouldn’t be any major tax or spending changes between Budgets.

Unfortunately for the Chancellor, weak economic data – and what that implies for the profile of public spending of tax receipts and public spending over the next five years – mean that she has been unable to achieve her hope of a policy-decision-free Spring Forecast on this, her first attempt. 

Instead, the government has brought forward from later in the year its anticipated reform of disability benefits to ensure the associated cost savings are reflected in the new OBR forecast, while there are also rumours that she may, for the same reason, revise down the total amount of public spending allocated to this summer’s three-year Spending Review.

The tight fiscal situation is illustrated by our chart this week, which sets out how the current budget balance was expected to turn from deficits of £61bn, £55bn, £26bn and £5bn between 2023/24 and 2026/27 to surpluses of £11bn, £9bn and £10bn between 2027/28 and 2029/30.

Our chart also shows how public sector net investment of £70bn, £72bn, £80bn, £83bn, £83bn, £81bn and £81bn between 2023/24 and 2029/30 added to the current budget balance was expected to result in fiscal deficits of £131bn, £127bn, £106bn, £88bn, £72bn, £72bn and £71bn between 2023/24 and 2029/30 respectively.

The Chancellor’s primary fiscal rule is to achieve a current budget surplus by 2029/30, but the £10bn headroom against this target represents just 0.9% of projected receipts of £1,440bn and 0.7% of projected total managed expenditure of £1,510bn in 2029/30. 
A deteriorating economic outlook is believed to have seen this headroom evaporate in the working projections presented by the OBR to the Chancellor as part of the Spring Forecast process – at least before taking account of any offsetting decisions by the Chancellor.

Similarly, the Chancellor may also need to take action to ensure that her secondary fiscal rule – for the debt-to-GDP ratio to fall between March 2029 and March 2030 – is met. This test (not shown in the chart) also had a relatively low headroom of £16bn in the Autumn Budget forecast and further changes to government plans may also be required to stay within it.

Many of the references in the media and elsewhere to the Spring Statement next week are likely to be from people who didn’t see the announcement from HM Treasury about the name change. We did get the memo, but on reflection we think sticking with the former title is going to be more appropriate on this occasion.

This chart was originally published by ICAEW.

ICAEW chart of the week: the end of year capital rush

My chart of the week for ICAEW highlights the big rush in UK public sector capital expenditure in the final quarter of each financial year, prompting us to ask why March is the best time of the year to build new assets.

Column chart illustrating UK public sector capital expenditure by quarter, comprising three financial years each made up of four quarters: Q1 (Apr-Jun), Q2 (Jul-Sep), Q3 (Oct-Dec), and Q4 (Jan-Mar). 

2022/23 £85.3bn: £14.4bn, £18.4bn, £20.2bn, and £32.3bn. 
2023/24 £102.7bn: £18.6bn, £22.8bn, £24.2bn and £37.1bn. 
2024/25 £109.0bn (forecast): £20.4bn, £23.8bn, £25.8bn and £39.0bn (forecast). 
 

7 Feb 2025. Chart by Martin Wheatcroft FCA. 
Sources: ONS, 'Public sector finances, Dec 2024’; OBR, ‘Economic and fiscal outlook, Oct 2024’.

Over the years, the process for delivering capital expenditure in the public sector in the UK has had a pretty bad reputation. The anecdote goes that the first quarter is spent arguing about budgets, in the second everyone goes on holiday, and it is only in the third quarter that programmes finally get up and running, before everything stops for the Christmas break. The final quarter is then a mad rush to spend the remaining budget before the end of the financial year.

Unfortunately, there does appear to be some support for this conjecture when we take a look at the actual numbers.

According to the public sector finance release for December 2024, together with the latest Office for Budget Responsibility forecast for the current financial year to March 2025, public sector gross capital formation (in effect capital expenditure) is lowest in the first quarter, picks up in the second (despite the summer holidays), rises slightly again in the fourth (despite the Christmas break) and then explodes in the fourth quarter of each financial year (despite winter).

Our chart shows capital expenditure in 2022/23 of £85.3bn comprised £14.4bn in Q1 (Apr-Jun), £18.4bn in Q2 (Jul-Sep), £20.2bn in Q3 (Oct-Dec) and £32.3bn in Q4 (Jan-Mar). A similar pattern occurs in 2023/24 when a total £102.7bn of capex was incurred, with £18.6bn in Q1, £22.8bn in Q2, £24.2bn in Q3, and £37.1bn in Q4. Meanwhile in the current 2024/25 financial year, £20.4bn was incurred in Q1, £23.8bn in Q2, and £25.8bn in Q3, with a forecast of £39.0bn in Q4 to reach a forecast total of £109.0bn.

In practice the fourth quarter jump is principally seen in the final month of the financial year, as seen in 2023/24 when fourth quarter capital expenditure of £37.1bn consisted of £9.6bn in January 2024 (£1.0bn more than the monthly average capital expenditure of £8.6bn that financial year), £10.2bn in February 2024 (£1.6bn more than the monthly average), and £17.3bn in March 2024 (£8.7bn more than the monthly average).

This pattern is a stubbornly consistent feature of the public finances in the UK, even after numerous attempts within government to improve capital budgeting and delivery processes. For example, departments are able to carry over some of their capital budgets to future years, which in theory should reduce the incentive to spend every last penny of their allocation in-year. The new spending review process coming into force this summer should also help by setting out a four-year capital budget for 2026/27 to 2029/30, providing much greater forward certainty for investment programmes and (in theory) reducing the concern of future budgets disappearing if the current year budget is not spent in full.

Of course, it is possible that our concerns about the quality of government’s investment delivery process are not fully justified. There could after all be some very good practical reasons as to why March is the best time of the year for carrying out public capital works!

This chart was originally published by ICAEW.

ICAEW chart of the week: Public finances per capita

My chart for ICAEW this week divides some very big numbers for the public finances by an estimated 69.2m people living in the UK to highlight how UK public spending is now in excess of £1,500 per person per month.

Column chart showing UK public sector receipts and spending per capita for 2024/25. 

Left hand column: Taxes £1,235 per month + Other receipts £150 per month = Receipts per capita £1,385 per month. 

Right-hand column: Pensions and welfare £445 per month + Health and social care £370 per month + Education £160 per month + Other public services £410 per month + Interest £150 per month = Spending per capita £1,535 per month.

According to the Autumn Budget 2024, the UK public sector expects to bring in £1,149bn and spend £1,276bn in the financial year ended 31 March 2025 (2024/25). At more than a trillion pounds a year in each case, these are very big numbers that can be difficult to comprehend.

My chart of the week attempts to make these numbers more understandable by averaging them over an estimated UK population of 69.2m for the current financial year and dividing them by 12 to arrive at per person per month equivalents (rounded to the nearest £5).

On this basis, total receipts are expected to average £1,385 per month for each person living in the UK in 2024/25, comprising £1,235 a month from tax receipts (£1,025bn in total) and £150 a month in other receipts (£124bn). 

Not shown in the chart is the approximately £940 per person per month on average – just over two-thirds of total receipts – that comes from the top five taxes: income tax £375 per month, VAT £245 per month, employer national insurance £135 per month, corporation tax £120 per month, and employee national insurance £65 per month.

Public spending is expected to average £1,535 per person per month in 2024/25, comprising approximately £445 per month on pensions and welfare, £370 per month on health and social care, £160 per month on education, £410 per month on other public services, and £150 per month on debt interest, based on forecast total spending in 2024/25 of £370bn, £307bn, £134bn, £340bn, and £125bn respectively.

Spending on welfare

Welfare spending includes (but is not limited to) approximately £170 per person per month to cover the cost of paying the state pension, around £105 per month to pay for universal credit (including housing benefit), and in the order of £75 per month to fund disability and illness benefits.

Per capita spending on health and social care comprises close to £290 per person per month on the NHS, £55 on social care and £25 on public health, health research and other health-related spending. 

Education costs each of us an average of £160 per month, of which approximately £115 per month pays for schools, £35 funds university and higher education (including just over £10 for student loans that are not expected to be repaid) and around £10 per month goes on further education, training and other.

The £410 per month cost of other public services includes in the region of £85 per month on defence and security, approximately £75 per month on roads and railways, £65 on industry and agriculture, nearly £60 per month on public order and safety, £15 per month on dealing with waste, and around £10 per month on international development and aid. This leaves approximately £100 per month to pay for all the other services that central and local government provide, including 11p per person per month for the Royal Family and palaces.

These numbers are averages and of course the amounts individuals pay in taxes and receive either in pensions and welfare benefits or in public services will vary significantly. For example, while health and social care spend is £370 per month when spread over the whole population, average spending on teenagers and those in their 70s are estimated to be significantly different from each other at £130 per month and £700 per month respectively.

Forecast per capita taxes and other receipts of £1,385 per month fall short of planned public spending of £1,535 per month to give rise to an expected deficit of approximately £150 per month funded by borrowing, being £127bn in total in 2024/25, divided by the estimated population of 69.2m. As a consequence, public debt now exceeds £2.8tn, equivalent to just under £41,000 for each person living in the UK, or somewhere in the region of £98,000 per household.

Navigating the public finances can be difficult at the best of times, but it is often helpful to translate the huge numbers you hear on the news into per capita equivalents to make sense of them. £1bn when spread across the UK population works at being equivalent to just over £1.20 per month.

This chart was originally published by ICAEW.

ICAEW chart of the week: Commonwealth of Australia balance sheet

My chart for ICAEW this week heads down under for some warmer weather and to take a look at the Australian federal government balance sheet in its recently published consolidated financial statements for the year ended 30 June 2024.

Column chart illustrating the Commonwealth of Australia balance sheet. Assets of A$989bn in the left hand column and liabilities of (A$1,557bn) in the right hand column. 

19 Dec 2024. Chart by Martin Wheatcroft FCA. Design by Sunday. Source: Commonwealth of Australia, 'Consolidated financial statements 2023/24'.

The Commonwealth of Australia consolidated financial statements for the year ended 30 June 2024 were published on 12 December, bringing together the results and financial position of 199 audited financial statements for entities within the federal government system, public financial corporations (such as the Reserve Bank of Australia and Export Finance Australia), and public non-financial corporations (including Australia Post and Snowy Hydro for example). However, this does not include state and territory governments or local authorities in each state and territory. 

As my chart this week illustrates, the balance sheet reports negative net worth of $568bn (21% of GDP or £284bn at the current exchange rate of approximately A$1 = £0.50), comprising assets of A$989bn (37% of GDP or £495bn) less liabilities of A$1,557bn (58% of GDP or £779bn). 

Assets consisted of investments and cash of A$527bn (£264bn), receivables and other financial assets of A$162bn (£81bn) and non-financial assets of A$300bn (£150bn), while liabilities comprised debt of A$1,044bn (£522bn), payables and provisions of A$205bn (£103bn), and superannuation liabilities of A$308bn (£154bn).

Investments and cash of A$527bn consisted of investments, loans and placements of A$417bn, equity investments of A$102bn, and cash of A$8bn. Investments include $225bn invested in the Australia Future Fund, a sovereign wealth fund established in 2006 to strengthen the Australian government’s long-term financial position, together with $A$44bn in a series of other sovereign wealth funds established over the last decade.

Receivables and other financial assets of A$162bn comprised tax receivables and accrued taxation of A$59bn, other receivables and accrued revenue of A$26bn, student loans of A$54bn, and other advances of A$23bn. 

Non-financial assets of A$300bn comprised A$89bn of military equipment, A$88bn of other plant, equipment and infrastructure, A$74bn in land and buildings, A$17bn in intangibles, $A13bn in heritage and cultural assets, and A$19bn of inventories and other non-financial assets.

Debt of A$1,044bn consisted of interest-bearing liabilities of A$943bn (A$611bn in government securities, A$227bn in central bank deposit liabilities, A$32bn for leases, and A$73bn in loans and other interest-bearing liabilities) and A$101bn in Australian currency in circulation.

Payables and provisions of A$205bn included A$90bn in provisions, A$63bn in non-pension employee liabilities, A$26bn in supplier payables and A$26bn in other payables.

The net pension obligation of A$308bn includes A$276bn for partially funded defined benefit schemes (obligations of $323bn less scheme assets of $A47bn) and A$32bn for one unfunded scheme. These schemes are now all closed to new members and so the liability is gradually reducing over time.

Not shown in the chart is the operating statement, which reported revenue of A$728bn (27.2% of GDP or £364bn), expenses of A$718bn (26.9% of GDP or £359bn) and net capital investment of A$12bn (0.5% of GDP or £6bn) to result in an operating surplus of A$10bn (0.4% of GDP or £5bn) and a fiscal deficit (on an accounting basis) of A$2bn (0.1% of GDP or £1bn).

Although the reported net worth in the financial statements is negative, Australia’s public finances are in a much stronger position than for many other countries. Australia’s general government net debt (including 13% for state and territory governments) was 32% of GDP on 30 June 2024, in contrast with the equivalent of 91% of GDP for the UK on the same date. This also doesn’t take account of the UK’s much larger public sector pension liabilities that are not included within net debt.

As a result there are more reasons than just the warmer weather to be thinking about enjoying a Christmas barbie on the beach on the other side of the world at this time of the year.

This is the last chart of the week for 2024 and so we would like to wish our readers all the best for the holiday season and for a healthy and prosperous 2025. We return in January.

This chart was originally published by ICAEW.

ICAEW chart of the week: Autumn Budget 2024

My chart for ICAEW this week looks at how the fiscal baseline inherited by the Chancellor has changed as a consequence of the Autumn Budget, with higher capital investment driving up borrowing needed to fund the deficit over the next five years.

Column chart showing Spring Budget fiscal deficit and the Autumn Budget change over the forecast period. 

2024/25: Spring Budget forecast £87bn + Autumn Budget change £40bn = £127bn (4.5% of GDP). 

2025/26: £78bn + £28bn = £106bn (3.6% of GDP). 

2026/27: £69bn + £20bn = £89bn (2.9% of GDP). 

2027/28: £51bn + £21bn = £72bn (2.3% of GDP). 

2028/29: £39bn + £33bn = £72bn (2.2% of GDP). 

2029/30: £35bn + £36bn = £71bn (2.1% of GDP).

Our chart of the week sets out the changes in fiscal projections calculated by the Office for Budget Responsibility (OBR) in its October 2024 economic and fiscal outlook compared with the numbers at the time of the Spring Budget seven months ago. 

These form a revised baseline for the public finances that will form the basis of the Chancellor’s spending and investment plans over the rest of the Parliament.

As our chart highlights, the fiscal deficit – the shortfall between tax and other receipts and public spending calculated in accordance with statistical standards – was forecast to amount to £87bn in 2024/25, but this has increased by £40bn to £127bn, or 4.5% of GDP. 

The projections for the following five years were also revised upwards between 2025/26 and 2029/30 have increased from £78bn, £69bn, £51bn, £39bn and £35bn by £28bn, £20bn, £21bn, £33bn and £36bn to result in a revised profile of £106bn (3.6% of GDP), £89bn (2.9% of GDP), £72bn (2.3% of GDP), £72bn (2.2% of GDP) and £71bn (2.1%). 

This contrasts with the previous government’s plan to bring down the deficit in relation to the size of the economy to 1.2% of GDP by 2028/29.

Perhaps the biggest surprise was the £40bn upward revision to the budgeted deficit of £87bn for the current financial year ending in March 2025. This reflects a combination of £14bn in higher debt interest and £6bn in other forecast revisions, £23bn in higher spending (most of which is the £22bn ‘black hole’ identified by the incoming government over the summer) and £2bn in additional capital investment, less £1bn in tax measures and £4bn from the indirect economic effect of policy decisions. 

In later years, the principal driver of the increases in the deficit is higher capital investment as the Chancellor replaced the previous government’s plan to cut public sector net investment by almost a third over the next five years (from 2.5% to 1.7% of GDP) to a profile that sees net investment increase to 2.7% of GDP in 2025/26 and 2026/27 before returning to 2.5% of GDP in 2029/30.

The changes in the deficit between 2025/26 and 2029/30 can be summarised as follows:

2025/26: £28bn increase = £18bn higher capital investment + £10bn net other changes (£42bn additional spending – £25bn tax rises – £6bn indirect effects of decisions – £1bn forecast changes).

2026/27: £20bn = £23bn capital – £3bn net other changes (£44bn – £35bn – £5bn – £7bn).

2027/28: £21bn = £26bn capital – £5bn net other changes (£47bn – £40bn – £2bn – £10bn)

2028/29: £33bn = £27bn capital + £6bn net other changes (£49bn – £40bn + £2bn – £5bn)

2029/30: £36bn = £25bn capital + £11bn net other changes (£47bn – £42bn + £6bn – not published).

The increases in taxation, spending and capital investment won’t avoid the need for difficult choices in the Spending Review next year as departmental budgets will remain tight.

Government enters crisis control mode to curb public spending

Boost from self assessment tax receipts not enough to prevent a deficit in July as Chancellor searches for cost savings in the run up to the Autumn Budget.

The monthly public sector finances for July 2024 released by the Office for National Statistics (ONS) on Wednesday reported a provisional deficit for the first four months of the 2024/25 financial year of £51.4bn, £4.7bn worse than budgeted.

Alison Ring OBE FCA, ICAEW Director of Public Sector and Taxation, says: “Today’s data shows that the customary boost from self assessed tax receipts in July was not enough to prevent a deficit of £3.1bn, higher than budgeted, as cost pressures drove up public spending. Debt increased to £2,746bn or 99.4% of GDP at the end of July, up £5.9bn from the end of June 2024.

“The government is now in crisis control mode as it searches for savings to offset significant unbudgeted cost overruns in this financial year, with the cumulative deficit to July 2024 standing at £51.4bn, £4.7bn more than budgeted.

“Rumours that the government is looking at significant cuts in public investment programmes this year to keep within budget are concerning, given the importance to economic growth of infrastructure and the urgent need for upfront investment in technology to fix poorly performing public services. Our hope is that the Chancellor will be able to take a more strategic view in her Autumn Budget in October and in the Spending Review in the spring.”

Month of July 2024

There was a shortfall between receipts and spending of £3.1bn in the month of July 2024, £1.8bn higher than in July 2023 and £3.0bn worse than the budgeted deficit of £0.1bn.

Taxes and other receipts amounted to £99.4bn in July 2024, up £10.3bn or 12% from the previous month driven by self assessment income tax receipts in July, in line with the trend last year. Receipts were £2.0bn or 2% higher than in the same month last year, in contrast with total managed expenditure of £102.5bn, which was £3.8bn or 4% higher than in July 2023. 

Financial year to date

The shortfall between receipts and spending of £51.4bn for the four months to July 2024 was £0.5bn better than in the same period last year, but £4.7bn over budget.

Cumulative taxes and other receipts amounted to £359.3bn in the first third of the financial year, up 2% compared with the same period last year, while total managed expenditure was 2% higher at £410.7bn. This is illustrated by Table 1, which highlights how cuts to employee national insurance rates have been offset by higher income tax, VAT, corporation tax, and non-tax receipts. 

Total managed expenditure for the first four months of £410.7bn was also up by 2% compared with April to July 2023, but this reflected spending on public services up 4%, welfare spending up 6% and gross investment up 10% driven by overruns and construction cost inflation being offset by lower energy-support subsidies and lower debt interest.

The reduction in debt interest of £6.1bn compared with the first four months of last year was driven by a £26.5bn swing in indexation on inflation-linked debt that more than offset a £20.4bn increase in interest on variable and fixed-rate debt.

Table 1: Summary receipts and spending

  Apr-Jul 2024
£bn
 Apr-Jul 2023
£bn
 Change
%
Income tax89.986.4+4%
VAT67.966.0+3%
National insurance53.558.3-8%
Corporation tax34.031.6+8%
Other taxes73.572.1+2%
Other receipts40.537.5+8%
Total receipts359.3351.9+2%
    
Public services(212.2)(204.8)+4%
Welfare(103.1)(97.5)+6%
Subsidies(10.6)(14.0)-24%
Debt interest(46.6)(52.7)-12%
Gross investment(38.2)(34.8)+10%
Total spending(410.7)(403.8)+2%
    
Deficit(51.4)(51.9)-1%

Table 2 summarises how public sector net borrowing (PSNB) to fund the deficit of £51.4bn combined with borrowing of £4.4bn to fund working capital movements, student loans and other financing requirements increased debt by £55.8bn during the first four months of the financial year. As a result, public sector net debt grew to £2,745.9bn on 31 July 2024, which is £931bn or 51% more than the £1,815bn reported for 31 March 2020 at the start of the pandemic.

The ratio of net debt to GDP ratio is at the highest it has been since the 1960s, having increased by 1.3 percentage points from 98.1% on 1 April 2024 to 99.4% on 31 July 2024. Borrowing to fund the deficit was equivalent to 1.9% of GDP and other borrowing was equivalent to 0.2%, an increase of 2.1% before being offset by 0.8% from the effect of inflation and economic growth on GDP (usually referred to as ‘inflating away’). Lower inflation this year means this effect is less pronounced than in the same period last year.

Table 2: Public sector net debt and net debt/GDP

 Apr-Jul 2024
£bn
Apr-Jul 2023
£bn
PSNB51.452.3
Other borrowing4.4(11.4)
Net change55.840.9
Opening net debt2,694.12,539.7
Closing net debt2,745.92,580.6
PSNB/GDP1.9%2.0%
Other/GDP0.2%(0.4%)
Inflating away(0.8%)(1.5%)
Net change1.3%0.1%
Opening net debt98.1%95.7%
Closing net debt99.4%95.6%

Public sector net worth, the new balance sheet metric launched by the ONS last year, was -£740bn on 31 May 2024, comprising £1,613bn in non-financial assets and £1,062bn in non-liquid financial assets minus £2,746bn of net debt (£343bn liquid financial assets – £3,089bn public sector gross debt) and other liabilities of £669bn. This is a £67bn deterioration from the start of the financial year and is £123bn more negative than in July 2023.

Revisions and other matters

Caution is needed with respect to the numbers published by the ONS, which are expected to be repeatedly revised as estimates are refined and gaps in the underlying data are filled. This includes local government, where monthly data is based on budget or high level estimates in the absence of monthly data collection.

The latest release saw the ONS reduce the reported deficit for the first three months of the financial year by £1.5bn from £49.8bn to £48.3bn as estimates were revised for new data.