Spring Budget 2020: Hey big spender, spend a little infrastructure with me

12 March 2020: Rishi Sunak’s first Budget as Chancellor of the Exchequer provided a sharp change in direction for the public finances – something that will please and surprise many, according to ICAEW’s Public Sector team.

Spring Budget 2020 combined a short-term fiscal stimulus to fight the coronavirus with higher spending on public services and new infrastructure investment to increase borrowing significantly. Fortunately, ultra-low interest rates will keep financing costs down on the more than £330bn in borrowing planned to finance these plans (not including short-term fiscal stimulus measures), with public sector net debt expected to exceed £2.0tn by 2025.

This Budget is particularly important as it sets the spending envelope for the three-year Spending Review expected to be published later this year. With a higher base for spending following the Spending Round 2019 announced by the previous Chancellor in October, this signals an end to the austerity policies of recent administrations. 

Key headlines for 2020-21:

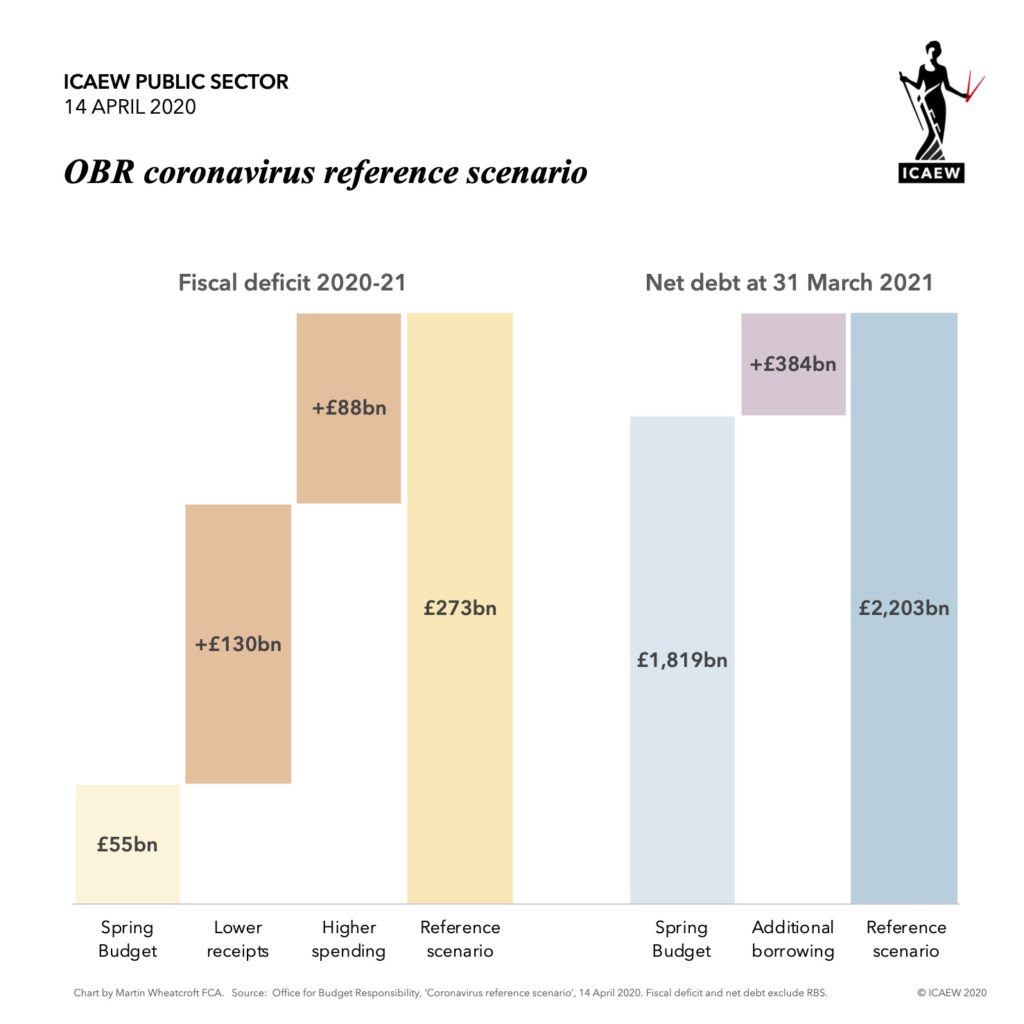
  • Fiscal deficit up from £40bn to £55bn (2.4% of GDP), before coronavirus measures.
  • No significant tax changes beyond corporation tax remaining at 19%.
  • £14bn extra current spending and £5bn extra investment before coronavirus measures.
  • £12bn in tax and spending measures to respond to the coronavirus.
  • Gross financing requirement of £162bn, including £98bn to cover debt repayments.
  • No reflection of uncertain adverse economic effect of the coronavirus on tax revenues.

Key headlines for the four subsequent years to 2024-25:

  • Fiscal deficit of £62bn (2.5% of GDP) on average over the subsequent four years.
  • Tax policy measures to generate an additional £7bn per year.
  • Extra current spending of £27bn a year and extra investment of £19bn a year.
  • Gross financing requirement of £595bn (£149bn a year) including £315bn to cover repayments.
  • Significant economic uncertainty with coronavirus, global economic conditions and changes in UK trading relationships with the EU and other countries.

The existing plans already incorporated a significant ramp-up in infrastructure and other investment spending with public sector net investment forecast to increase from 2.2% of GDP in 2019-20 to 3.0% by 2022-23. The challenge for the Government will be to deliver and ‘get things done’, especially as capital investment by government departments is expected to increase by 25% in 2020-21 and by a further 35% over the subsequent four years. Will there be sufficient construction capacity and project management expertise to deliver such a rapid expansion and still deliver value for money for taxpayers?

The Budget also contained some important developments in the framework for the public finances, with a specific commitment to review the investment criteria in the Government’s ‘Green Book’ to ensure regions outside London and the South East benefit from the additional infrastructure spend proposed in the Budget. The focus on looking at the effect on investments on the public balance sheet was also welcome with new approaches planned for how to appraise public spending.

One surprise in the Budget announcement was that the OBR did not revise the economic forecasts down as much as had been expected. This was partly because of the economic benefits of higher public spending and investment, but also reflected an improved outlook for productivity. The benefit of this for the Chancellor was that he was able to announce additional current spending on public services, while still remaining within the fiscal rules set out in the Conservative party manifesto.

Unfortunately, the scale of the impact of the coronavirus on the economy is still unclear and so the forecasts for tax revenues may need to be revised downwards, potentially significantly, in the Autumn Budget later this year.

Commenting on Spring Budget 2020, Alison Ring, Director, Public Sector, at ICAEW said: “The Chancellor has announced a major loosening of the taps on spending and investment in his first Budget, with a combination of a short-term fiscal stimulus to fight the coronavirus, higher spending on public services, and a major programme of new infrastructure investment.

Those wondering where all the funding for this planned spending will come from may be surprised to discover that the Chancellor has not followed the custom of post-general election tax rises, but instead has decided to take advantage of ultra-low interest rates to borrow more than £330bn over the next five years. Public sector net debt is expected to exceed £2.0tn by 2025, although the Government hopes that this will then be falling as a ratio to the size of the economy.

Nevertheless, it is a Budget that many will be pleased with, even if a little surprising coming from the traditional champions of small government.”

This article was originally published by ICAEW.

ICAEW chart of the week: Raising taxes is hard to do

6 March 2020: How can the Chancellor raise taxes in the forthcoming Spring Budget?

Tax receipts 2019-20 £751bn. Top six taxes £615bn (82%): income tax £196bn. VAT £155bn, NI £143bn, corporation tax £54bn, council tax £36bn, business rates £31bn.

Traditionally, the first Budget after an election raises taxes and this would be a logical step given plans to increase public spending and investment in infrastructure. But which taxes could the Chancellor increase?

As the #icaewchartoftheweek illustrates, the top six taxes generate over 80% of tax receipts. But the Conservative manifesto rules out increases in the headline rates of income tax, national insurance and VAT, while increasing the corporation tax rate would be difficult given the planned cut from 19% to 17% has already been suspended. Most local authorities are already planning to increase council taxes as much as they can while increasing business rates would be really difficult.

We await the Budget to see what the Chancellor decides to do. Some money could be generated from increasing or introducing smaller taxes but for larger sums, the main place to look would be from reforming tax reliefs and exemptions, such as the rumoured abolition of Entrepreneurs’ Relief. However, it would be a brave Chancellor that decided to go after larger sums, for example by extending the scope of VAT.

Of course, the Chancellor might decide to cut taxes instead, hoping to boost a sluggish economy and so generate greater sums through higher levels of growth. Either way, borrowing is likely to increase – fortunately at extremely low interest rates.

This chart was originally published by ICAEW.

ICAEW chart of the week: UK international reserves

21 February 2020: UK international reserves of £41bn analysed by currency.

UK international reserves: £149bn assets - £108bn liabilities = £41bn net. Euro £12bn, US dollars £13bn, Other currencies £6bn, Gold £10bn.

The UK’s official holdings of foreign government debt, central bank deposits, IMF Special Drawing Rights (SDRs) and gold are the subject matter for the #icaewchartoftheweek, being the foreign currency assets and liabilities used in monetary operations.

The UK Government and the Bank of England together held £149bn in foreign currency assets as of 31 December 2019, equivalent to approximately two months’ public spending or just under 7% of gross national income. However, these assets were offset by £108bn in foreign currency liabilities, comprising £59bn in net financial derivatives (currency forwards, interest rate and cross-currency swaps), £23bn due on repo transactions and £26bn in other liabilities.

Even though the official reserves are an extremely important tool used to help ensure the smooth operation of financial markets, provide confidence in the UK’s financial stability and (if needed) support the value of sterling, the net balance of £41bn is relatively small, with £12bn invested in the Euro, £13bn in the US dollar and £6bn in the Yen and other currencies, together with £10bn of gold.

This chart was originally published by ICAEW.

ICAEW chart of the week: Regional capex

Chart: Difference from average identifiable public sector Capex per per year of £967. See table at end of post.

The #icaewchartoftheweek this week is on the subject of public sector capital expenditure across the UK in the light of speculation that the Spring Budget in March will feature a significant boost to capital spending in the North of England.

We thought it might be interesting to look at the most recent data; albeit the usual caveats apply to the numbers given the lack of formal systems in government to fully track expenditure by region and the differences between capital expenditure in the fiscal numbers (shown in the chart) and the capital expenditure reported in the (as yet unpublished) Whole of Government Accounts for 2018-19.

According to the ONS, there was £64.2bn in capital expenditure that can be identified by nation and region of the UK, an average of £967 for the 66.4m people living in the UK in 2018-19.

It is perhaps not surprising that there is more capital spending in London than the per capita average given that the millions of commuters and visitors that add to the 8.9m local population every day. However, the scale of the difference is substantial with £13bn invested in 2018-19, an average of £1,456 per person – £489 more than the UK average.

Of course, variations in capital expenditure are to be expected across a country of the size of the UK given the different natures and needs of each region and nation. For example, Scotland’s much higher level of per capita public capital expenditure (£7.2bn / 5.4m people = £1,325 per person) needs to be seen in the context that it comprises a third of the land area of the entire UK, but only has 8% of the population.

The region that incurs the least capital expenditure on a per capita basis is the East Midlands, where £3.0bn was spent in 2018-19, an average of £621 per person (£346 less than the average) for each of the 4.8m people living there. This is followed by Yorkshire and The Humber (£694 per person), the South West (£723) and the West Midlands (£799).

Most of the other regions are close to the average, including (perhaps surprisingly given some of the headlines), the North East and the North West.

One question that does come to mind – if Government’s intention is to rebalance regional inequalities by investing more in the ‘Northern Powerhouse’ and the ‘Midlands Engine’, will it have anything to spare for the ‘Great South West’ too?

2018-19
Capex

Population
Per
capita
Difference
from average
North East£2.4bn2.7m£906-£61
North West£7.0bn7.3m£955-£12
Yorkshire and The Humber£3.8bn5.5m£694-£273
East Midlands£3.0bn4.8m£621-£346
West Midlands£4.7bn5.9m£799-£168
East of England£5.7bn6.2m£924-£43
London£13.0bn8.9m£1,456+£489
South East£8.6bn9.1m£945-£22
South West£4.0bn5.6m£723-£244
Wales£3.0bn3.1m£956-£11
Scotland£7.2bn5.4m£1,325+£358
Northern Ireland£1.8bn1.9m£949-£18
United Kingdom£64.2bn66.4m£967

Source: ONS, Country and regional public sector finances 2018-19: identifiable capital expenditure.

ICAEW chart of the week: Post-GE2019 fiscal deficits

With the General Election now complete, the Office for Budget Responsibility (OBR) was able to release a restated version of its March 2019 fiscal forecasts this morning, reflecting technical revisions to the way the fiscal numbers are calculated, in particular that of student loans. This enables us to update the numbers set out our GE2019 Fiscal Insight on the party manifestos as best we can, given that the OBR has not deigned to include either the changes to public spending announced in the Spending Round 2019 nor the tax and spending changes in the Conservatives manifesto.

As illustrated by the #icaewchartoftheweek, the revised baseline forecast for the fiscal deficit is now £50bn for the current fiscal year, followed by £59bn next year in 2020-21, £58bn in 2021-22 and 2022-23 and £60bn in 2023-24.

It was frustrating that the OBR scheduled their publication of these revised numbers for the first day of the General Election purdah period making it vulnerable – as happened – to being pulled. A day earlier and that would not have happened! Ideally, these revisions would have been published as soon as practical after the publication by the ONS of their revisions to historical numbers in September.

It would have been even better if the OBR had been able to update their economic forecast too, given that the current baseline is still based on an economic and fiscal analysis from nine-months ago. With weak economic growth over the first half of the financial year, it is likely that the OBR will cut its forecasts for tax revenues over the forecast period when it does get round to updating them, resulting in higher deficits – even before taking account of suggestions that the Conservative GE2019 winners plan to announce a splurge of more capital expenditures in the Spring Budget in February.

Unfortunately, we won’t see an updated long-term forecast until at least July 2020, when the OBR is scheduled to publish its next fiscal sustainability report on the prospects for the public finances.

ICAEW chart of the week: General Election 2019

With voters in the UK going to the polls tomorrow, the #icaewchartoftheweek is on the political party’s plans for the public finances.

All the political parties are promising to increase taxes, public spending and investment, with the plan to eliminate the fiscal deficit now well and truly abandoned. 

The Conservatives are promising the least in terms of additional spending and investment, with £3bn a year extra spending in 2023-24, £8bn in extra capital investment and tax rises broadly offsetting tax cuts. However, this is unlikely to be the final result as they have deferred significant financial decisions, such as the funding of adult social care, until after the election. 

Labour is planning to spending much more with £83bn a year more spending by 2023-24, funded by £78bn tax increases and £5bn from higher economic growth. They plan capital investment of £55bn a year and £58bn in total over five years to compensate ‘WASPI’ women. This is pretty ambitious, leading the IFS and others to cast doubt on the achievability of their plans, while these numbers don’t include the additional borrowing from their plans to nationalise utilities, nor the borrowing of those businesses post-nationalisation.

The Lib Dem plans are also very ambitious, with £50bn extra a year public spending by 2024-25 funded by £37bn in higher taxes and £14bn in higher economic growth from cancelling Brexit. They plan to borrow an extra £25bn a year to fund new capital investment.

The Greens’ are planning to be even more ambitious, including completely reforming welfare provision with the introduction of a universal basic income, contributing to a £124bn increase in taxes and public spending (albeit some of this is a switch from tax deductions to cash payments). Their capital investment plans are the largest and likely to most difficult to deliver of all the major parties at £82bn a year on average over 10 years.

Unfortunately, none of the major political parties appear to have a fiscal strategy that extends beyond the next five years, with only limited measures to address the big financial challenges of more people living longer. This is disappointing given that relatively small actions taken now could make a big difference to the financial position of the nation in 25 years’ time.

ICAEW’s full analysis of the party manifestos can be found at icaew.com/ge2019manifestoanalysis.


You can be part of the conversation as part of ICAEW’s GE 2019: It’s More Than a Vote campaign.

ICAEW Fiscal Insight: General Election 2019

On 12 December 2019, voters have the opportunity to focus on the big challenges of sustainability, technology and the public finances as they elect a government for the next four and a half years. 

ICAEW have published a Fiscal Insight on the General Election 2019 manifesto proposals of the Conservatives, the Labour Party, the Liberal Democrats and the Green Party.

All the political parties are promising to increase taxes, public spending and investment. The Conservatives are promising the least, but they have deferred significant decisions. Other parties propose spending a lot more, with Labour planning to nationalise utilities. There are new fiscal rules, but questions about whether they would be adhered to.

This is in the context of public finances that are on a financially unsustainable path and – disappointingly – none of the parties set out a long-term fiscal strategy. There are significant risks around the achievability of all the party manifesto plans, with the projected deficit in 2023–24 of £62bn (Conservatives), £118bn (Labour), £76bn (Liberal Democrats) or £133bn (Greens).

Read the Fiscal Insight on the ICAEW website.

ICAEW chart of the week: Age profile of monthly public spending

Chart: £902 at age 0, £1,505 at 10, £889, £618, £639, £742, £761 at age 60, £1,761 at 70, £2,246, £3,296, £3,515 at age 100.

With the General Election in full swing, the #icaewchartoftheweek is on one of the principal drivers of public spending: age.

As data from the Office for Budget Responsibility illustrates, public spending on the young increases as the population is educated, but then falls back to a low of around £600 per month at around age 28, after which spending per person starts to increase gradually over working lives until retirement age. From that point on, not only is there a significant increase in welfare spending as the state pension kicks in, but the costs of health care, and then adult social care start to increase dramatically.

With the number of people in the UK aged 70 or more expected to increase by 58% over the next 25 years, total public spending will increase accordingly, especially with all political parties promising to protect and improve the state pension, health provision and adult social care.

The number of people under the age of 70 projected by the ONS to increase by only around 2% over that same period, or potentially even fall by around 7% if net inward migration is lower than expected, while further cuts in public services are apparently off the table with the ‘end of austerity’. The implication is that taxes will need to rise, that social provision in retirement will need to be cut, or for there to be a resumption in austerity policies  (or a combination of all three).

Unfortunately, none of the major political parties appear to have a fiscal strategy that extends beyond the next five years, with only limited measures to address the big financial challenges of more people living longer. This is disappointing given that relatively small actions taken now could make a big difference to the financial position of the nation in 25 years’ time.

This election, voters have the opportunity to focus on the big challenges of sustainability, technology and the public finances. To find out more, visit GE2019 – It’s More Than a Vote.

ICAEW chart of the week: Public sector capital expenditure

Chart: Capex (real-terms) £61.5bn (3.5% of GDP) in 2009-10, to £64.1bn in 2011-12, down to £49.2bn (2.6%)  in 2013-14, up to £60.0bn (2.9%) in 2017-18.

With apologies for the delay because of being away, this week’s #ICAEWchartoftheweek is on public sector capital expenditure (capex), something that all the political parties in the #GE2019 have promised to increase – in some cases by very significant amounts! 

As part of ICAEW’s It’s More Than A Vote campaign, ICAEW will be analysing the political party manifestos over the next few weeks, including the potential implications for the public finances.

One area that all the major parties appear to agree on is the need to increase investment in infrastructure and other assets, which is why we thought we would look at the last nine years of capital expenditure reported in the Whole of Government Accounts (WGA), prepared under International Financial Reporting Standards. This differs from public sector investment in the National Accounts, with the latter including capital grants and other transactions that do not result in the creation of publicly-owned fixed assets.

As the chart illustrates, capital expenditure in 2017-18 of £60.0bn was lower than the £64.1bn incurred in 2011-12 after adjusting for inflation and to include Network Rail, the government owned railway infrastructure company prior to 2014-15 when it was incorporated into the WGA). As a proportion of the economy, capex in 2017-18 was 2.9% of GDP, a smaller ratio than the 3.5% calculated for 2011-12.

Only around £16bn (0.8% of GDP) of the amount spent in 2017-18 went into infrastructure assets (principally transport infrastructure such as roads and railways), with in the order of £24bn (1.2%) going into land & buildings, including hospitals and schools. Approximately £9bn (0.4%) was spent on military equipment, with the balance of £11bn (0.5%) invested in other public sector assets, ranging from tangible fixed assets such as plant & equipment, IT hardware, vehicles and furniture & fittings, as well as intangible fixed assets such as software.

Capex comprises a relatively small proportion of total expenditures (capital and non-capital) of £1.0tn reported in the WGA for 2017-18. As a consequence, even relatively small incremental amounts will constitute proportionately large increases in capital budgets in the next few years.

Whether these plans will be deliverable is another question, given that traditionally the government has struggled to spend all its capital budgets, not to mention the difficulties there will be in finding all the workers necessary for a major expansion in construction activity.

It’s More Than A Vote

ICAEW chart of the week: First half fiscal deficit

H1 2018-19 -£33.2bn fiscal deficit + £4.5bn growth + £1.8bn RBS dividends - £3.0bn lower revenues - £10.4bn higher spending = -£40.3bn fiscal deficit for H1 2019-20.

The ONS published the fiscal numbers for the first half of the UK Government’s 2019-20 financial year this morning, with the #icaewchartoftheweek illustrating the changes in comparison with the first half of last year.

If revenues had increased in line with economic growth then the deficit would have reduced by £4.5bn (net of the effect of inflation on both revenues and expenditures). Unfortunately, tax receipts have been relatively weak, coming in £3.0bn below growth, with higher national insurance and council tax receipts being more than offset by lower corporation tax, income tax, inheritance tax, fuel duties, excise duties, and stamp duty.

The Government’s preferred measure of the deficit (which excludes government-owned banks) did benefit from £1.8bn in dividends from the Royal Bank of Scotland.  

Expenditures were £10.4bn higher than the first half of last year, reflecting more spending on public services (including the NHS), Brexit preparations, a growth in the size of the civil service, and a £3bn or so increase in capital investment.

This means that there is a shortfall of £40.3bn between receipts of £395.5bn and expenditures of £435.7bn in the first half of this financial year, compared with £33.2bn for the same period last time, when receipts were £384.2bn and expenditures totalled £417.4bn. (The first half deficit last year was originally reported as £19.9bn. This was subsequently revised down to £19.3bn before £13.9bn in accounting changes, including irrecoverable student loans.)

Fortunately for the Chancellor, the deficit tends to be much lower in the second half of the year given the boost from self-assessment tax declarations in January. Despite this the deficit could exceed £50bn this year if trends continue, a big disappointment for those who had hoped to continue on the path to eliminating the deficit.

With warning signs over the economy flashing, these numbers do not provide an auspicious backdrop for the Budget on Wednesday 6 November when the Chancellor is hoping to announce a number of major tax cuts.

For further information go to:

ONS – Public sector finances, September 2019

OBR – Commentary on the Public Sector Finances: September 2019