“Despite its impact on the government’s interest bill, there is a major benefit to inflation in that it helps bring down the debt-to-GDP ratio more quickly, providing the Chancellor more space to intervene to help with the cost of living,” Martin Wheatcroft, public finance adviser to ICAEW, explains.
According to the OBR, the new measures announced in the Spring Statement, along with the existing package announced previously, should offset around a third of the increase in costs that households are facing, leaving them with the burden of the other two-thirds, Wheatcroft says. “I think we should expect further measures from the Chancellor in the summer or autumn as the impacts on households become more apparent.”
Wheatcroft adds that it is likely that some of the announcements included in the Spring Statement were brought forward to ease tensions with backbenchers. “With members of his own party pressing for a delay in the NIC increase, I suspect the Chancellor felt pressure to bring forward measures that he may have been saving for later in the year, in particular his planned cut to income tax in 2024 and a tax plan that was likely set for a summer release ahead of the Autumn Budget.”
February’s £13.1bn deficit was offset by revisions to prior month estimates, boosting public finances and putting further pressure on the Chancellor to provide more help to households and businesses facing rapidly rising prices.
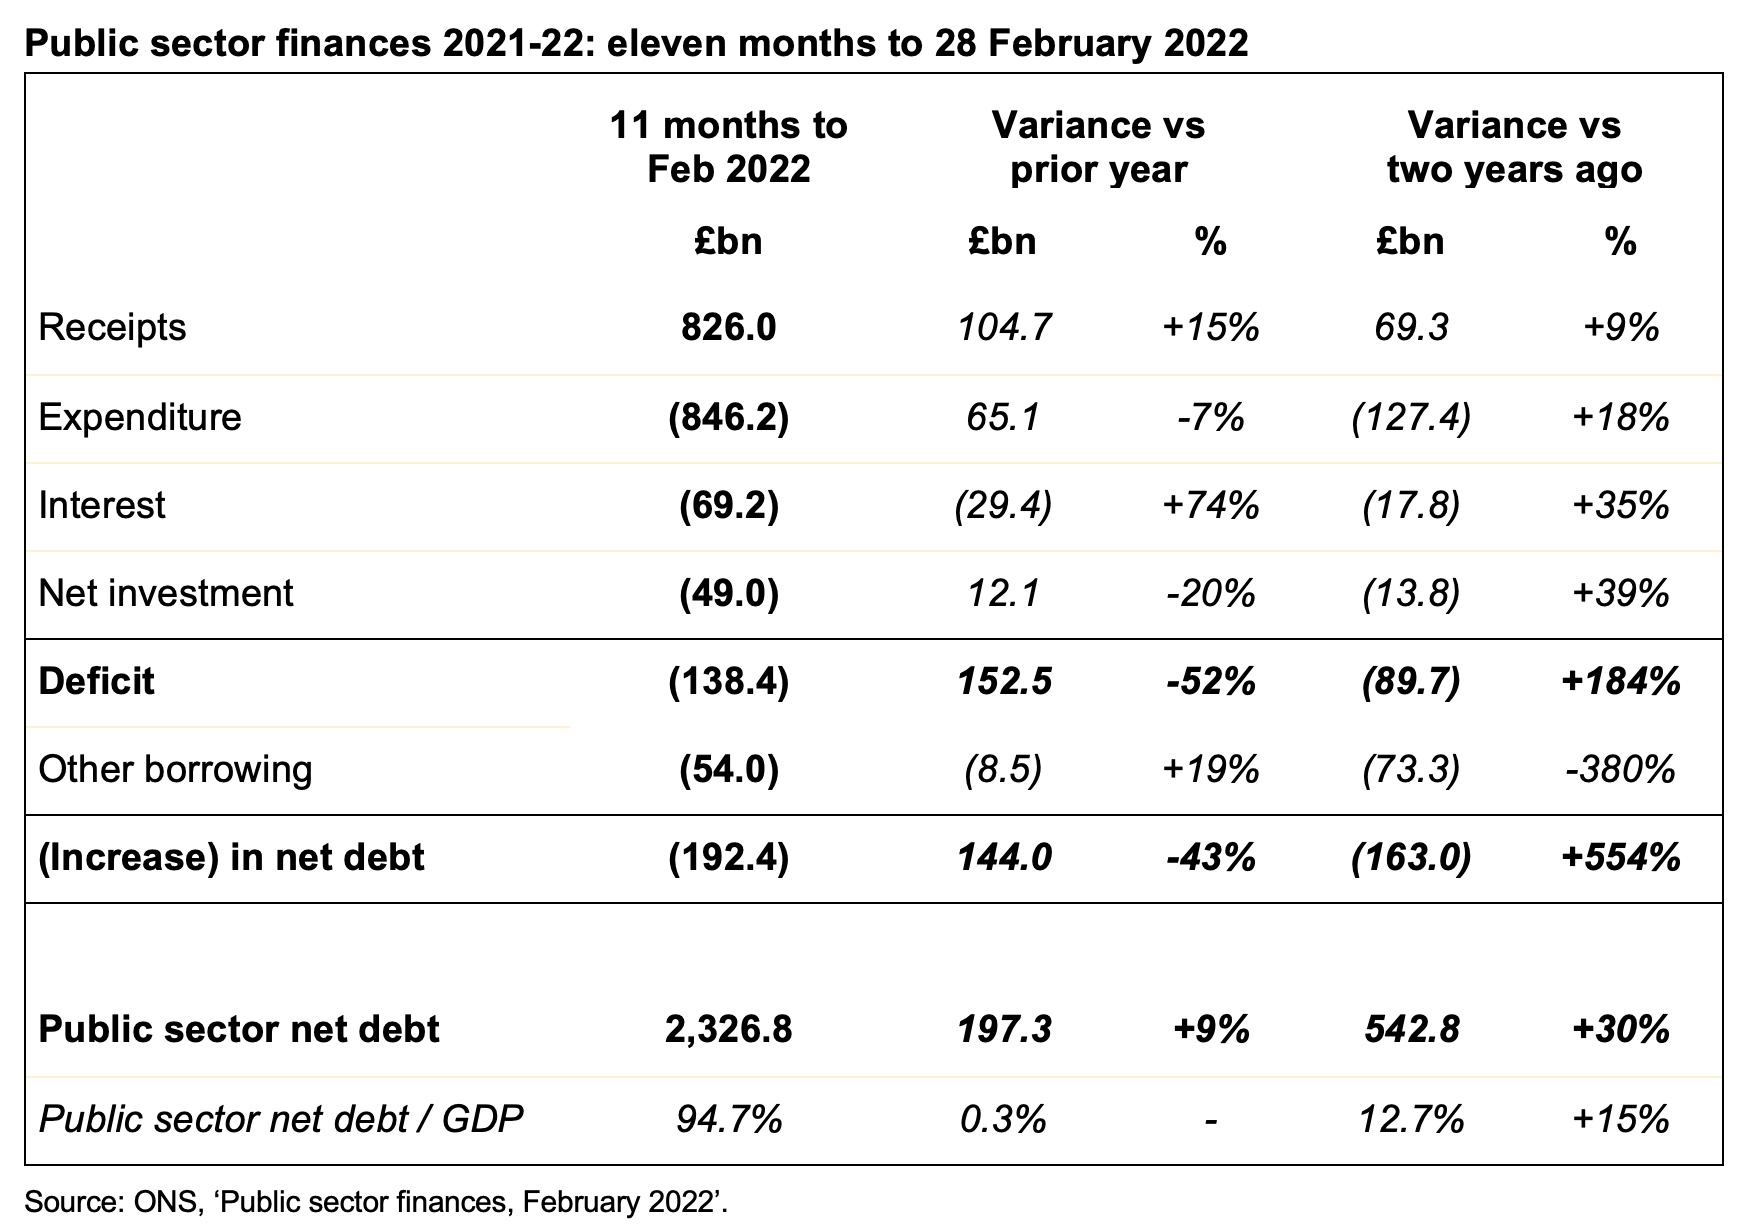
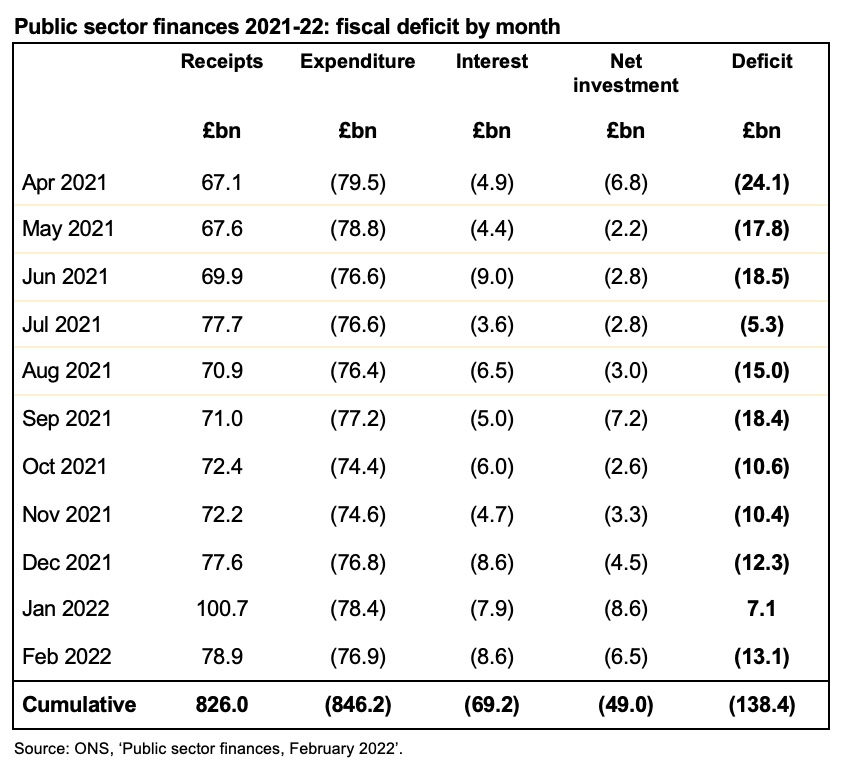
The public sector finances for February 2022, released on Tuesday 22 March 2022, reported a deficit for the month of £13.1bn. This was an improvement of £2.4bn from the deficit of £15.4bn reported for February 2021, but £12.8bn worse than the £0.4bn deficit reported for February 2020.
The cumulative deficit of £138.4bn for the first 11 months of the 2021/22 financial year was £0.1bn less than that reported last month, as the £13.1bn deficit for February was offset by £13.2bn in revisions to prior month estimates.
Public sector net debt increased by £6.6bn from £2,320.2bn at the end of January to £2,326.8bn or 94.7% of GDP at the end of February, with tax and loan recoveries partly offsetting the deficit for the month. Despite that, debt is £192.4bn higher than at the start of the financial year and £533.7bn higher than March 2020.
The year-to-date deficit of £138.4bn compares with a cumulative deficit for the first 11 months of the financial year of £290.9bn in 2020/21 and £48.7bn in 2019/20. This was £25.9bn below the forecast published by the Office for Budget Responsibility alongside last October’s Autumn Budget and Spending Review 2021, with higher-than-forecast tax receipts being partially offset by higher-than-forecast interest charges on index-linked debt. Both are driven by higher rates of inflation, which takes more time to feed through to non-interest expenditure. This suggests that the deficit for the full year could end up somewhere in the region of £30bn below the official forecast of £183bn.
Cumulative receipts in the first 11 months of the 2021/22 financial year amounted to £826.0bn – £104.7bn or 15% higher than a year previously but £69.3bn or 9% above the level seen in the first 11 months of 2019/20. At the same time, cumulative expenditure excluding interest of £846.2bn was £65.1bn or 7% lower than the same period last year, but £127.4bn or 18% higher than two years ago.
Interest amounted to £69.2bn in the eleven months to 28 February 2022, which was £29.4bn or 74% higher than the same period in 2020/21, principally because of the effect of higher inflation on index-linked gilts. Interest costs were £17.8bn or 35% more than in the equivalent 11-month period ended 29 February 2020.
Cumulative net public sector investment up to February 2022 was £49.0bn. This was £12.1bn or 20% below the £29.7bn reported for the first 11 months of last year, which included around £17bn of COVID-19 related lending that the government does not expect to recover. Investment was £13.8bn or 39% more than two years ago, principally reflecting greater capital expenditures, including on HS2.
The increase in debt of £192.4bn since the start of the financial year comprises the cumulative deficit of £138.4bn and £54.0bn in other borrowing. The latter has been used to fund lending to banks through the Bank of England’s Term Funding Scheme, lending to businesses via the British Business Bank (including bounce-back and other coronavirus loans), student loans and other cash requirements, net of the recovery of taxes deferred last year and loan repayments.
Alison Ring OBE FCA, Public Sector and Taxation Director for ICAEW, says: “Today’s numbers show the impact inflation is having on the public finances as it continues to drive both tax receipts and interest costs higher. The deficit for the financial year is expected to be around £30bn lower than October’s official forecast of £183bn, while tomorrow’s Spring Statement forecasts could see a smaller deficit next year than the £62bn expected before the pandemic.
“Uncertainty about the impact of the war in Ukraine on the UK means it will be extremely difficult for the Chancellor to gauge the level of intervention needed to support households and businesses facing rocketing energy prices if he’s to avoid a recession that could permanently damage the economy and the public finances, and still leave room for tax cuts in the Autumn Budget.”
Caution is needed with respect to the numbers published by the Office for National Statistics (ONS), which are expected to be repeatedly revised as estimates are refined and gaps in the underlying data are filled.
The ONS made a number of revisions to prior month and prior year fiscal numbers to reflect revisions to estimates. These had the effect of decreasing the reported fiscal deficit for the 10 months to January 2022 by £13.2bn from £138.5bn to £125.3bn and reducing the deficit for the year ended 31 March 2021 by £4.1bn from £321.9bn to £317.8bn.
This week’s chart reviews the sharp increase in the national debt to GDP ratio as we reflect on the challenges facing Chancellor Rishi Sunak.
Better tax receipts and higher inflation are expected to contribute to an improvement in the fiscal forecasts that will accompany the Spring Statement on 23 March 2022, further increasing the pressure on the Chancellor to do more to support households and businesses facing spiralling energy prices and a cost-of-living crisis.
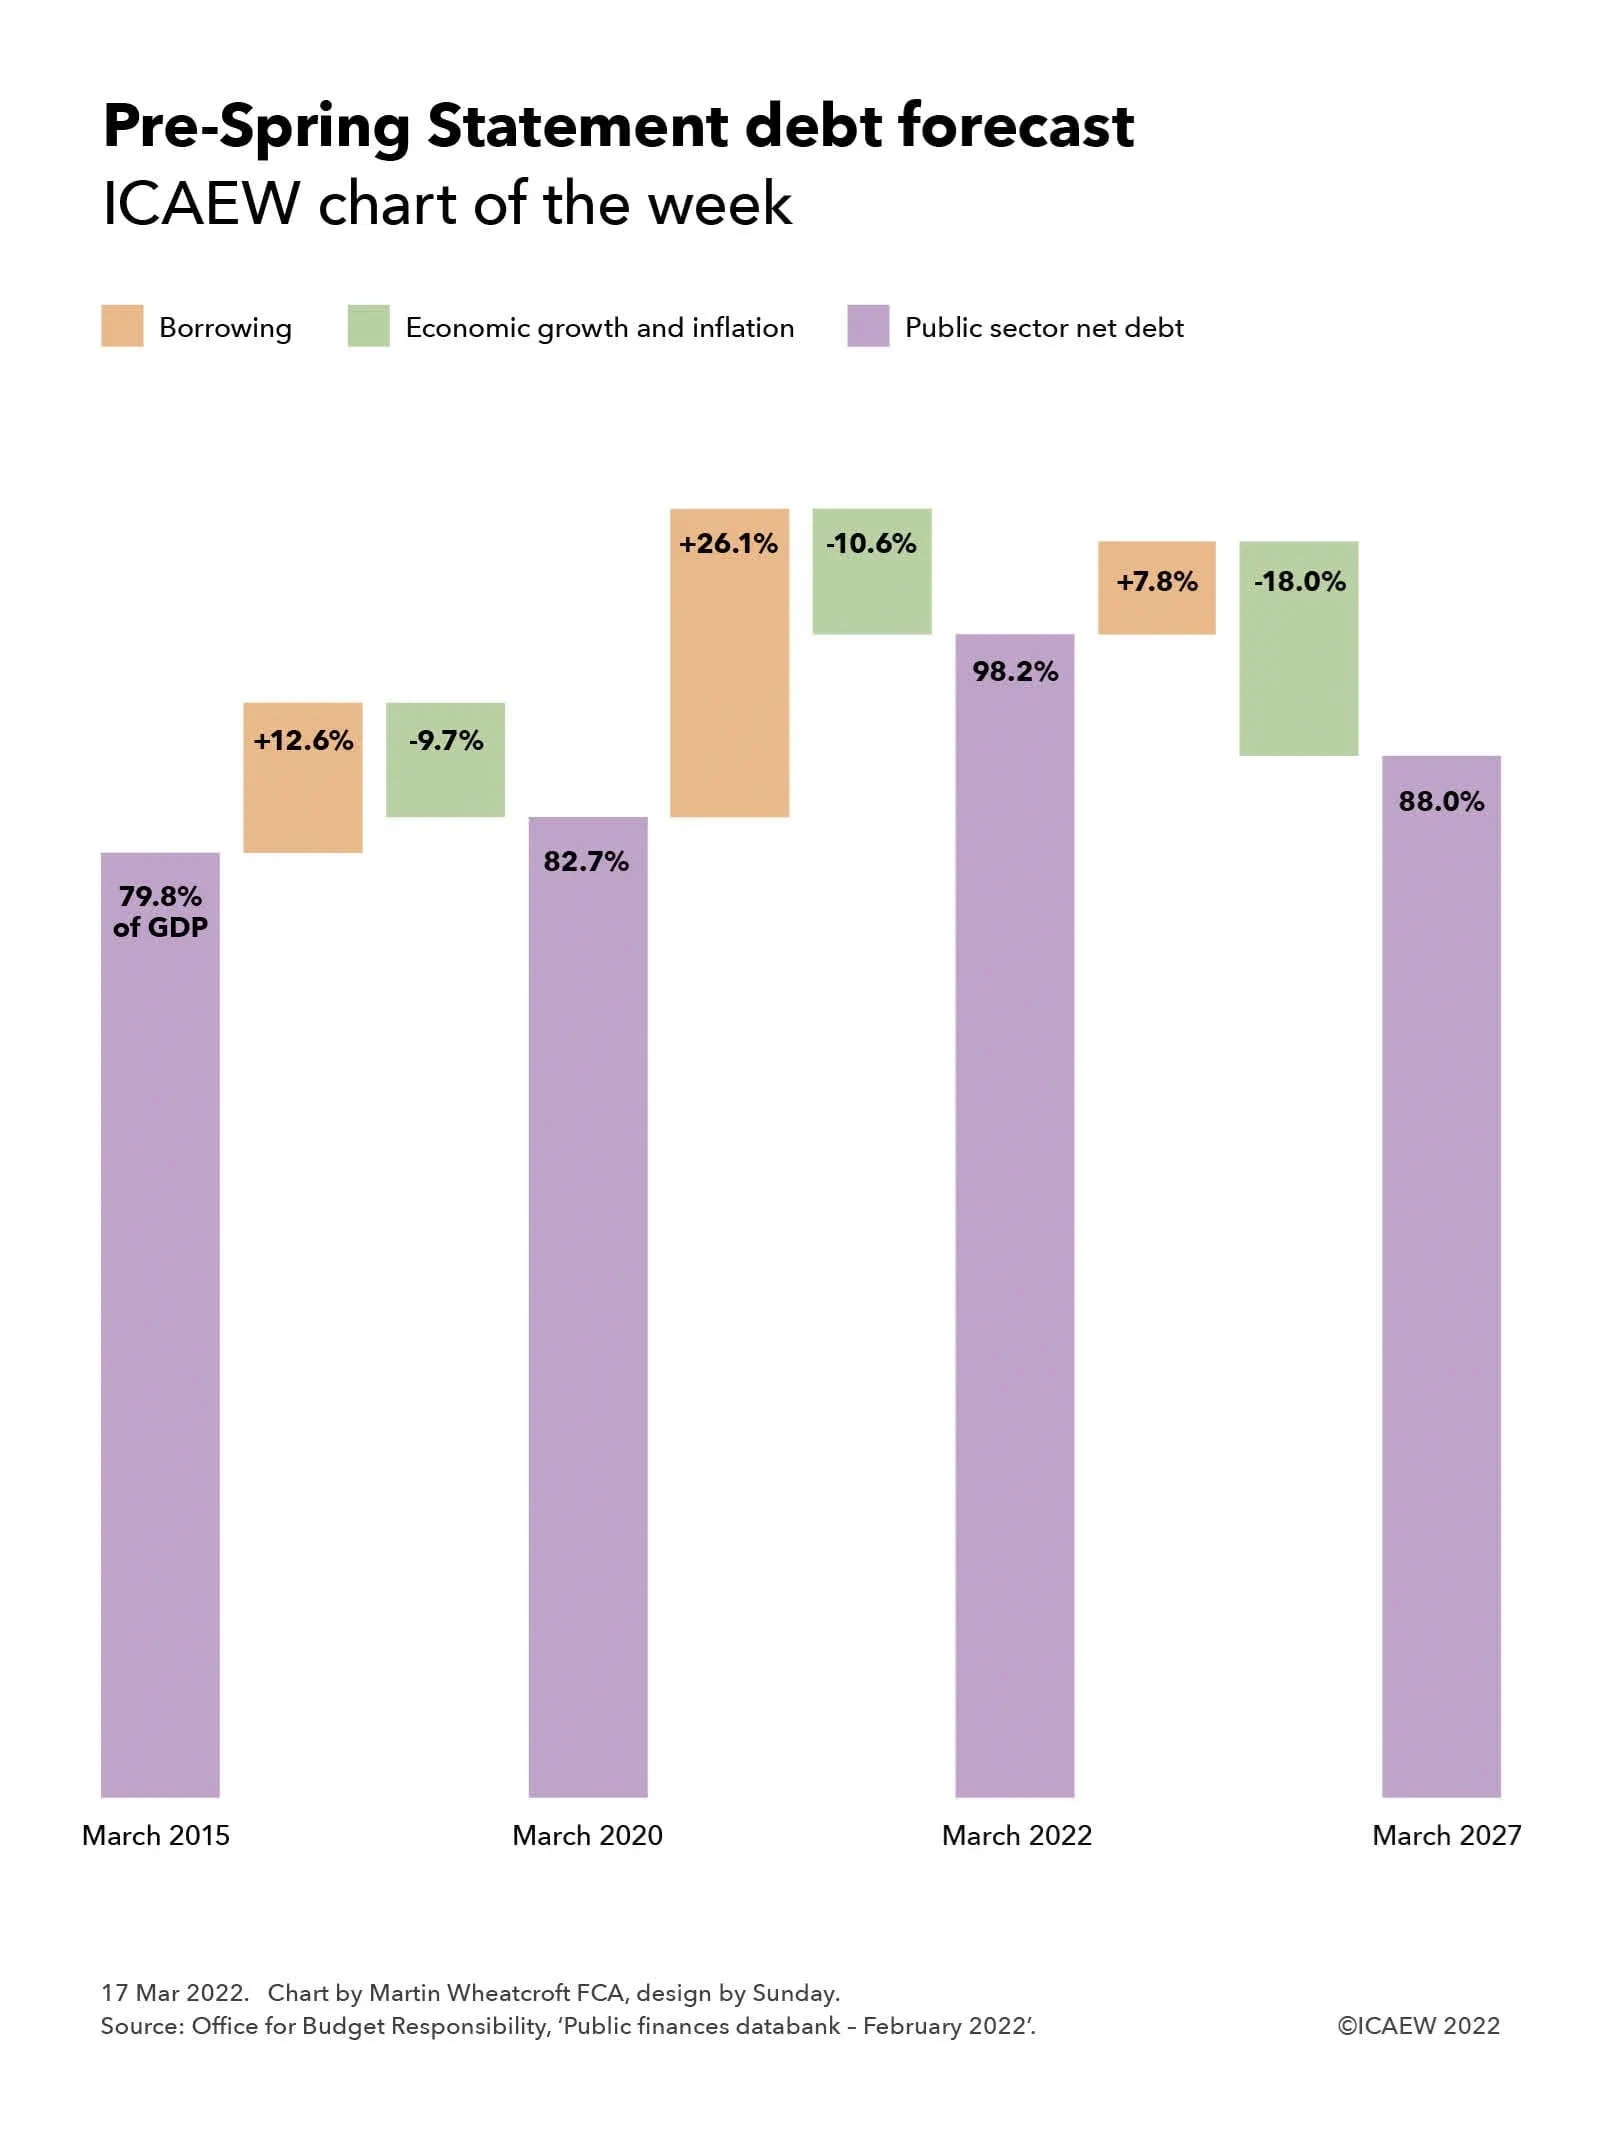
Our chart this week is based on the latest official forecast for public sector net debt prior to its update on 23 March 2022 at the Spring Statement. The chart highlights how it took five years for debt to increase from 79.8% to 82.7% as a share of GDP before leaping to a projected 98.2% over the two years to 31 March 2022 and then falling to a projected 88.0% at 31 March 2027.
The debt to GDP ratio is probably the most important key performance indicator used by most governments to assess their public finances, so much so that when ministers talk about reducing debt, they do not mean paying back the amounts owed to debt investors (unless they are in the German government). Instead, governments in most developed countries aim to borrow at a slower rate than the increase in the size of the economy, allowing the combination of economic growth and inflation to offset the often-significant sums of cash required to finance the shortfall between tax receipts and public spending.
This objective has been difficult to achieve over the past decade of low economic growth and low inflation, as illustrated by the increase in the UK’s debt to GDP ratio from 79.8% to 82.7% between 31 March 2015 and 2020. In cash terms, public sector net debt increased by £261bn from £1,532bn to £1,793bn over that five-year period, equivalent to 12.6% of a year’s GDP. The debt to GDP ratio only went up by 2.9 percentage points, with economic growth and inflation offsetting the increase in the amounts owed by the equivalent of 9.7% of GDP. (The objective would have been achieved but for a quirk in the choice of GDP measure used for this calculation by the Office for National Statistics in the UK, which is ‘mid-year GDP’; at 31 March 2020 this encompassed both the last six months of 2019/20 before the pandemic but also the first six months of 2020/21 and the lockdowns that occurred during that time, reversing some of the economic growth experienced in the preceding five years.)
The chart goes onto illustrate how the more than half a trillion pounds (£576bn or 26.1% of GDP) borrowed by the government in just two years over the course of the pandemic is partially offset by the economic recovery and a great deal more inflation, reducing the impact on the debt to GDP ratio by the equivalent of 10.6%.
Debt as a share of GDP over the next five years is then expected to decline, with a projected net addition of £198bn (7.8% of GDP) expected to be added to debt according to last October’s forecast. Projected public sector net debt of £2,567bn at 31 March 2027 is currently expected to be lower in proportion to the size of the economy at 88.0% of GDP, as the post-pandemic recovery and already forecast higher rates of inflation cause GDP to rise at a faster rate than the government can borrow, resulting in a reduction equivalent to 18.0% of GDP.
The official projections for the current financial year, prepared last October by the Office for Budget Responsibility (OBR), are expected to be revised upwards to incorporate the stronger tax receipts reported in recent monthly public sector finance reports and higher levels of GDP from even higher rates of inflation than previously expected. These effects are likely to combine to reduce the 98.2% of GDP forecast for debt for the end of March 2022 by several percentage points.
There is a much greater deal of uncertainty about how the OBR’s medium-term projections will deal with the potential future path of the pandemic, the cost-of-living squeeze on household incomes, and the effect of the war in Ukraine and sanctions on Russia on UK businesses. This is in addition to its normal difficulty in both measuring and forecasting the trillions of financial transactions that are undertaken every year in an economy of more than 67m people.
Many economic commentators expect stronger tax receipts and higher inflation to flow through to the projections for the next five years, even after taking account of the increased interest costs that come from higher rates of inflation and higher interest rates and the already announced package of support measures for households struggling with energy price rises. This should in theory result in a substantial improvement in the projected debt to GDP ratio in March 2027 from the 88.0% previously forecast, but what we won’t know until the Spring Statement is to what extent Chancellor Rishi Sunak intends to spend some of that improvement.
Mixed signals mean that it is difficult to tell to whether there will be an improvement to the support package to households facing large rises in their energy costs and the prices they pay for food and other essentials, whether the Chancellor will also choose to reduce fuel duties to help motorists, and how far he will opt to support businesses affected by substantially higher input costs in addition to the knock-on effects of the war in Ukraine and sanctions on Russia. Not to mention the political pressure on the Chancellor to announce increases in the defence budget now rather than waiting for the Autumn Budget.
For what was envisioned as a quiet fiscal occasion dealing with routine revisions to the fiscal forecasts, the Spring Statement has turned into a significant fiscal event. After all, even if the Chancellor decides to do nothing, that will still be a choice, with major implications for the public finances and the UK economy.
As the sage once said (or possibly didn’t), we live in fiscally interesting times.
Our chart this week delves into New Zealand’s public finances, one of the very few developed countries to have a government balance sheet with positive net assets.
The signing of the UK-New Zealand Free Trade Agreement on 28 February 2022 prompted us to take a look at New Zealand’s public finances, one of the few developed countries with public assets in excess of public liabilities, and a pioneer of accruals accounting in government.
New Zealand is a leading country in adopting accruals accounting for use in government, with the financial statements prepared in accordance with New Zealand-adopted accruals-based International Public Sector Accounting Standards (IPSAS), which are aligned with IFRS with some adaptation for the public sector. The New Zealand government not only uses IPSAS for financial accounting and reporting, similar to how the UK’s Whole of Government Accounts is based on IFRS, but they also use these standards for budgeting, management accounting and fiscal target setting. This contrasts with the UK, which uses a distinct UK-specific ‘resource’ accounting framework for budgeting and management accounting, and the statistics-based National Accounts system for fiscal target setting.
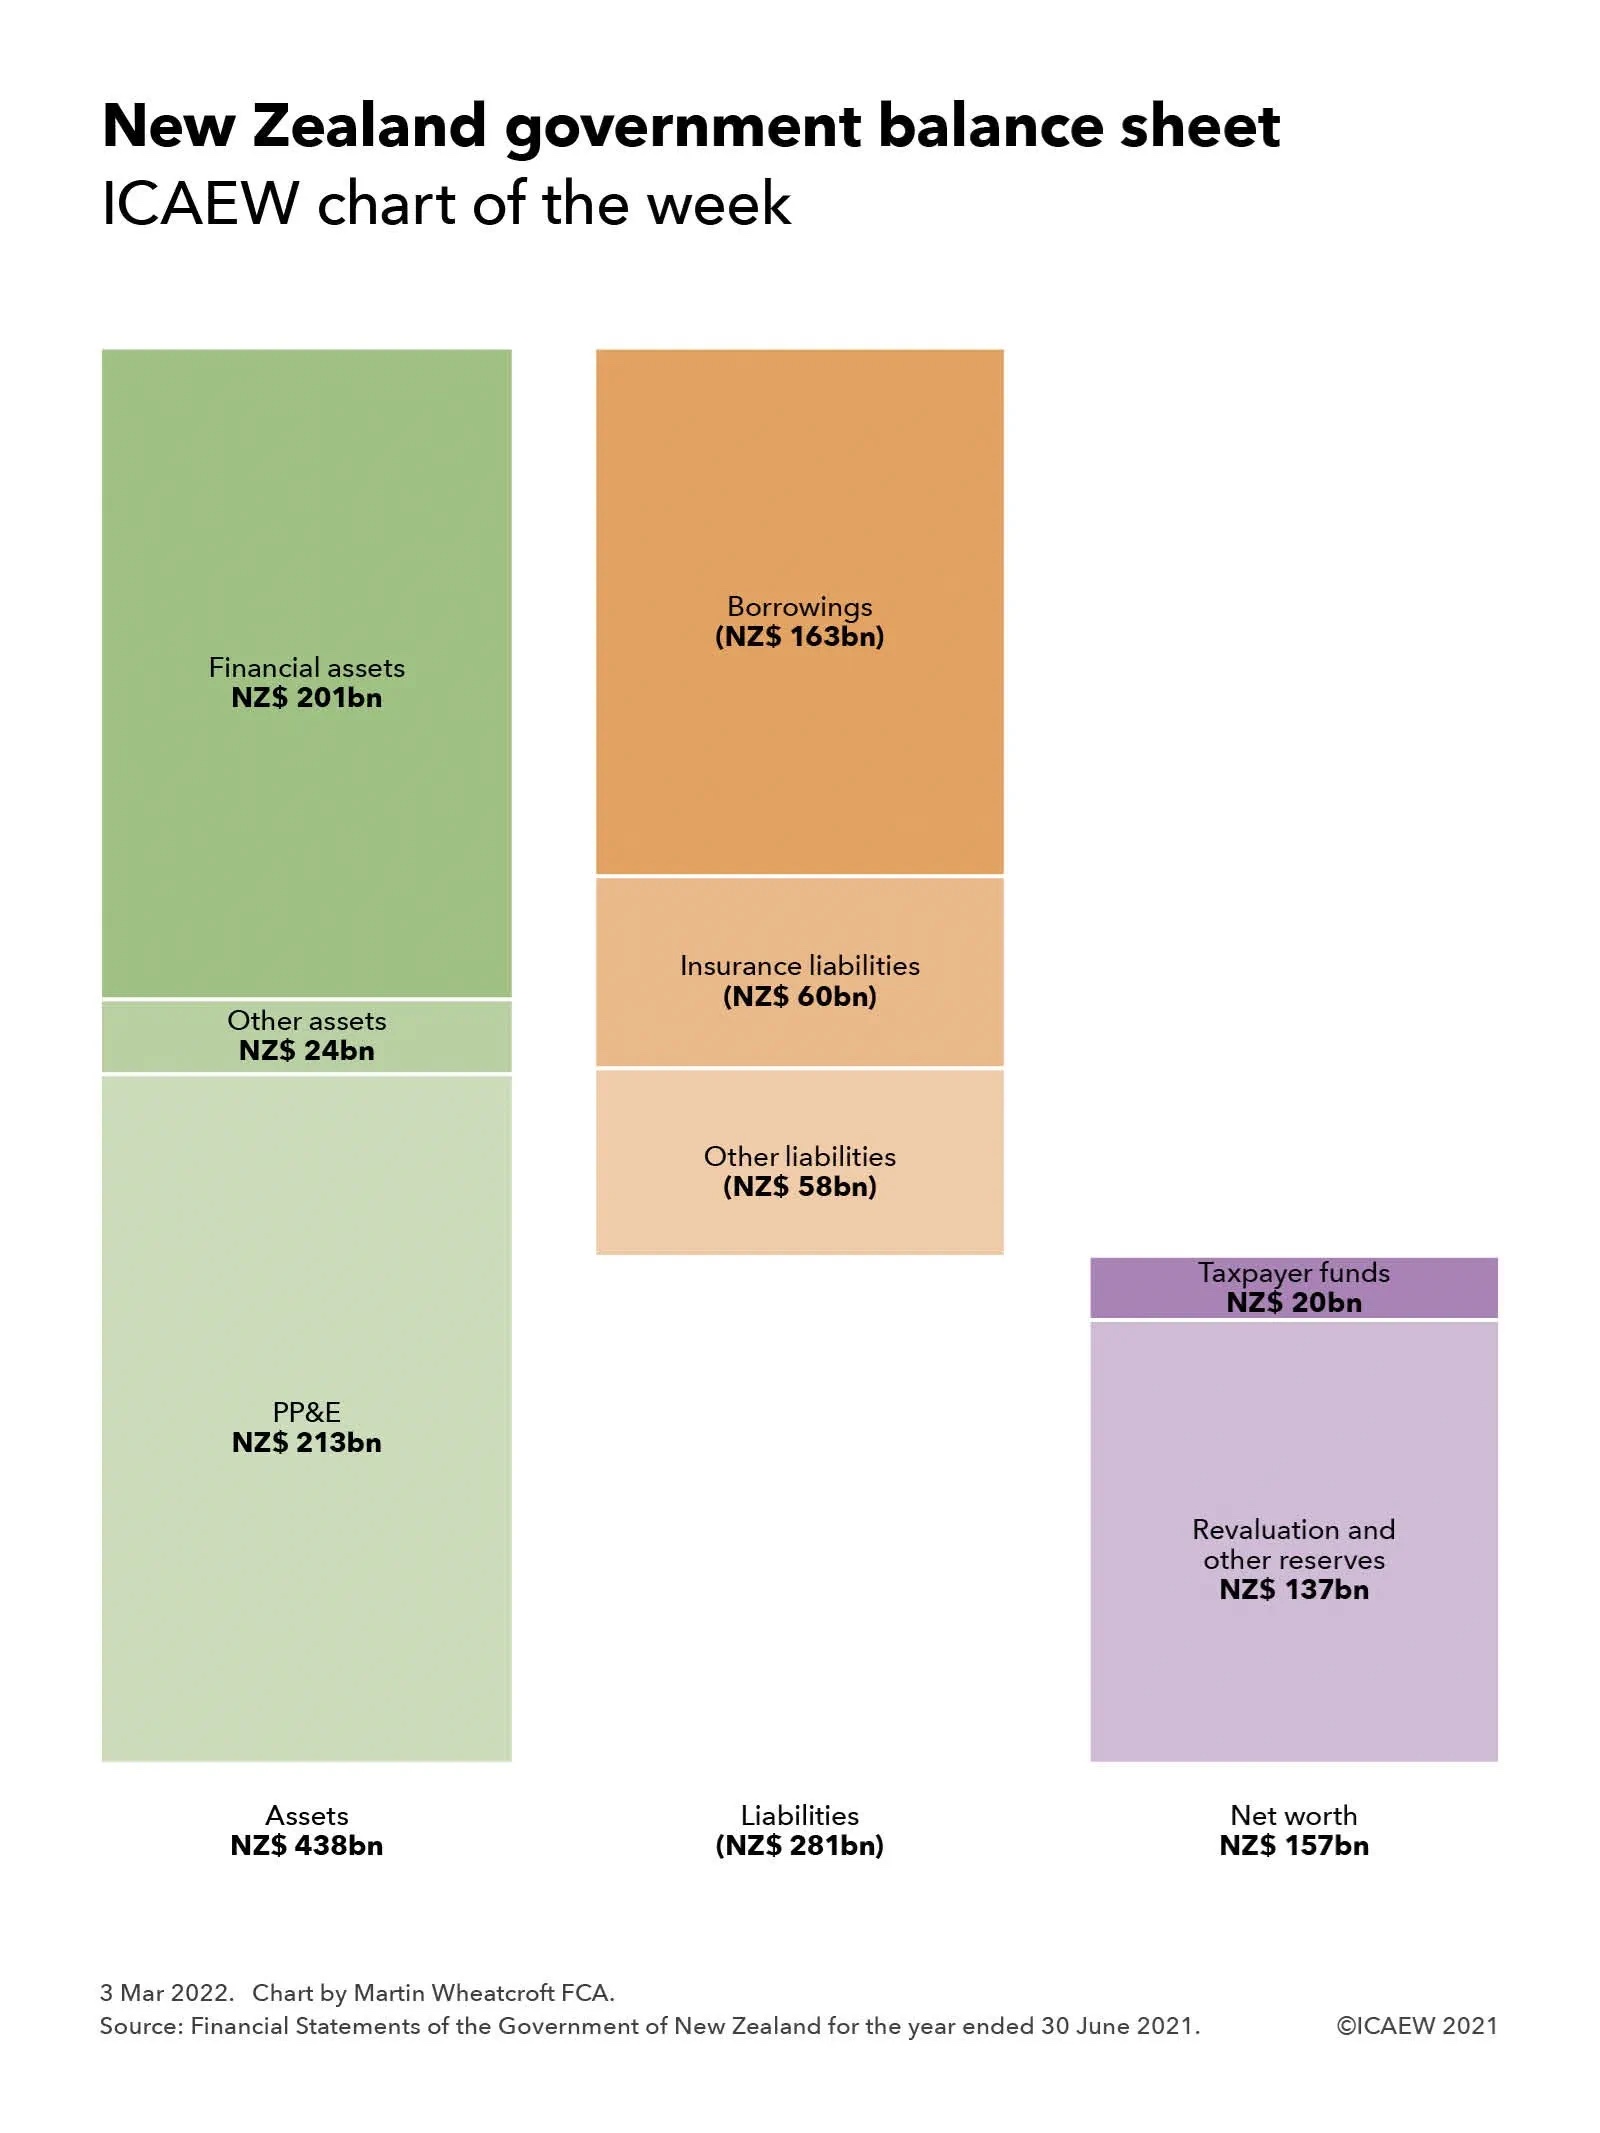
The asset side of the balance sheet includes NZ$213bn (£109bn) of property, plant and equipment, other non-financial assets of NZ$24bn (£12bn) and financial assets of NZ$201bn (£102bn). The latter includes marketable securities, student loans, residential loans and other financial investments in addition to receivables and cash.
Liabilities include NZ$163bn (£82bn) of borrowings, insurance liabilities of NZ$ 60bn (£31bn) and other liabilities of NZ$58bn (£30bn). Insurance liabilities are relatively high compared with many other countries as a consequence of New Zealand’s unique national no-fault accident compensation scheme that covers everyone in the country, including visitors.
Net worth is made up of taxpayer funds of NZ$20bn (£10bn) and reserves of NZ$137bn (£70bn), with the latter comprising a property revaluation reserve of NZ$134bn (£68bn) and minority interests of NZ$6bn (£3bn) less negative reserves of NZ$3bn (£1bn) principally relating to defined benefit retirement plans and veterans disability entitlements.
With a population of 5.1m, net worth on a per capita basis at 30 June 2021 is equivalent to approximately NZ$31,000 (£16,000) per person, comprising NZ$86,000 (£44,000) in assets per person less NZ$55,000 (£28,000) in liabilities per person. This compares with the approximate negative net worth of £37,000 per person based on the UK Whole of Government Accounts at 31 March 2019, comprising £31,000 in assets per person less £68,000 in liabilities per person.
While some caution needs to be taken in comparing these amounts given differences in accounting policies and the exclusion of local government from the New Zealand numbers, they do provide an insight into how on a proportional basis the New Zealand public sector is much better capitalised than the UK public sector.
While there are significant differences between the economies of New Zealand and the UK that no doubt explain the respective strengths and weaknesses of their public balance sheets, the presence of accountants in New Zealand’s highest office, most recently Sir John Key (prime minister 2008-2016), may also have something to do with it.
January’s public sector finance surplus of £2.9bn was driven by a boost to tax revenues as inflation drove up VAT receipts and self assessment income grew, putting further pressure on Chancellor Rishi Sunak to increase support to households facing huge rises in energy prices.
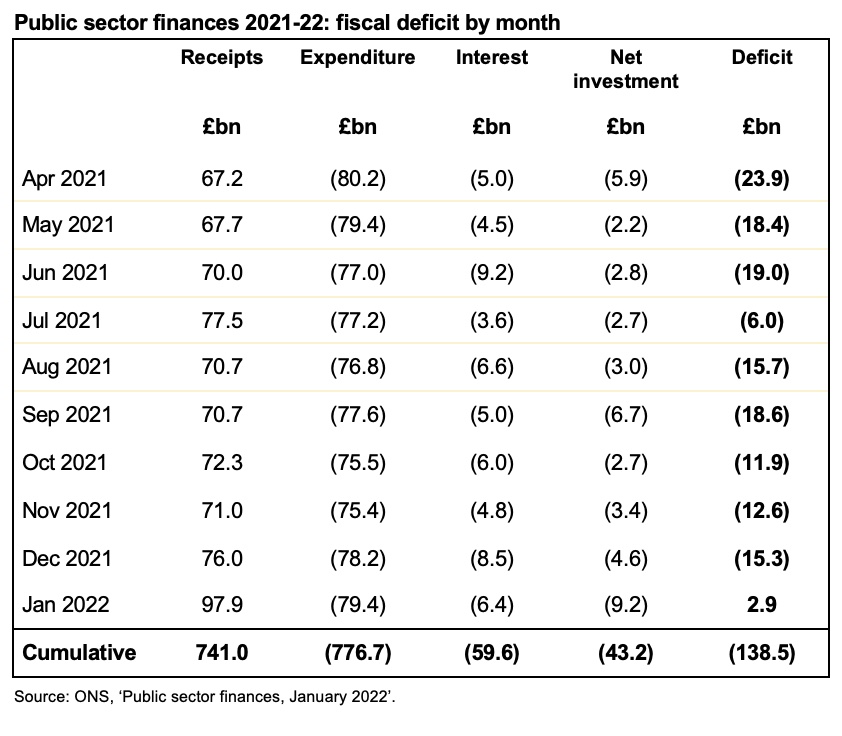
The public sector finances for January, released on 22 February, reported a surplus for the month of £2.9bn. This was an improvement of £5.4bn from the deficit of £2.5bn reported for January 2021, but £7bn smaller than the £9.9bn surplus reported for January 2020.
Total receipts were £97.9bn in January, up from £76.0bn in the previous month.
Public sector net debt fell from £2,339.7bn at the end of December to £2,317.6bn or 95% of GDP at the end of January, with tax and loan recoveries supplementing the surplus for the month. Despite that, debt is £210.7bn higher than at the start of the financial year and £524.5bn higher than in March 2020.
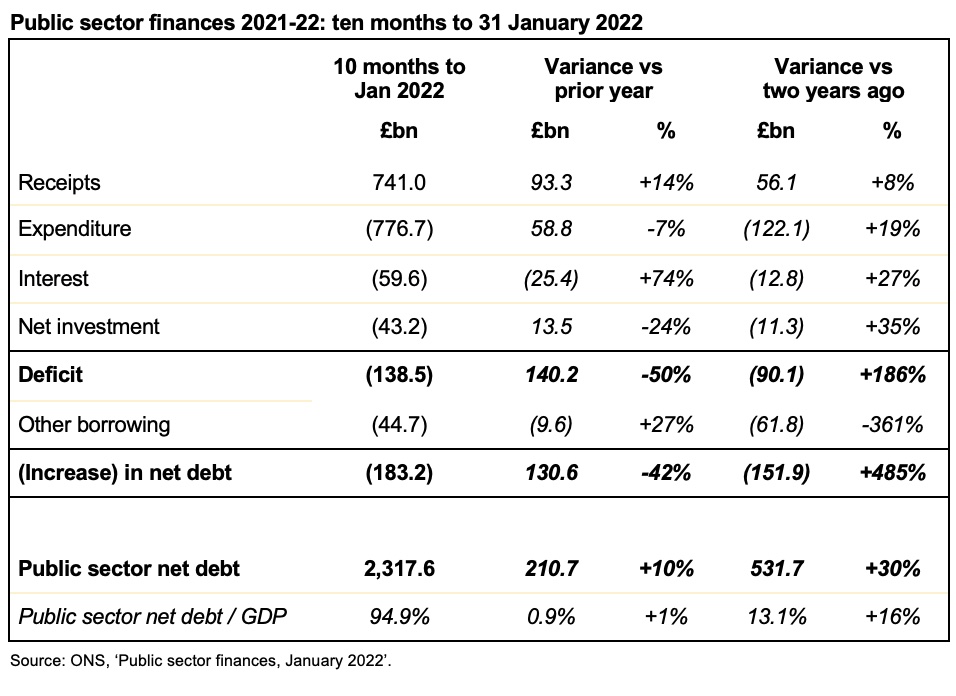
The cumulative deficit for the first 10 months of the financial year was £138.5bn, compared with £278.7bn and £48.4bn for the same period last year and the year before that respectively.
This was £17.7bn below the forecast published by the Office for Budget Responsibility (OBR) alongside last October’s Autumn Budget and Spending Review 2021, although higher than forecast tax receipts were partially offset by higher than forecast interest charges on index-linked debt. Both are driven by higher rates of inflation, which takes more time to feed through to non-interest expenditure.
Cumulative receipts in the first 10 months of the 2021/22 financial year amounted to £741bn, £93.3bn or 14% higher than a year previously, but only £56.1bn or 8% above the level seen in the first 10 months of 2019/20. At the same time, cumulative expenditure excluding interest of £776.7bn was £58.8bn or 7% lower than the same period last year, but £122.2bn or 19% higher than two years ago.
Interest amounted to £59.6bn in the 10 months to January 2022, £25.4bn or 74% higher than the same period in 2020/21, principally because of the effect of higher inflation on index-linked gilts. Interest costs were £12.8bn or 27% more than in the equivalent 10-month period ended 31 January 2020.
Cumulative net public sector investment up to January 2022 was £43.2bn. This was £13.5bn or 24% below the £56.7bn reported for the first 10 months of last year, which included around £17bn of COVID-19-related lending that the government does not expect to recover. Investment was £11.3bn or 35% more than two years ago, principally reflecting greater capital expenditures, including on HS2.
The increase in debt of £183.2bn since the start of the financial year comprises the cumulative deficit of £138.5bn and £44.7bn in other borrowing. The latter has been used to fund lending to banks through the Bank of England’s Term Funding Scheme, lending to businesses via the British Business Bank (including bounce-back and other coronavirus loans), student loans, and other cash requirements, net of the recovery of taxes deferred last year and loan repayments.
Alison Ring OBE FCA, Public Sector and Taxation Director for ICAEW, said: “The strong tax receipts reported today will provide a welcome respite for the public finances, reducing the shortfall in the government’s income compared with its expenditure from previous forecasts. However, the deficit is still on track to be the third highest ever recorded in peacetime, while public debt is more than half a trillion pounds higher than it was at the start of the pandemic.
“The challenge for Sunak will be balancing the strong pressures on him to increase the support package for households facing rapidly rising energy costs and retail prices, with the need to strengthen the resilience of the public finances in the face of a great deal of economic uncertainty and increasing global security concerns. The Chancellor will be acutely aware that while inflation is adding to tax revenues today it will go on to add to public spending tomorrow”.
Caution is needed with respect to the numbers published by the ONS, which are expected to be repeatedly revised as estimates are refined and gaps in the underlying data are filled.
The ONS made a number of revisions to prior month and prior year fiscal numbers to reflect revisions to estimates. These had the effect of decreasing the reported fiscal deficit for the nine months to December 2021 from £146.8bn to £141.4bn and increasing the deficit for the year ended 31 March 2021 from £321.8bn to £321.9bn.
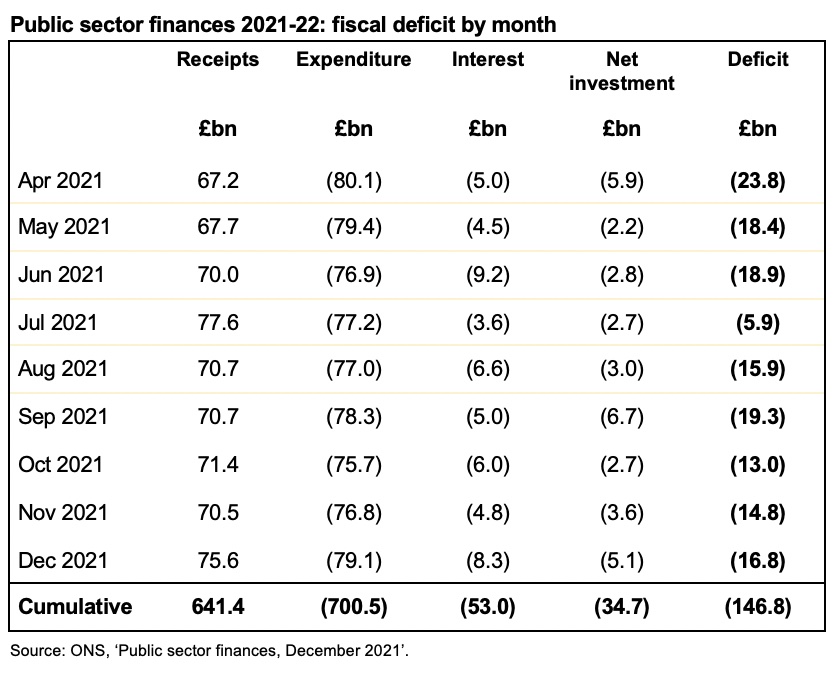
December’s deficit of £16.8bn saw both a rise in tax revenues and in interest on inflation-linked debt as pressure grows on the Chancellor to address energy price hikes and rising prices in the shops. The public sector finances for December 2021 released on Tuesday 25 January 2022 reported a monthly deficit of £16.8bn. This was £7.6bn lower than the £24.4bn reported for December 2020 but £11bn higher than the £5.8bn deficit reported for December 2019.
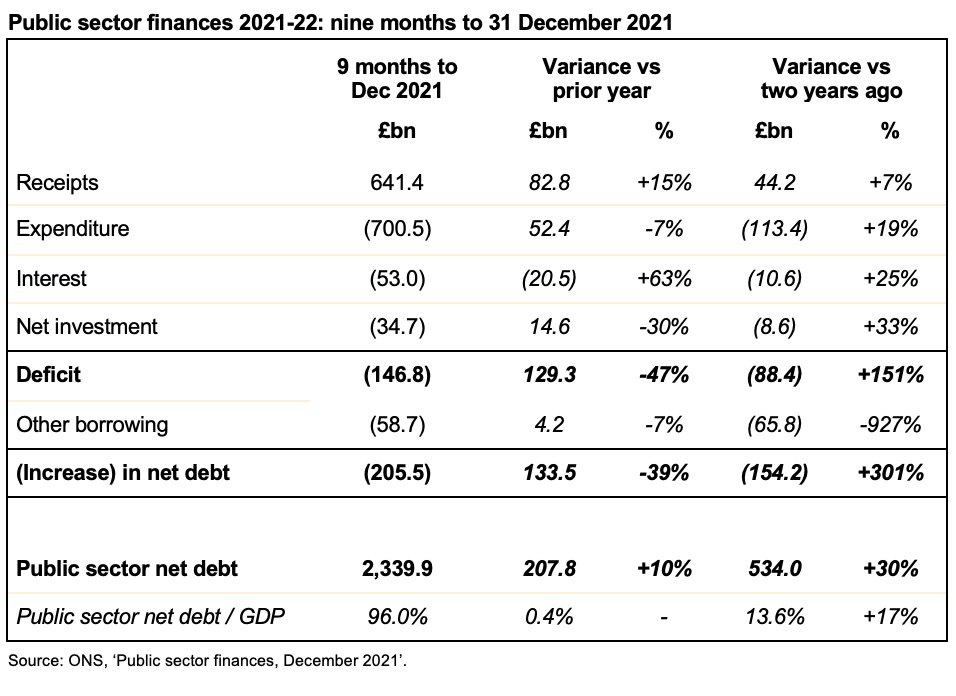
This brings the cumulative deficit for the first nine months of the financial year to £146.8bn compared with £276.1bn and £58.4bn for the same period last year and the year before that respectively.
Public sector net debt increased from £2,321.8bn at the end of November to £2,339.9bn or 96% of GDP at the end of December. This is £205.5bn higher than at the start of the financial year and an increase of £546.8bn from March 2020. As a proportion of GDP, debt is the highest it has been since March 1963, almost 60 years ago.
The deficit for the month was in line with the revised forecast for 2021/22, published by the Office for Budget Responsibility (OBR) alongside last October’s Autumn Budget and Spending Review 2021, although higher than forecast interest charges on index-linked debt offset the benefit of higher than forecast tax revenues.
Cumulative receipts in the first three quarters of the 2021/22 financial year amounted to £641.4bn, £82.8bn or 15% higher than a year previously, but only £44.2bn or 7% above the level seen in the first three quarters of 2019/20. At the same time, cumulative expenditure excluding interest of £700.5bn was £52.4bn or 7% lower than the first nine months of 2020/21, but £113.4bn or 19% higher than the same period two years ago.
Interest amounted to £53bn in the nine months to December 2021, £20.5bn or 63% higher than the same period in 2020/21, principally because of the effect of higher inflation on index-linked gilts. Interest costs were £10.6bn or 25% more than in the equivalent nine months ended 31 December 2019.
Cumulative net public sector investment in the three quarters to December 2021 was £34.7bn. This was £14.6bn or 30% less than the £49.3bn reported for the first nine months of last year, which included around £17bn of COVID-19-related lending that the government does not expect to recover. Investment was £8.6bn or 33% more than two years ago, principally reflecting greater capital expenditures, including on HS2.
The increase in debt of £205.5bn since the start of the financial year comprises the deficit of £146.8bn and £58.7bn in other borrowing. The latter was used to fund lending to banks through the Bank of England’s Term Funding Scheme, lending to businesses overseen by the British Business Bank (including bounce-back and other coronavirus loans), student loans, and other cash requirements, net of the receipt of taxes deferred last year and loan repayments.
Martin Wheatcroft FCA, external advisor on public finances to ICAEW, said: “Today’s numbers highlight the impact inflation is having on the public finances, with higher tax revenues collected in December offset by the rising cost of index-linked debt. We expect interest charges to increase further in the next few months as the time lag on index-linked debt catches up with the current 7.5% rate of RPI.
“With borrowing costs low and headroom in forecasts for the next financial year, the temptation will be to delay fixing the public finances in order to tackle the immediate hit to household budgets from anticipated energy prices hikes and higher prices in the shops, so pressure on the Chancellor to postpone or phase in April’s national insurance rise is likely to grow.”
Caution is needed with respect to the numbers published by the ONS, which are expected to be repeatedly revised as estimates are refined and gaps in the underlying data are filled.
The ONS made a number of revisions to prior month and prior year fiscal numbers to reflect revisions to estimates. These had the effect of decreasing the reported fiscal deficit for the eight months to November 2021 from £136bn to £130bn and the deficit for the year ended 31 March 2021 from £321.9bn to £321.8bn.
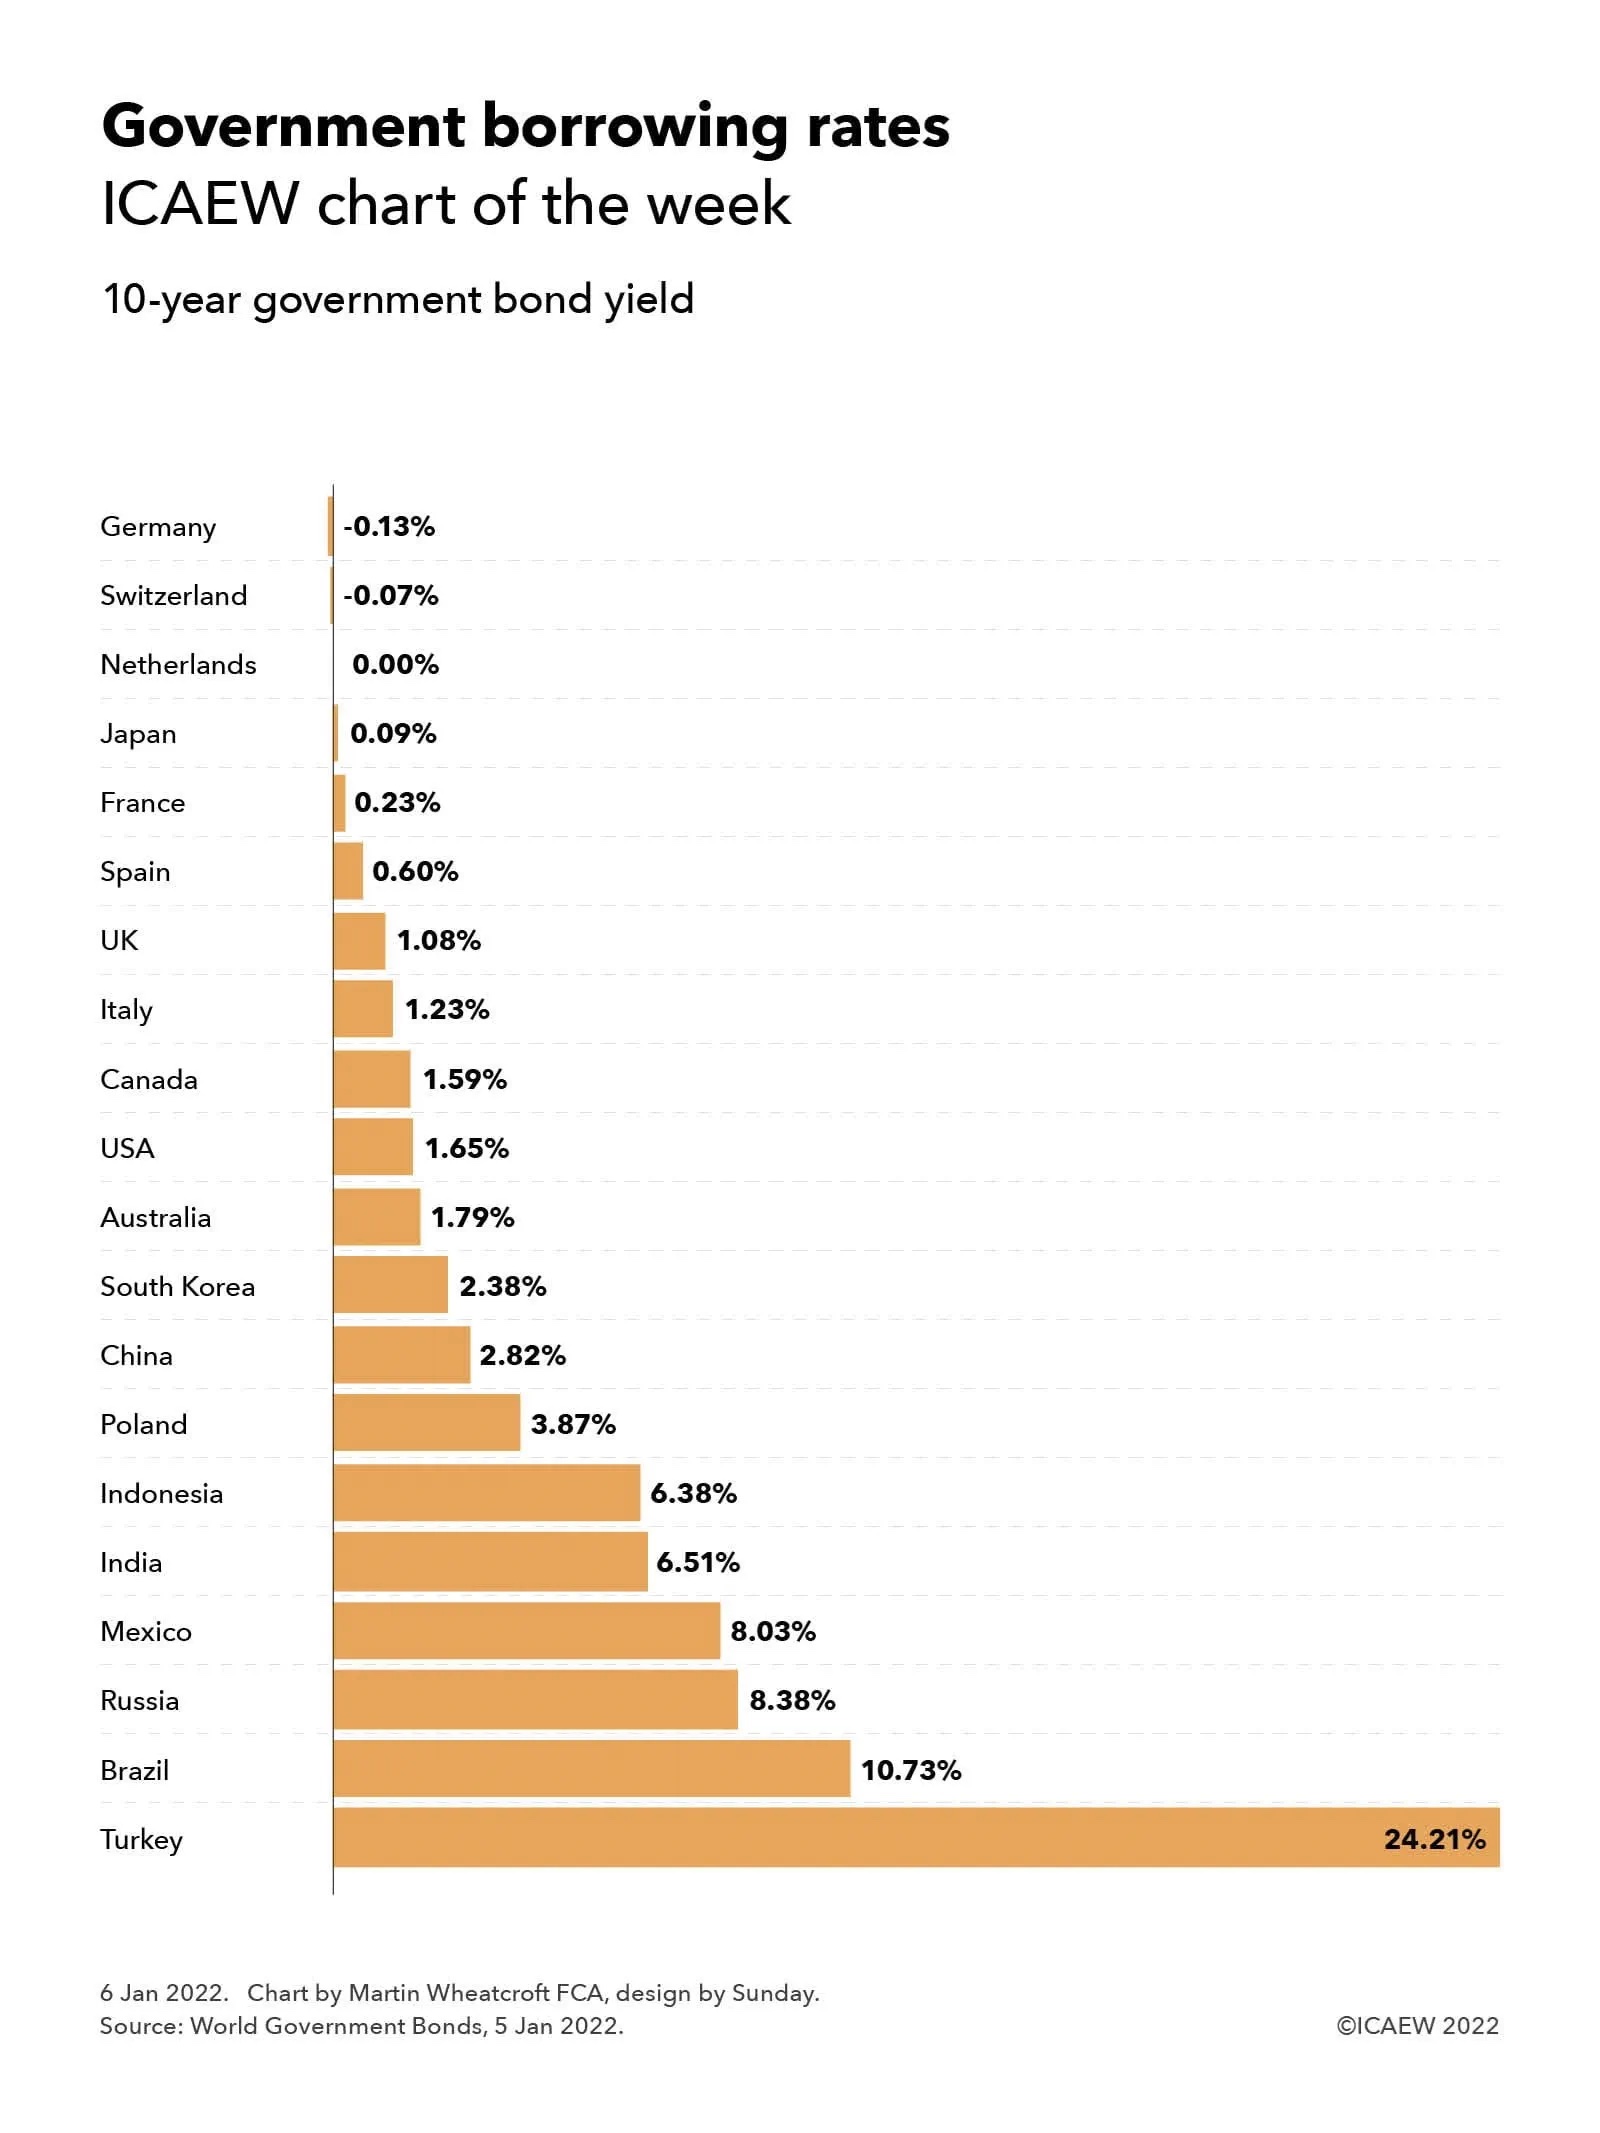
Our first chart of 2022 highlights how the cost of government borrowing remains extremely low for most of the 21 largest economies in the world, despite the huge expansion in public debt driven by the pandemic.
Our chart of the week illustrates how borrowing costs are still at historically low rates for most of the 21 largest national economies in the world, with negative yields on 10-year government bonds on 5 January 2022 for Germany (-0.13%) and Switzerland (-0.07%), approximately zero for the Netherlands, and yields of sub-2.5% for Japan (0.09%), France (0.23%), Spain (0.60%), the UK (1.08%), Italy (1.23%), Canada (1.59%), the USA (1.65%), Australia (1.79%) and South Korea (2.38%).
This is despite the trillions added to public debt burdens across the world over the past couple of years as a consequence of the pandemic, including the $5trn added to US government debt since March 2020 (up from $17.6trn to $22.6trn owed to external parties) and the more than £500bn borrowed by the UK government (public sector net debt up from £1.8trn to £2.3trn) for example.
Yields in developing economies are higher, although China (2.82%) and Poland (3.87%) can borrow at much lower rates than Indonesia (6.38%), India (6.51%), Mexico (8.03%), Russia (8.37%) and Brazil (10.73%). The outlier is Turkey (24.21%), which is experiencing some difficult economic conditions at the moment. Data was not available for Saudi Arabia, the 19th or 20th largest economy in the world, which has net cash reserves.
With inflation higher than it has been for several years, real borrowing rates are negative for most developed countries, meaning that in theory it would make sense for most countries to continue to borrow as much as they can while funding is so cheap. However, in practice fiscal discipline appears to be reasserting itself, with Germany, for example, planning on returning to a fully balanced budget by the start of next year and the UK targeting a current budget surplus within three years.
For many policymakers, the concern is not so much about how easy it is to borrow today, but the prospect of higher interest rates multiplied by much higher levels of debt eating into spending budgets just as they are looking to invest to grow their economies over the rest of the decade. Despite that, with the pandemic still raging and an emerging cost of living crisis, there may well be a temptation to borrow ‘just one more time’ to support struggling households over what is likely to be a difficult start to 2022.
While November’s deficit of £17.4bn is in line with expectations, public sector net debt is up by more than half a trillion pounds since the start of the pandemic and as a proportion of GDP, debt is the highest it has been since March 1963.
The public sector finances for November 2021 released on Tuesday 21 December reported a monthly deficit of £17.4bn – £4.8bn lower than the £22.2bn reported for November 2020 but £11.8bn higher than the £5.6bn deficit reported for November 2019.
This brings the cumulative deficit for the first eight months of the financial year to £136.0bn compared with £251.7bn and £52.5bn for the same period last year and the year before that respectively.
Public sector net debt increased from £2,283.0bn at the end of October to £2,317.7bn or 96.1% of GDP at the end of November. This is £183.3bn higher than at the start of the financial year and an increase of £524.6bn over March 2020. As a proportion of GDP, debt is the highest it has been since March 1963, almost 60 years ago.
The increase in public sector net debt of £34.7bn in the month reflects borrowing to finance the deficit of £17.4bn and £26.9bn in the final tranche of the Bank of England’s Term Funding Scheme, offset by repayments in coronavirus lending as well as other net movements.
As in previous months this financial year, the deficit came in below the forecast for 2021-22 prepared by the Office for Budget Responsibility (OBR) in March 2021 but was in line with the OBR’s revised forecast issued in October 2021 alongside the Autumn Budget and Spending Review 2021.
Cumulative receipts in the first eight months of the 2021-22 financial year amounted to £560.7bn, £71.4bn or 15% higher than a year previously, but only £31.2bn or 6% above the level seen a year before that in 2019-20. At the same time cumulative expenditure excluding interest of £622.7bn was £44.4bn or 7% lower than the first eight months of 2020-21, but £102.1bn or 20% higher than the same period two years ago.
Interest amounted to £44.2bn in the eight months to October 2021, £14.6bn or 49% higher than the same period in 2020-21, principally because of higher inflation affecting index-linked gilts. Despite debt being 29% higher than two years ago, interest costs were only £5.0bn or 13% more than the equivalent eight months ended 30 November 2019.
Cumulative net public sector investment in the eight months to November 2021 was £29.8bn. This was £14.5bn less than the £44.3bn reported for the first eight months of last year, which included around £17bn or so of coronavirus lending that is not expected to be recovered. Investment was £7.6bn or 34% more than two years ago, principally reflecting a higher level of capital expenditure, in particular on investment in HS2.
Debt increased by £183.3bn since the start of the financial year, £47.3bn more than the deficit. This reflects funding to cover outflows on lending, including to banks through the Term Funding Scheme, lending to businesses through the British Business Bank, and student loans, offset by the receipt of taxes deferred last year and the repayment of coronavirus loans taken out during the pandemic.
Commenting on the figures Alison Ring, ICAEW Public Sector and Taxation Director, said: “While the numbers for November are in line with expectations, it’s notable that debt has risen both in cash terms and as a proportion of GDP, and at 96.1% is the highest it has been for almost 60 years. The monthly deficit of £17.4bn is below the peaks of last year but still substantially above the pre-pandemic position.
“Despite the rise in interest rates earlier this month, the Chancellor is still able to take advantage of historically-low borrowing costs if he wants to provide support to businesses adversely affected by the Omicron variant and prevent further scarring to the economy. His concern will be how to do so without stoking inflation, which is expected to head even higher over the next few months.”
Caution is needed with respect to the numbers published by the ONS, which are expected to be repeatedly revised as estimates are refined and gaps in the underlying data are filled.
The ONS made a number of revisions to prior month and prior year fiscal numbers to reflect revisions to estimates. These had the effect of decreasing the reported fiscal deficit for the seven months to October 2021 from £127.3bn to £118.6bn and the deficit for the year ended 31 March 2021 from £323.1bn to £321.9bn.
My chart this week is on Bounce Back Loans, one of the principal sources of financial support for businesses during the first year of the pandemic and the subject of a recent investigation by the National Audit Office.
The recent publication of the Department for Business, Energy & Industrial Strategy (BEIS) accounts for 2020-21 contained an assessment of the losses expected on the financial provided to businesses through the Bounce Back Loan Scheme (BBLS), the Coronavirus Business Interruption Loan Scheme (CBILS), the Coronavirus Large Business Interruption Loan Scheme (CLBILS) and the Future Fund. This was followed by an updated report from the National Audit Office (NAO) on the administration of the scheme and the potential losses to the taxpayers.
The largest of these schemes was BBLS, with Bounce Back Loans of up to £50,000 provided to eligible businesses to help them weather the first lockdown in the second quarter of 2020, before being extended to the whole of the 2020-21 financial year. In the end, around a quarter of businesses took out a Bounce Back Loan, comprising 1.5m loans for a total of £47bn at an interest rate of 2.5% repayable over six years. The interest in the first year was covered by the government, with no repayments due in that period.
Businesses can extend the loans to ten years through the Pay As Your Grow option, as well as being allowed up to one six month payment holiday and three interest-only payments to provide flexibility without going into default.
The seven main UK banks provided around 90% of the loans by value, with the rest provided by other banks and non-bank lenders, such as peer-to-peer lenders. Each participating financial institution was provided with a 100% guarantee by the government to cover any amounts not repaid. Half a million or nearly 35% of the loans were for the maximum amount of £50,000 (adding up to £27bn) with £18bn lent out between £10,000 and £50,000 and £2bn lent for amounts between £2,000 (the minimum possible) and £10,000.
As the chart illustrates, the geographical distribution of loans was weighted towards the south and centre of England, with £11bn borrowed by businesses in London, £10bn in the South (£6.5bn South East and £3.6bn South West) and £11bn in the Midlands & East (£3.8bn West Midlands, £2.9bn East Midlands and £4.5bn East of England), a total of £32bn. The balance of £15bn was split between £9bn in the North (£3.2bn Yorkshire & the Humber, £4.8bn North West and £1.3bn North East) and £6bn in the other nations of the UK (£2.7bn Scotland, £1.6bn Wales and £1.3bn Northern Ireland).
More than 90% of the loans, amounting to £40bn, went to micro-businesses, ie businesses with turnover below £632,000.
BEIS have estimated in their 2020-21 financial statements that they do not expect 37% of the loans with a value of £17bn to be repaid, comprising £12bn in estimated bad debts and £5bn in estimated losses from fraud, although the NAO says that these numbers are highly uncertain at this stage. With £2bn already repaid, this leaves £28bn believed to be recoverable over the remainder of the six years of the loans (or 10 years for those that are extended).
The fraud estimate, for 11% of the loans with a value of £4.9bn, was based on a sample of 1,067 loans as at 31 March 2021, but a subsequent analysis in October 2021 suggests that the level of fraud may be lower at around 7.5% of loans and so there is some hope that BEIS and the British Business Bank will be able to reduce the amount they will have to reimburse to participating banks under the 100% guarantees.
However, as the NAO reports, these guarantees mean participating banks have no financial incentive to chase repayment and it has raised concerns that insufficient resources are being dedicated by BEIS and the British Business Bank to recovering outstanding amounts.
The challenge for government is that many businesses have not been able to get back to their pre-pandemic level of operation and so there is a need to be sensitive, whilst at the same time seeking to protect public money and tackle those who made fraudulent claims.