My chart for ICAEW this week looks at how a large upward revision in GDP for 2024/25 translates into a relatively modest 0.1 percentage point increase in economic growth per year since the pandemic.
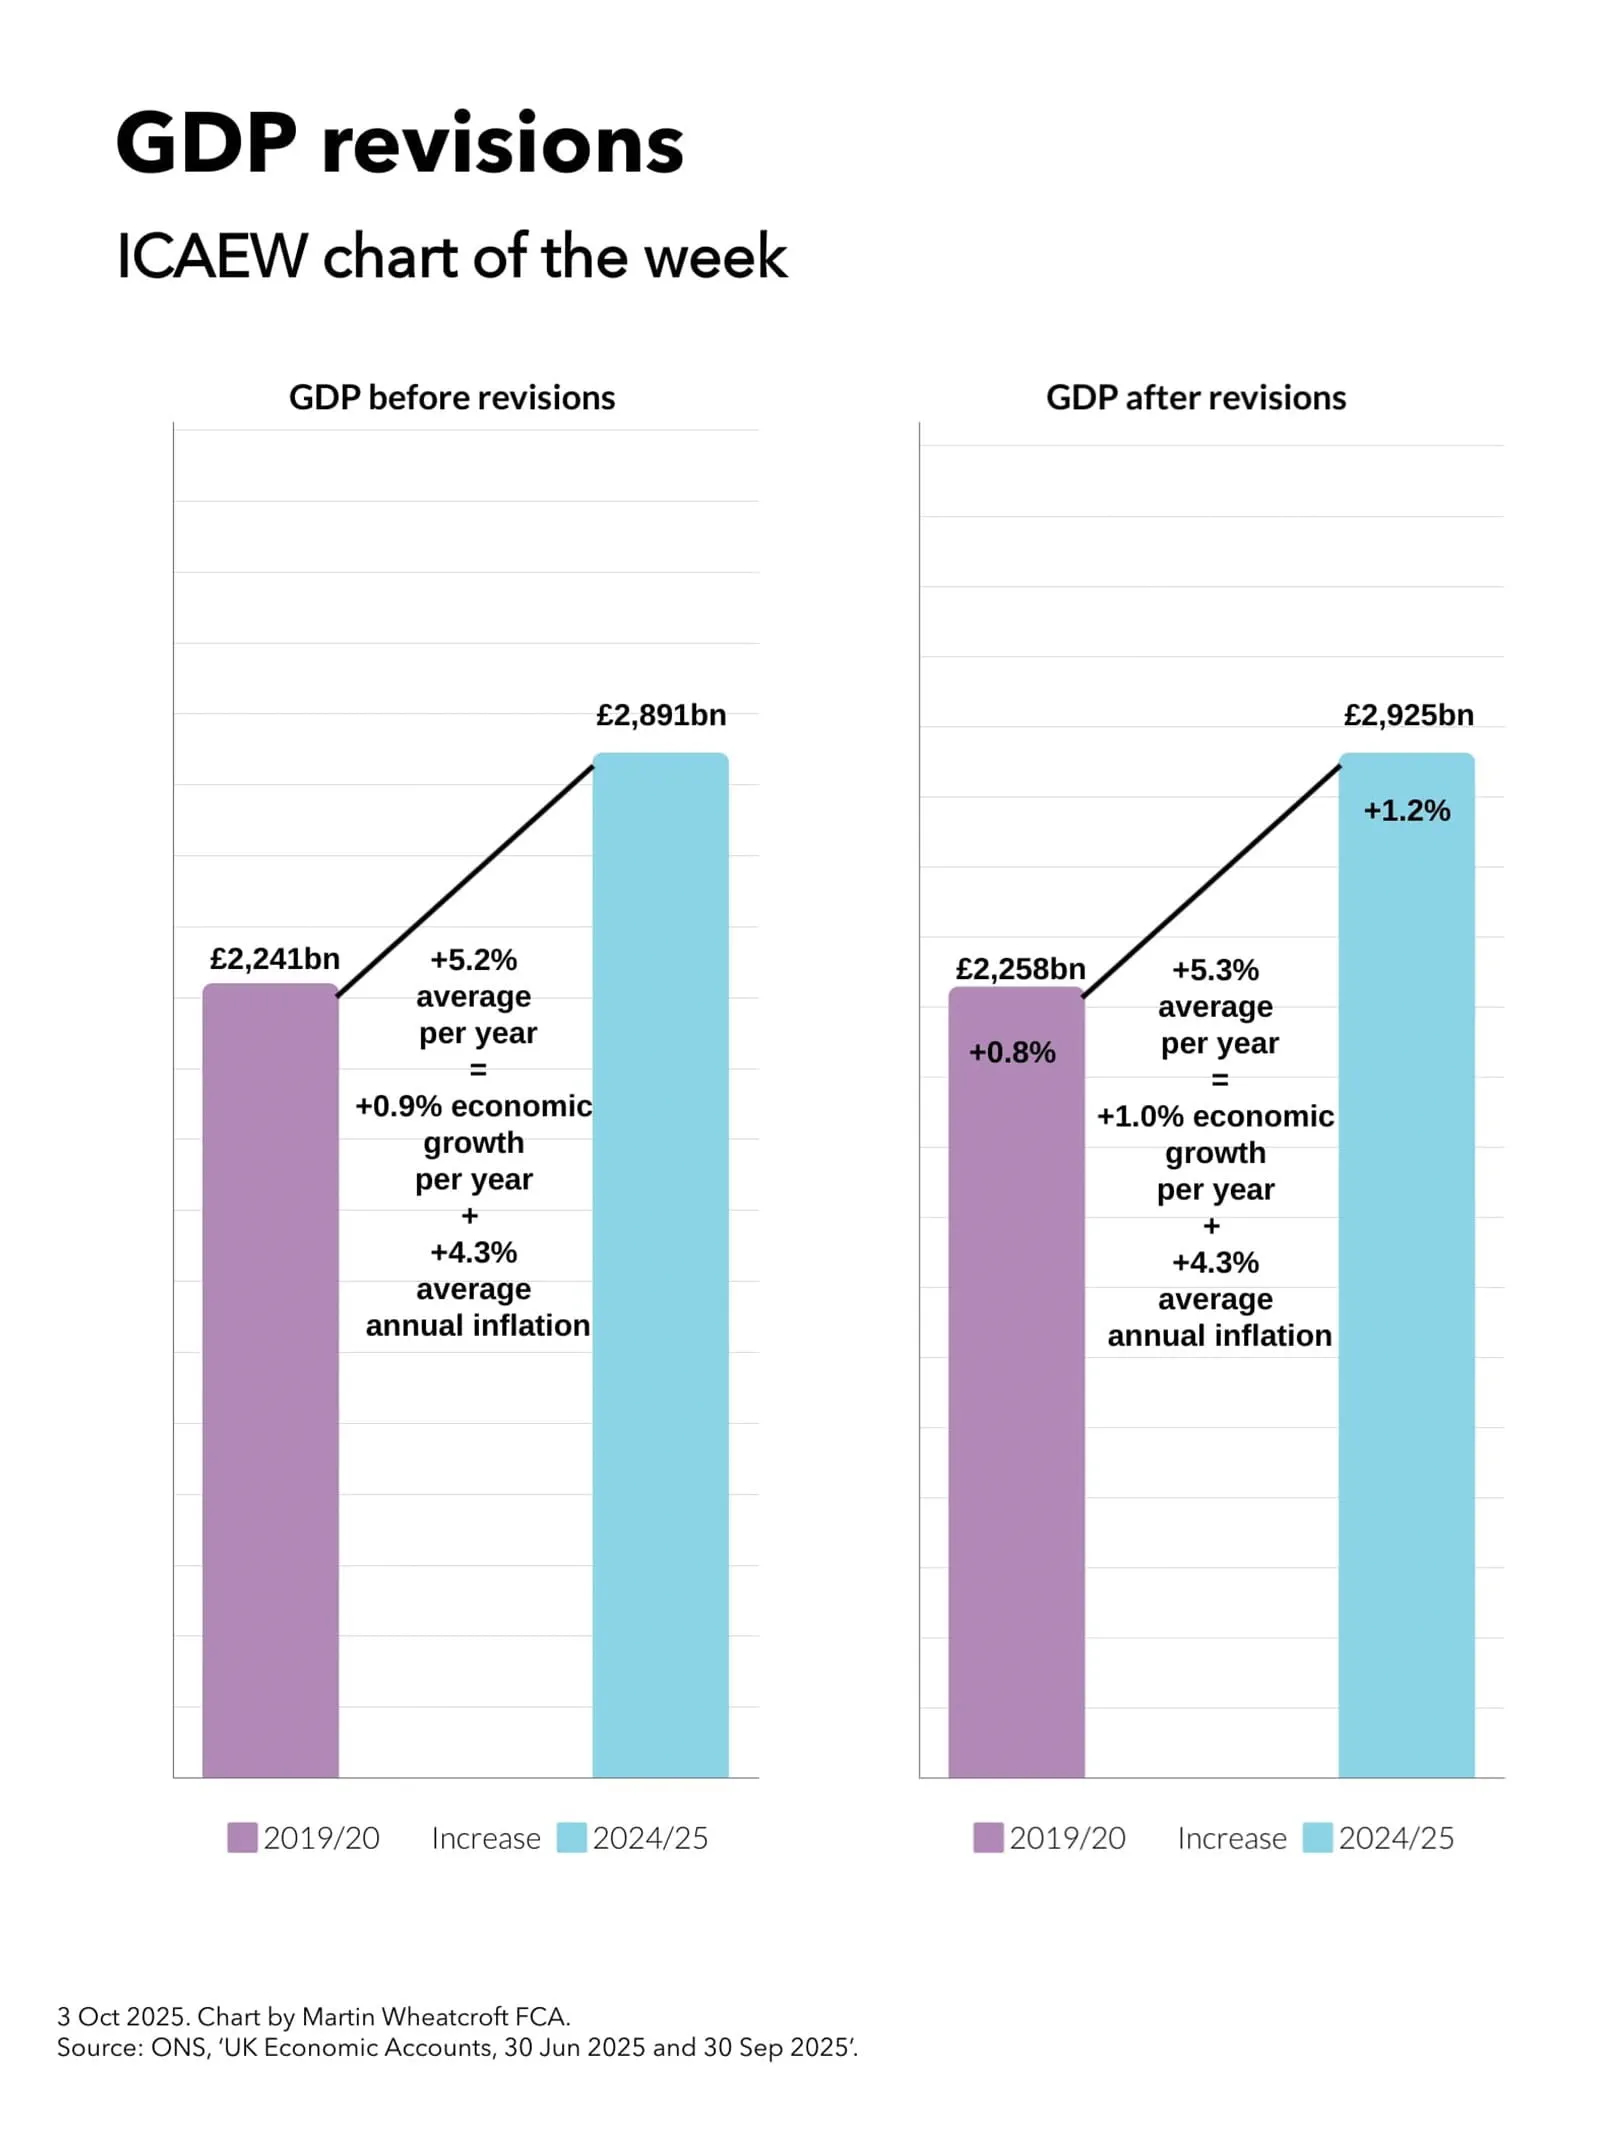
On 30 September, the Office for National Statistics (ONS) published its latest quarterly GDP statistics for April to June 2025. The headline pointed to a slowdown in quarterly economic growth to 0.3% over that period, down from 0.7% growth in the first quarter of the year. However, more significant was a large revision that increased reported GDP for the year to March 2025 (2024/25) by 1.2%, taking it from £2,891bn to £2,925bn.
The ONS also revised GDP for previous years, including a 0.8% upward revision in reported GDP for 2019/20 from £2,241bn to £2,258bn.
My chart for ICAEW this week illustrates how this resulted in the increase in GDP over the five years to 2024/25, going from an average of 5.2% a year in GDP before revisions, to 5.3% a year after revisions. As inflation is similar before and after the revisions (at an average of 4.3% per year), this means that average annual real economic growth over the past five years has been revised up by 0.1 percentage points from 0.9% a year to 1.0% a year.
While the effect on economic growth over the past five years has been relatively modest, it will knock off at least a percentage point from the public sector net debt to GDP ratio – all without the Chancellor needing to lift a finger.
The statistical revisions reflect the typical process of updating historical numbers for more recent data, such as corporation tax returns that reported higher corporate profits than originally estimated and higher estimates of educational output, business inflation and output of pharmaceutical companies. However, the largest revision was a methodology change that increased the estimate of investment in research and development by approximately 1 percentage point of GDP, bringing the UK more in line with comparable countries in the developed world.
Unfortunately, even with this statistical boost to research and development, the UK still underperforms compared with the US, where economic growth since before the pandemic has been more than twice as fast, as well as lagging (albeit slightly) behind the Eurozone.
ICAEW’s business growth campaign has identified how it has become increasingly too uncertain, too difficult and too expensive to do business in the UK and calls for fundamental reform of tax, regulation and economic policy to support stronger business growth going forward.
Read more in ICAEW’s recommendations on how we can tackle the barriers to improving productivity in our business growth campaign.
Borrowing to fund the deficit in the first four months of the financial year of £60bn was in line with expectations.
The monthly public sector finances release for July 2025 published by the Office for National Statistics (ONS) on 21 August reported a provisional shortfall between receipts and total public spending of £60bn for the four months ended 31 July 2025. This is in line with budget and £7bn more than in the same period last year.
Martin Wheatcroft, External Adviser on Public Finances to ICAEW, says: “This month’s ‘not bad’ result may provide a small amount of relief to a Chancellor under significant pressure.
“The monthly deficit for July was slightly better than expected, while the cumulative result for the first third of the financial year was almost exactly in line with the Office for Budget Responsibility’s prediction at the time of the Spring Statement 2025.
“Unfortunately, this does not change the dismal outlook for the public finances and the rising costs of public services, welfare provision and debt interest that means the Chancellor is again having to work out how she can ask Parliament to authorise higher levels of taxation.”
Month of July 2025
Receipts of £108.8bn in July 2025 were £9.2bn or 9% higher than in July 2024 and also higher than the £92.6bn average for the first three months of the financial year, principally as a result of a boost from income tax self-assessment collections in the month.
Meanwhile, current spending including depreciation of £105.5bn in July was £6.0bn or 6% more than in the same month a year previously. This was slightly lower than the £108.0bn monthly average incurred during April to June 2025.
The result was a current budget surplus for the month of £3.3bn, a £3.2bn improvement over the current budget surplus of £0.1bn in the same month last year.
Net investment of £4.4bn in July 2025 was £0.9bn more than the £3.5bn incurred in July 2024 and slightly higher than the £4.2bn average incurred during the three months to June 2025.
The provisional fiscal deficit for July 2025 was therefore £1.1bn, £1.0bn less than the £2.1bn budget for the month and a £2.3bn improvement over the £3.4bn deficit in July 2024.
Four months to July 2025
Table 1 highlights how year-to-date receipts of £387bn were up 7% on last year’s equivalents, with income tax receipts up 8% from a combination of inflation and fiscal drag from frozen tax allowances, and national insurance receipts up 19% as a consequence of the increase in employer national insurance that was implemented in April 2025.
Meanwhile, the 8% increase over last year in current spending including depreciation to £430bn in the first four months to July 2025 was primarily as a consequence of public sector pay rises, higher supplier costs, and the uprating of welfare benefits.
This included a £6bn or 13% increase in debt interest to £53bn, which comprised a £5bn increase in indexation on inflation-linked debt as inflation resurged and a £1bn increase in interest on variable and fixed-interest debt. The latter was primarily the result of a higher level of debt compared with a year ago partially offset by a lower Bank of England base rate.
The resulting current budget deficit of £43bn to July 2025 was 16% higher than for the same four months last year.
Net investment of £17bn in the first four months of 2025/26 was £1bn or 6% higher than the same period last year. Capital expenditure of £30bn was up by £1bn and capital transfers (capital grants, research and development funding, and student loan write-offs) of £11bn were up by £2bn, less depreciation of £24bn that was up by £2bn compared with the same four month period a year prior.
The consequence is a provisional deficit for the first third of the 2025/26 financial year of £60bn, which is £7bn or 13% more than in the same four month period last year. Despite being almost exactly in line with budget (only £0.1bn higher) this is the third-highest April-to-July deficit since monthly records began in 1993 (after 2020/21 and 2021/22 during the pandemic).
Table 1: Summary receipts and spending
4 months to July
2025/26 £bn
2024/25 £bn
Change %
Income tax
100
93
+8%
VAT
70
67
+4%
National insurance
64
54
+19%
Corporation tax
35
32
+9%
Other taxes
76
74
+3%
Other receipts
42
41
+2%
Current receipts
387
361
+7%
Public services
(239)
(221)
+8%
Welfare
(103)
(97)
+6%
Subsidies
(11)
(11)
–
Debt interest
(53)
(47)
+13%
Depreciation
(24)
(22)
+9%
Current spending
(430)
(398)
+8%
Current deficit
(43)
(37)
+16%
Net investment
(17)
(16)
+6%
Deficit
(60)
(53)
+13%
Borrowing and debt
Table 2 summarises how the government borrowed £81bn in the first third of the financial year to take public sector net debt to a provisional £2,891bn on 31 July 2025. This comprised £60bn in public sector net borrowing (PSNB) to fund the deficit and £21bn to fund government lending activities and working capital movements.
The table also illustrates how the debt to GDP ratio increased from 94.8% of GDP at the start of the financial year to 96.1% on 31 July 2025, with the incremental borrowing partly offset by the ‘inflating away’ effect of inflation and economic growth adding to GDP, the denominator in the net debt to GDP ratio.
Table 2: Public sector net debt and net debt/GDP
4 months to July
2025/26 £bn
2024/25 £bn
PSNB
60
53
Other borrowing
21
(1)
Net change
81
52
Opening net debt
2,810
2,686
Closing net debt
2,891
2,738
PSNB/GDP
2.1%
1.9%
Other/GDP
0.7%
–
Inflating away
(1.5%)
(1.9%)
Net change
1.3%
–
Opening net debt/GDP
94.8%
95.6%
Closing net debt/GDP
96.1%
95.6%
Public sector net debt on 31 July 2025 of £2,891bn comprised gross debt of £3,309bn less cash and other liquid financial assets of £418bn.
Public sector net financial liabilities were £2,525bn, comprising net debt of £2,891bn plus other financial liabilities of £707bn less illiquid financial assets of £1,073bn. Public sector negative net worth was £899bn, being net financial liabilities of £2,525bn less non-financial assets of £1,626bn.
Revisions
Caution is needed with respect to the numbers published by the ONS, which are repeatedly revised as estimates are refined and gaps in the underlying data are filled. This includes local government, where the numbers are only updated in arrears and are based on budget or high-level estimates in the absence of monthly data collection.
The latest release saw the ONS revise the previously reported deficit for the three months to June 2025 up by £1bn. The ONS also revised up its estimate of GDP in the first quarter of the financial year, resulting in a 0.4 reduction in the opening debt to GDP ratio on 1 April 2025 from 95.2% to 94.8% and the debt to GDP ratio for 30 June 2025 from 96.2% to 95.8%.
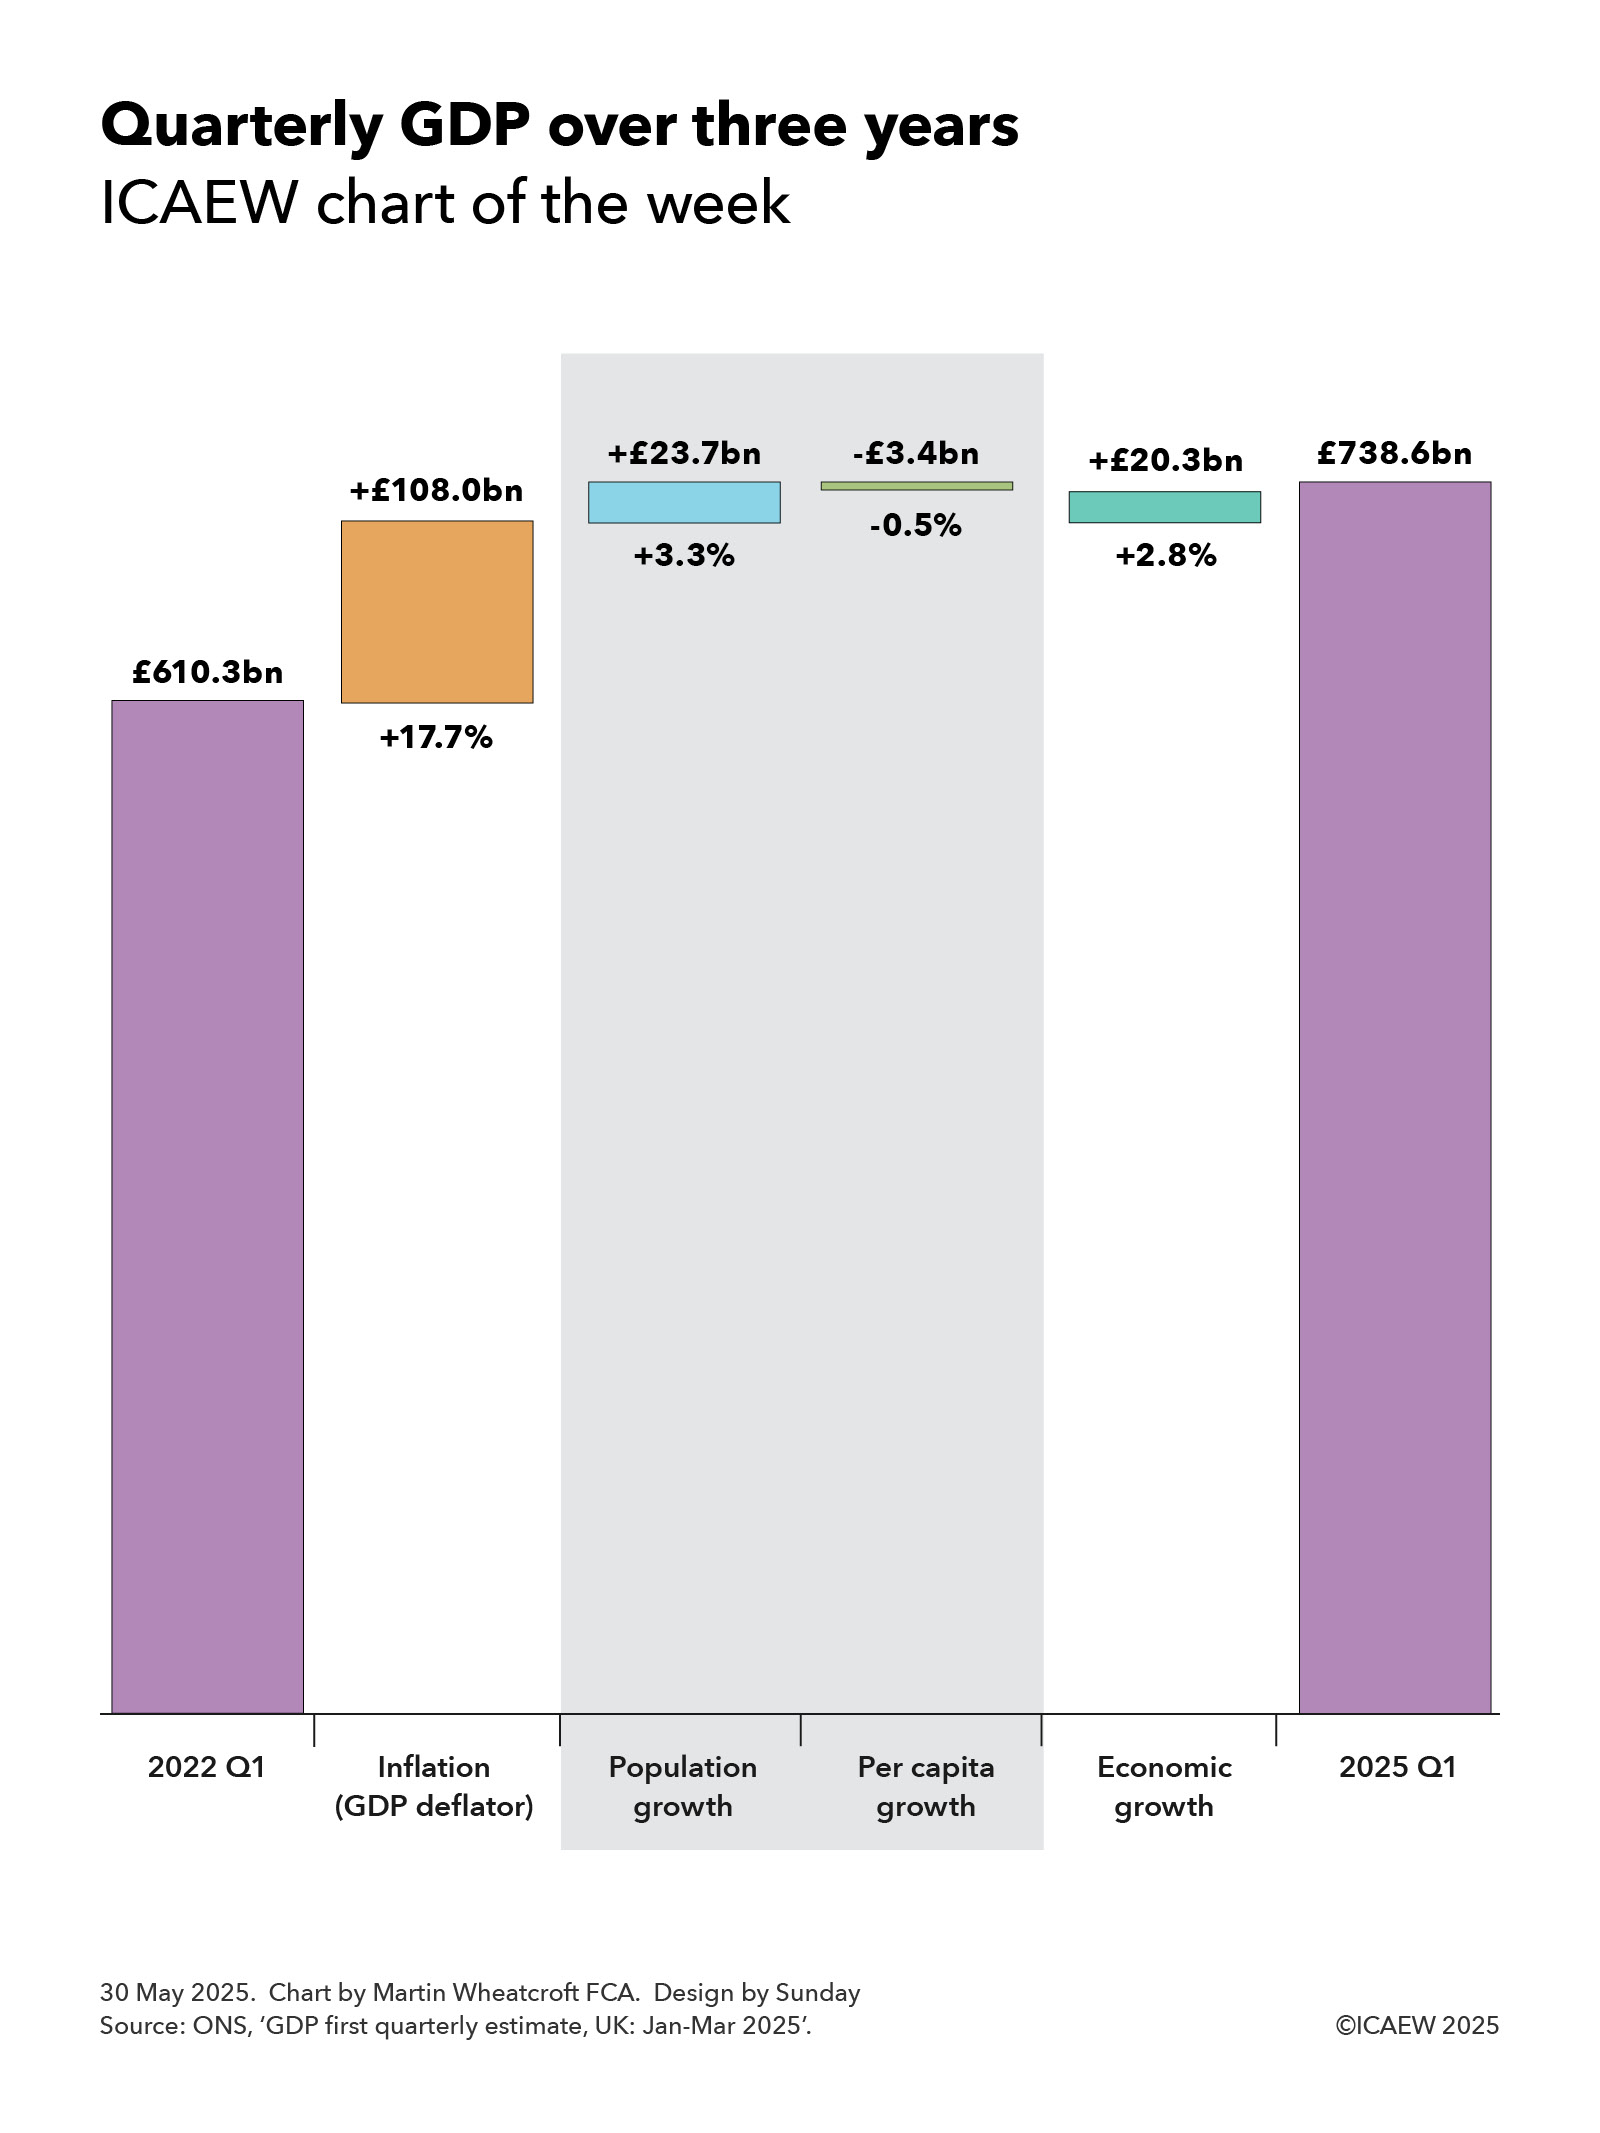
Our chart this week looks at how quarterly GDP has risen from £610.3bn in the first quarter of 2022 to £738.6bn in the first quarter of 2025.
According to the Office for National Statistics (ONS), GDP was £738.6bn in the quarter from January to March 2025, £128.3bn or 21.0% higher than the £610.3bn reported for the same quarter three years ago.
Our chart of the week illustrates how quarterly GDP was £108.0bn or +17.7% higher in the first quarter of 2025 compared with the same quarter in 2022 as a result of inflation (using the GDP deflator measure) while economic growth contributed a further £20.3bn or +2.8%.
The chart also breaks down economic growth over the past three years between a contribution from there being more people of £23.7bn or +3.3% and a decline in economic activity per person of £3.4bn or -0.5%.
Not shown on the chart are the changes by year, which comprised annual inflation of +8.2%, +4.1% and +4.5% and annual economic growth of +0.8%, +0.7% and +1.3% in 2022/23, 2023/24 and 2024/25 respectively, with the latter split between annual population growth of +1.2%, +1.1% and +1.0%, and annual per capita economic growth of -0.4%, -0.4% and +0.3%.
Also not shown in the chart is economic growth over the last four quarters, which was +0.5%, +0.0%, +0.1% and +0.7% between the first and second quarters of 2024, the second and third quarters, the third and fourth quarters, and the fourth quarter of 2024 and the first quarter of 2025 respectively. These comprised quarterly population growth of +0.3%, +0.2%, +0.2% and +0.2% and quarterly per capita economic growth of +0.2%, -0.2%, -0.1% and +0.5%.
Lower levels of net inward migration are expected to reduce the rate of population growth over the next three years to closer to 0.5% a year, which means that growing the economy faster than inflation will depend on our ability to improve productivity and hence increase real economic activity per person.
In theory, that should be eminently possible given how per capita economic growth averaged 2.4% per year for the 50 years before the financial crisis. Unfortunately, with per capita growth averaging just 0.6% a year over the past decade, productivity will need to increase significantly if we are to turn the situation around over the coming decade.
The good news is that a 21% increase in GDP means tax receipts should be that much higher. The bad news is that public spending has been going up, too.
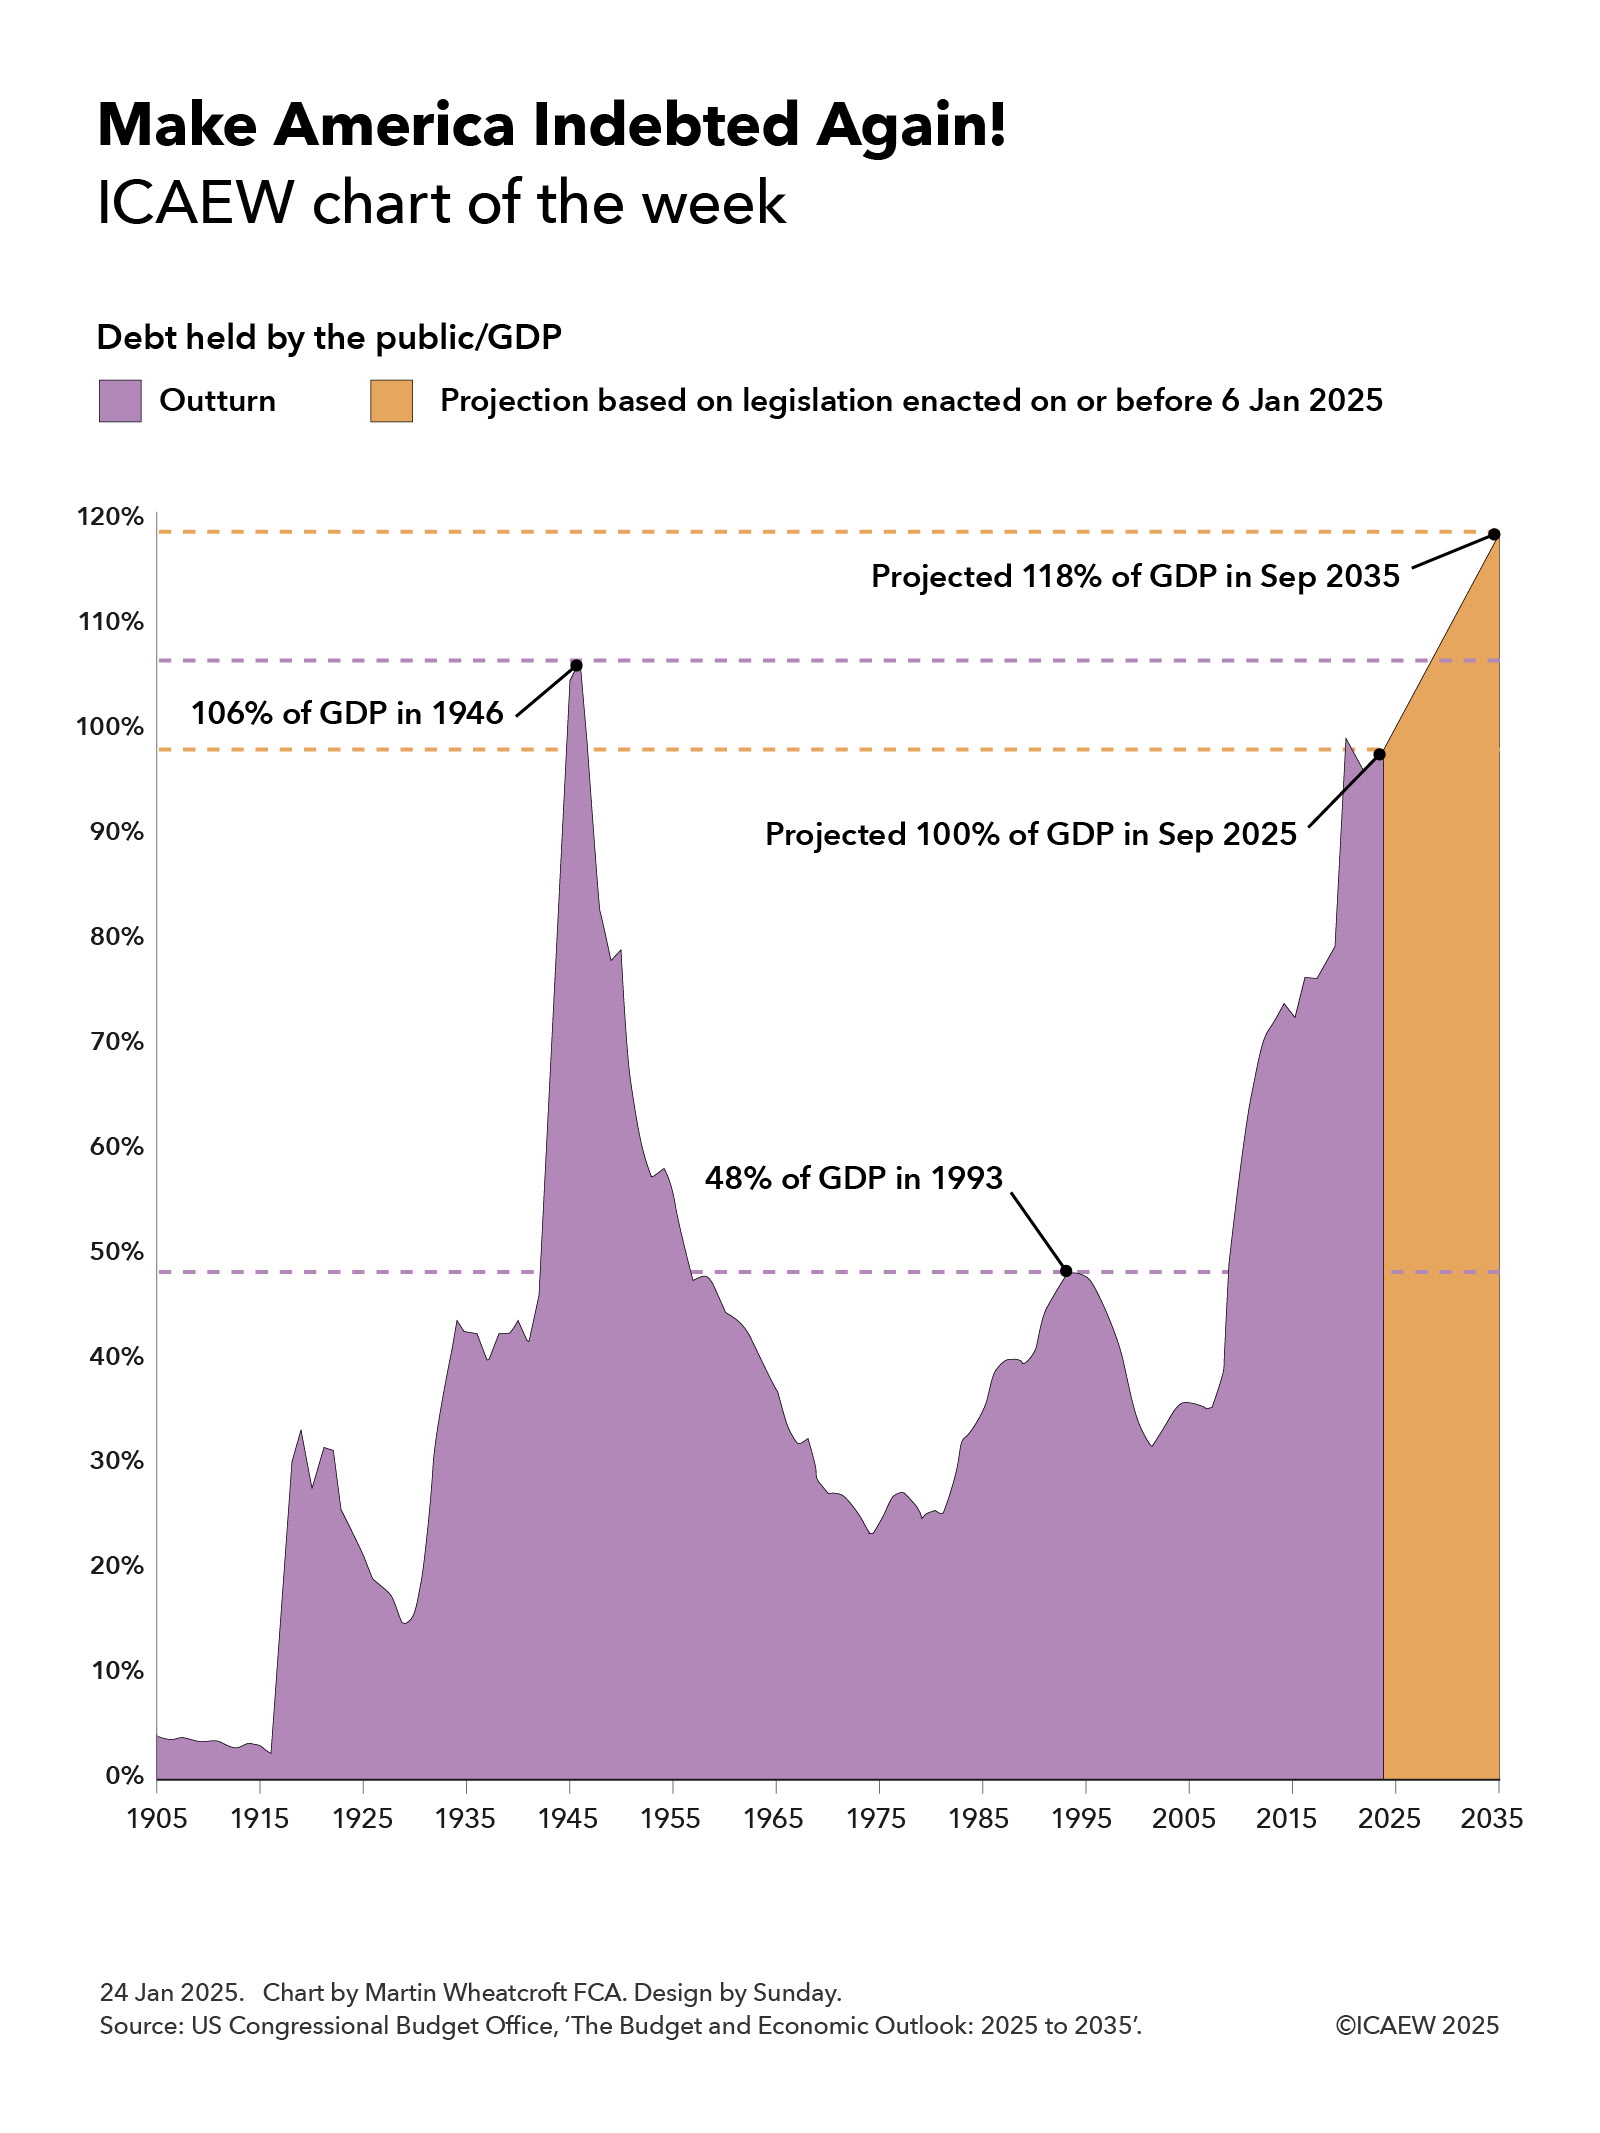
My chart for ICAEW this week looks at official projections, published three days before President Trump was inaugurated for the second time, that predict federal debt is on track to return to and exceed levels last seen in the 1940s.
The US Congressional Budget Office (CBO) published its latest 10-year projections for the US federal government finances on 17 January 2025, covering the decade from 2025 to 2035. These projections are based on legislation enacted up to 6 January 2025, prior to the start of President Trump’s second term as President on 20 January 2025.
As the chart of the week illustrates, debt held by the public in relation to the size of the economy was 4% of GDP in 1905, falling to 3% in 1916 before rising to 33% of GDP as a result of the US entering the First World War. Debt/GDP fell over the subsequent decade to 15% of GDP in 1929 before rising again during the Great Depression to 42% of GDP in 1936. A drop to 40% in 1937 was then followed by a rise to 106% of GDP in 1946 following the end of the Second World War.
A rapidly growing economy over the next quarter of a century or so saw debt inflated away despite a major expansion in the size of the federal government over that period, with debt/GDP falling to 23% in 1974. More difficult economic times in the 1970s and 1980s and continued governmental expansion saw debt/GDP rise to 48% in 1993, before a growing economy again eroded debt as a share of GDP to down to 35% in 2007.
Debt rose rapidly during the financial crisis and subsequently, to reach 79% of GDP by 2019, before the pandemic drove it up further to 99% in September 2020. The post-pandemic economic recovery saw debt falling back to 95% of GDP in September 2022, but since then continued deficit spending since then has seen debt held by the public/GDP rise to 98% last year on its way to a projected 100% of GDP in September 2025.
The CBO predicts that debt held by the public will increase from $28.2tn at the end of September 2024 to $30.1bn in September 2025 and then to $52.1tn in September 2035, equivalent 118% of GDP. This assumes economic growth of 1.8% a year over the ten years to 2035 and is based on extrapolating from approved budgets and legislation in place as of 6 January 2025.
The big question is how that projected path will change as a result of the incoming Trump administration. His plan to cut taxes (pushing up the level of borrowing further) and to cut federal spending (offsetting some of that increase) will have a direct fiscal impact, but the indirect effects his policies have on the US economy will also be very important. Faster growth would have the effect of slowing the rise in the debt/GDP ratio or even bringing it down, while slower growth could shorten the time it takes to make America as indebted as it was back in 1946.
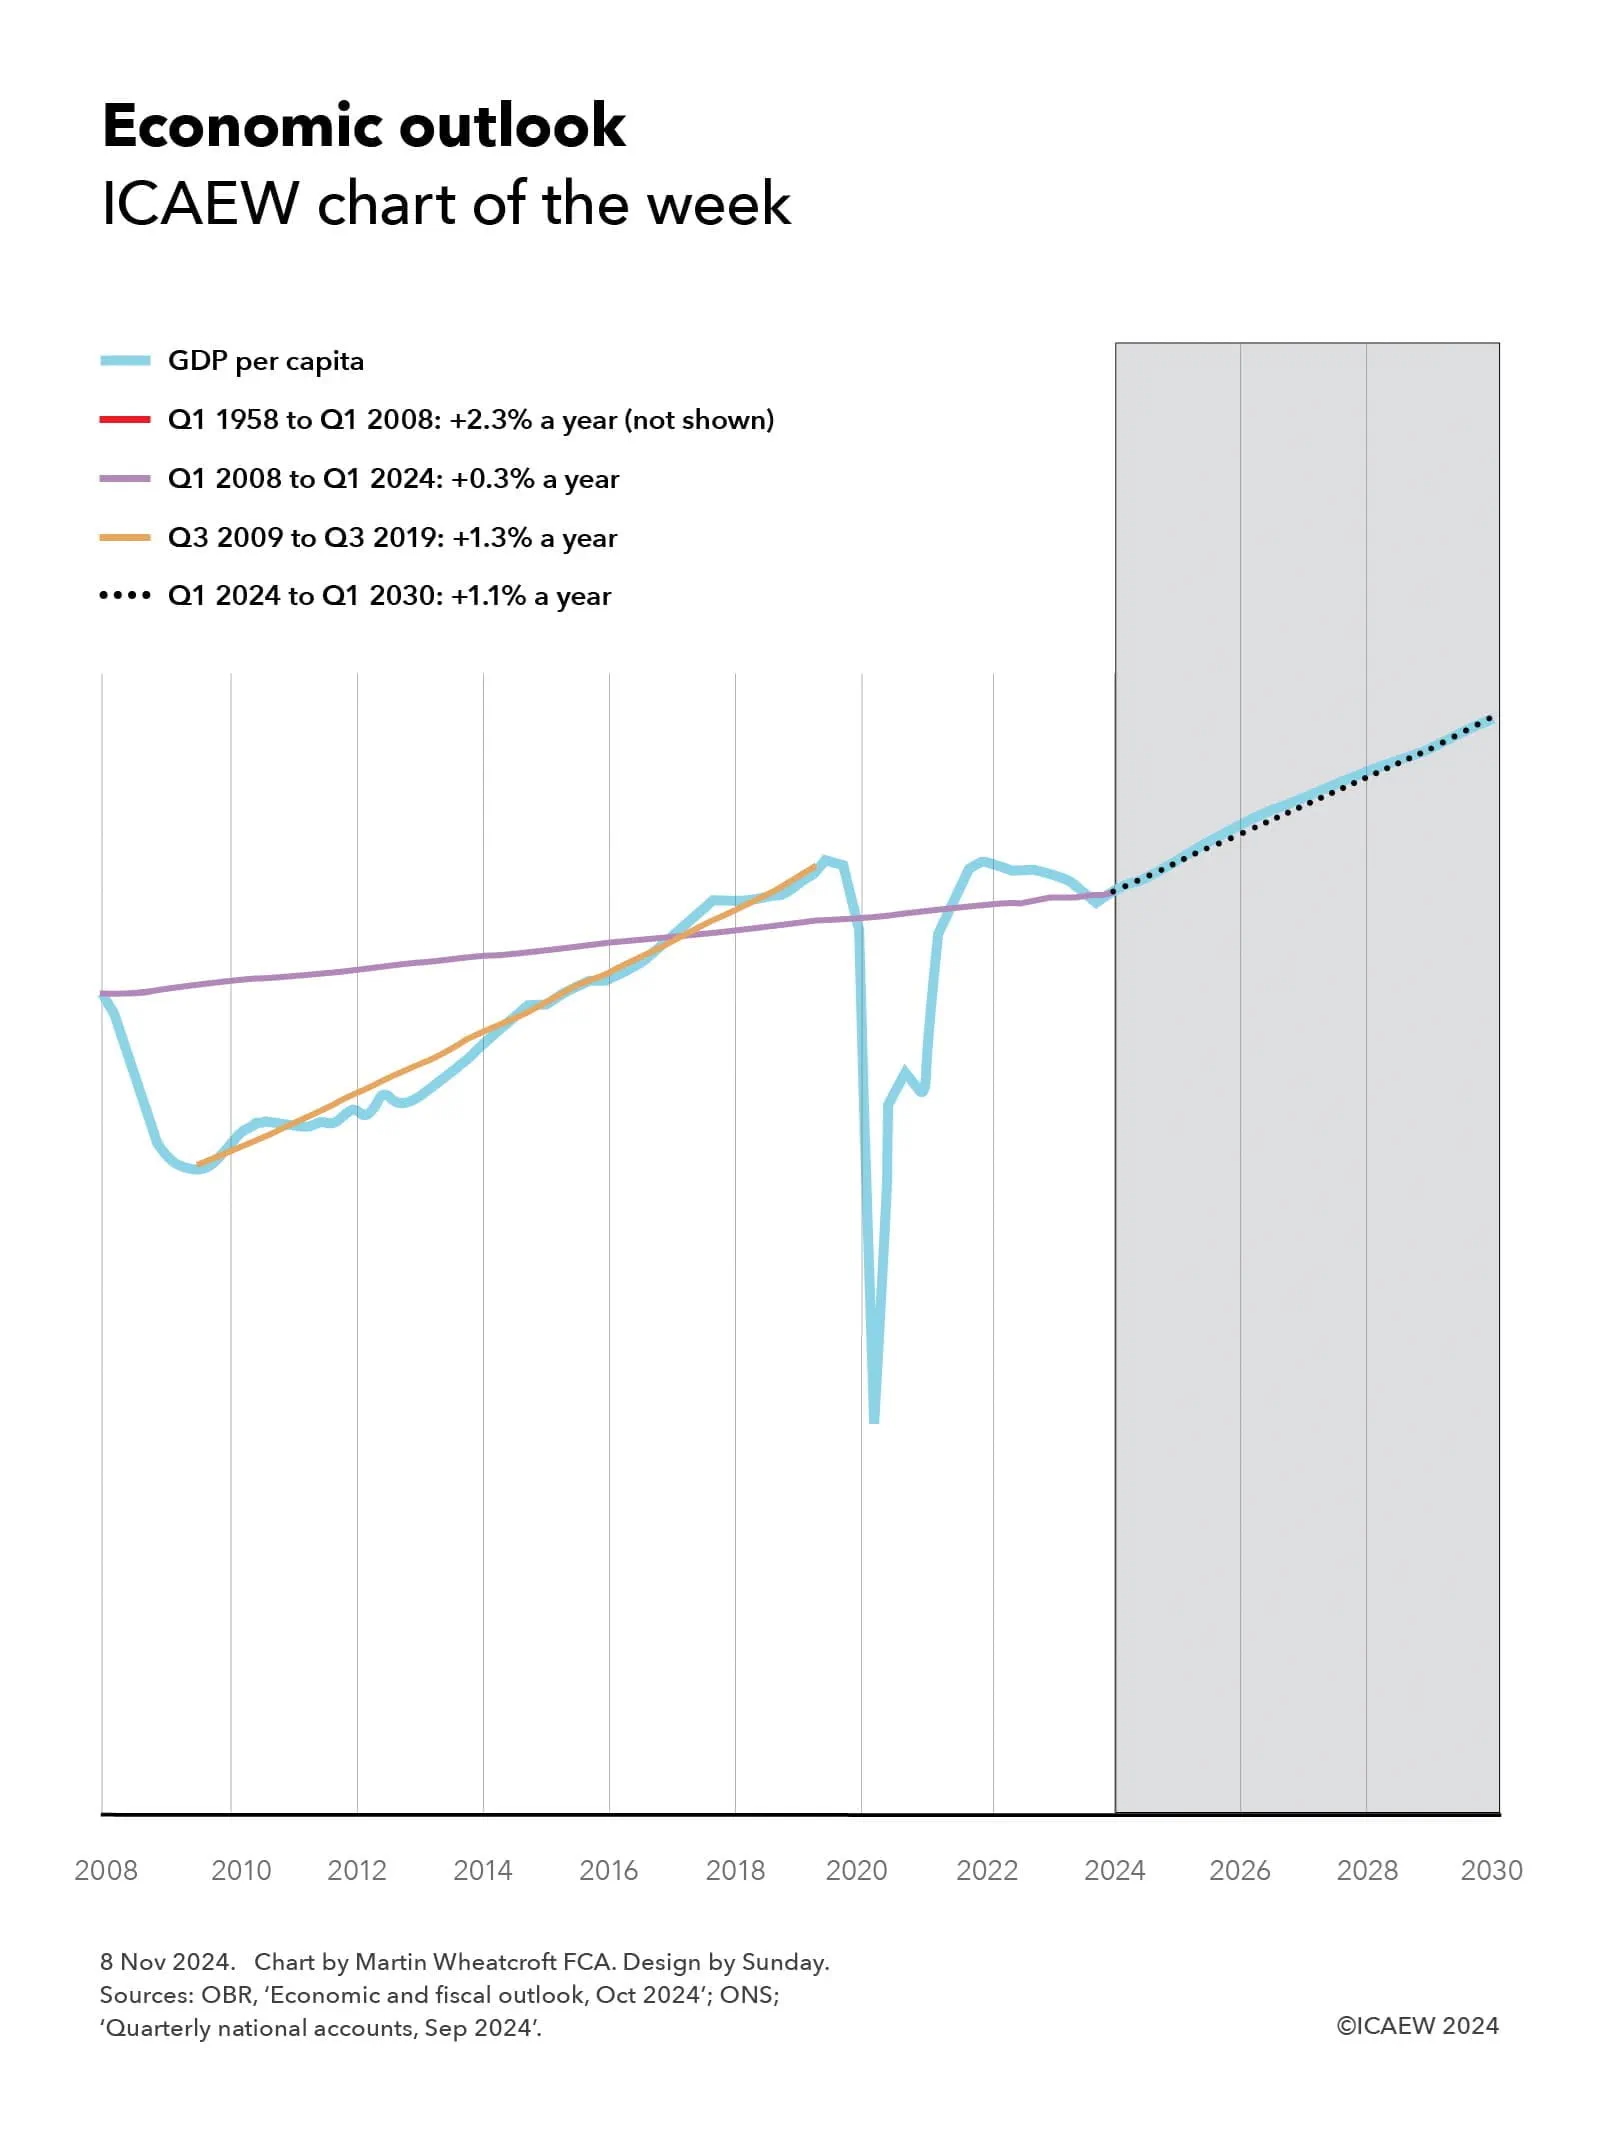
My chart for ICAEW this week looks at how the OBR is forecasting growth in economic activity per person of 1.1% a year between 2024 and 2030. While better than the average of 0.3% a year achieved over the past 16 years, it is significantly lower than the 2.3% a year seen in the 50 years before that.
My chart of the week is on the economic projections calculated by the Office for Budget Responsibility (OBR) in its October 2024 economic and fiscal outlook that accompanied the Autumn Budget 2024.
This assumption is a key driver for the OBR’s fiscal projections for tax receipts between now and March 2030, and hence how much the government will need to borrow to finance the current deficit and its investment plans.
The chart starts in March 2008 at the height of the financial crisis, illustrating how economic activity per person after adjusting for inflation fell significantly until September 2009. Real GDP per capita then grew at an average rate of 1.3% a year until September 2019, before the rollercoaster ride that saw the economy collapse during the pandemic, recover and then slide back during the energy crisis. A small uptick in the first quarter of 2024 is hardly noticeable.
The result was that real GDP per capita was only 4.4% higher in March 2024 than it was in March 2008, the equivalent of 0.3% a year on average over 16 years.
The OBR has been more optimistic for the current financial year up until March 2030, predicting per capita economic growth of 1.1% a year on average between the first quarter of 2024 and the first quarter of 2030.
This is of course much better than the 0.3% average increase over the past 16 years, but it is below the 1.3% growth in real GDP per capita during the ‘austerity years’ following the financial crisis and is substantially below the 2.3% average increase over the 50 years prior to the financial crisis.
From a ‘glass half empty’ perspective, this emphasises just how poorly the UK economy has performed since the financial crisis and the challenges the incoming government has in trying to improve productivity and economic output, even without the risk of an economic shock, events that appear to occur every decade or so.
However, those with a ‘glass half full’ temperament will be more cheerful. After all, there does appear to be substantial space for economic growth to improve from the OBR’s less-than-sparkling predictions, even without returning to the heady days of the pre-financial crisis long-term trend.
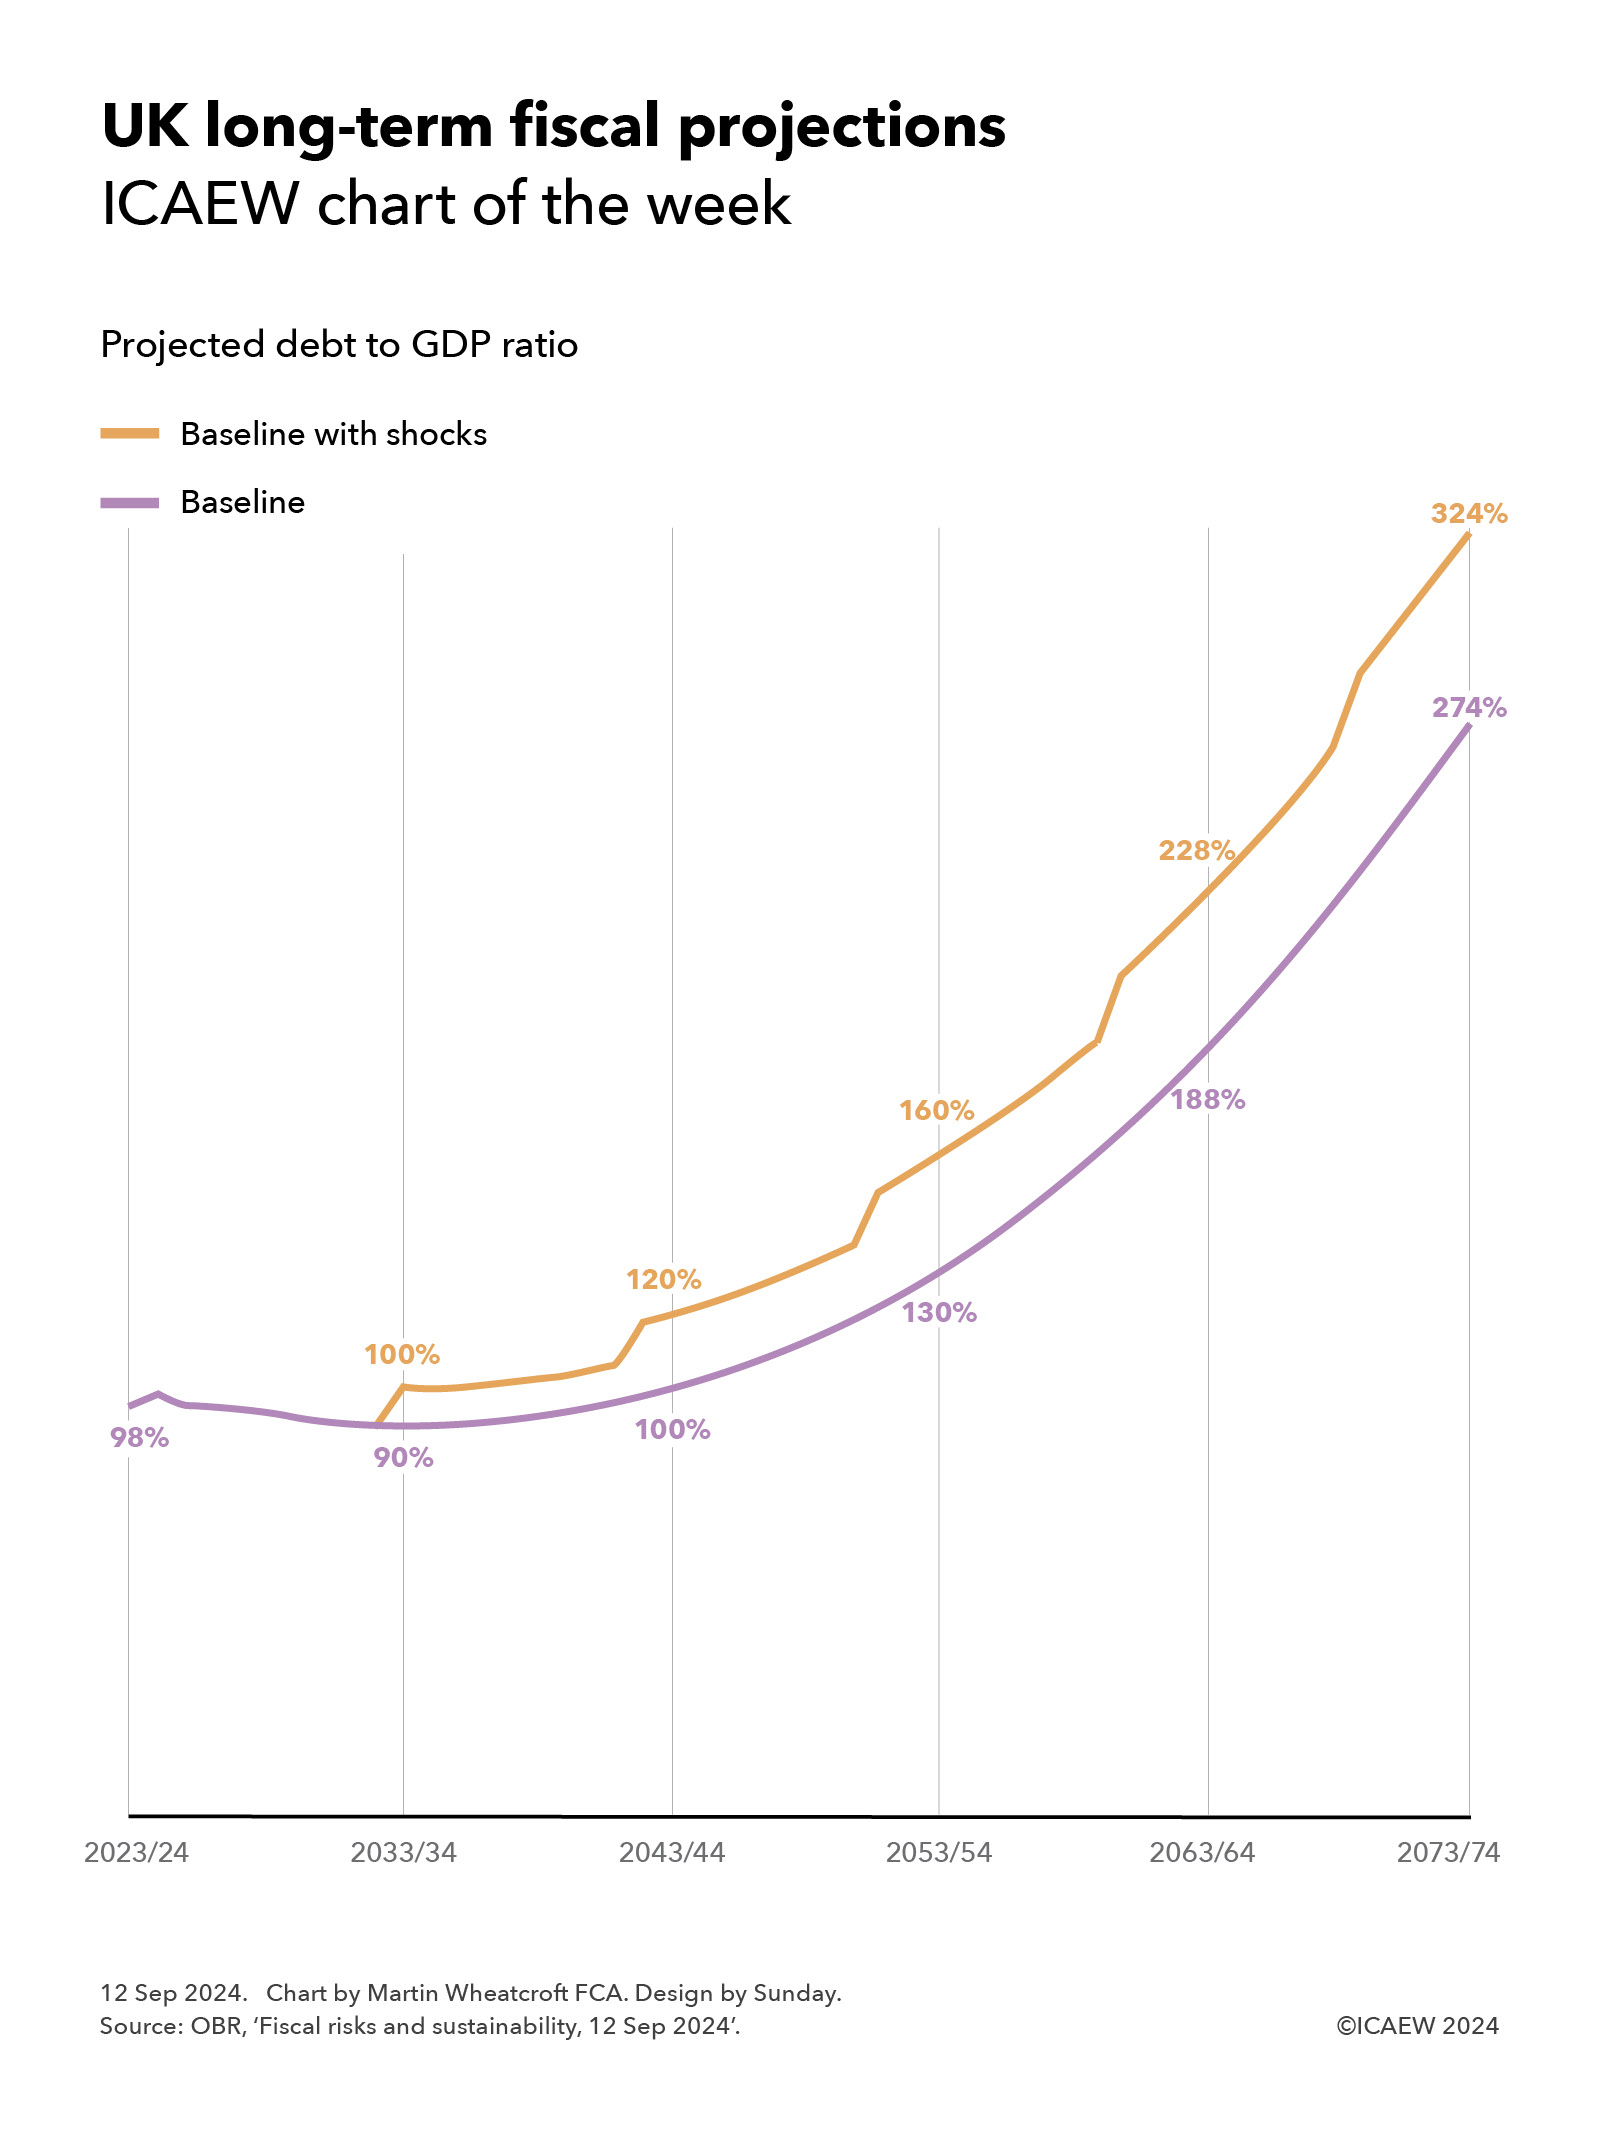
The OBR’s latest fiscal risks and sustainability report projects that public debt could reach 274% of GDP in 50 years’ time, or 324% if likely economic shocks are included.
Our chart this week is on the long-term fiscal projections included in the Office for Budget Responsibility’s (OBR) latest fiscal risk and sustainability report published on 12 September 2024.
The OBR suggests that – without action to improve productivity, increase taxes, cut spending, bring in more people or do more to tackle climate change – public sector net debt is projected to rise to 274%, or potentially 324% if likely economic shocks are included.
As the chart illustrates, debt to GDP was 98% at the end of 2023/24 and the baseline projection shows this falling over the coming decade to 90% by 2033/34, and then gradually increasing to 100% of GDP in 2043/44, 130% in 2053/54, 188% in 2063/64, and then 274% in 2073/74.
Experience tells us to expect an economic shock such as a recession every decade or so, and so the OBR also reports a ‘baseline with shocks’ scenario that sees the debt to GDP ratio reaching 100% of GDP in 2033/34, 120% in 2043/44, 160% in 2053/54, 228% in 2063/64, and then 324% in 2073/74.
The projections reflect long-term pressures on the public finances from the post-economic crisis slowdown in economic growth, an ageing population, the effects of climate change, and higher defence spending.
They are, of course, dependent on the assumptions used in their calculation, especially reproductivity growth, net inward migration, the health of the population, and the degree of rise in global temperatures. They also assume that the previous government’s plans to cut public spending significantly over the next five years are adopted by the incoming government, which is considered to be unlikely given that most economic commentators thought these plans were unrealistic even if there had not been a change in government.
Alternative scenarios prepared by the OBR include a better health scenario that results in a 44% lower debt to GDP ratio in 2073/74, a worse health scenario that increases debt by 49% of GDP, a higher rise in global temperatures to 2℃ that increases debt by 23% and to 3℃ that increases debt by 33%.
The good news is that all of these projections are completely unrealistic.
They are based on extrapolating from current tax and spending policies, without taking account of any actions that governments might take in the future to raise taxes, cut spending or develop the economy. It is extremely unlikely that future governments would be willing, or even able, to finance such large fiscal deficits over the next 50 years.
The bad news is that in consequence taxes are likely to go up.
While there are options to mitigate pressures on the public finances by cutting spending on public services or cutting the level of benefits such as the state pension, these are likely to be politically and practically difficult to achieve. Similarly, immigration remains a politically charged issue and encouraging higher levels of net inward migration significantly more than the 315,000 a year assumed from 2028/29 onwards might be challenging.
The OBR suggests a ‘fiscal tightening’ of 1.5% each decade would be necessary to return debt to its pre-pandemic level of approximately 80% of GDP. If accomplished through tax rises alone, this would see tax levels increase from a projected 37% of GDP in 2027/28 to around 43% of GDP in 2073/24.
Avoiding either of these outcomes – unsustainable debt or ever-increasing levels of taxation – will require productivity growth to increase significantly. So, if you have any good ideas on how to achieve higher productivity that no one else has thought of (preferably without increasing public spending too much), please write to the Chancellor at 11 Downing Street as she would probably be interested to hear them.
My chart for ICAEW this week looks at how negative economic growth per capita over the last five years may have contributed to the recent change in government.
My chart this week is on the change in quarterly GDP over the past five years, analysing the change between GDP as calculated by the Office for National Statistics (ONS) of £549bn in the first quarter of 2019 and £688bn in the first quarter of 2024, a net increase of £139bn.
Inflation, at 4% a year on average over the past five years, was the largest contributor to the change, being £120bn out of £139bn of the increase. An increase in population of more than 0.6% a year added a further £22bn, but this was offset by £3bn from negative economic growth per capita of 0.1% on average over the past five years.
Breaking down the £19bn change resulting from economic growth (0.5% a year on average), between population change and economic growth per capita in this way highlights how net inward migration has been one of the most significant drivers of the UK economy over the past five years.
While there are multiple reasons why the electorate decided to vote in a new government in the recent UK general election, the £41 reduction in quarterly GDP per capita over the past five years after adjusting for inflation – and the associated drop in living standards – to £9,994 per person in 2024 Q1 is likely to have been one of them.
The good news is that the next five years may be better, with monthly GDP up by 0.40% over the course of April and May 2024. This can be broken down between an estimated population growth of 0.16% and an increase in monthly GDP per capita over the two months of 0.24%, a positive sign, especially in the light of the latest ICAEW Business Confidence Monitor reporting that business confidence has risen to its highest level in over two years.
Two quarters of shallow negative GDP growth may be just enough for the UK to be in a mere ‘technical’ recession, but seven successive quarters of negative GDP growth per capita present a more worrying picture.
The Office for National Statistics (ONS) released its latest statistics on quarterly GDP on 15 February 2024, reporting that GDP in the fourth quarter of 2023 (October to December) had fallen by 0.3% compared with the previous quarter, which in turn was 0.1% below the quarter before that. This was sufficient for the UK to meet one of widely accepted definitions of a recession: two successive quarters of economic contraction.
Many economists have chosen to describe this as a ‘technical’ recession given how shallow the fall in growth has been over the past two quarters, very different from the scale of contraction seen in ‘proper’ recessions such as that experienced during the financial crisis (when GDP fell in the order of 6% over four successive quarters). The ‘technical’ label also emphasises how relatively small subsequent revisions to the quarterly statistics could easily lift the UK out of recession again.
Perhaps more worrying for all of us living in the UK are how changes in GDP per capita have been negative over the past seven quarters, as illustrated by our chart this week. GDP per person can often be more important to individuals than the overall change in GDP given how living standards are, by definition, experienced on a per capita basis.
According to the official chained volume measure of GDP per head, economic activity per capita grew by 0.2% in the first quarter of 2022 (over the previous quarter) but has declined since then: by -0.2%, -0.2% and -0.0% respectively in the second, third and fourth quarters of 2022, and then -0.1%, -0.2%, -0.4% and -0.6% in the first, second, third and fourth quarters of 2023.
Overall, this is equivalent to a reduction of 1.5% in GDP per head between the fourth quarter of 2021 and the fourth quarter of 2023, although one additional note of caution is that the per capita numbers are based on population projections that are even more susceptible to revision than estimates of the size of the economy. Despite that, these numbers are not a sign of an economy doing well.
The per capita numbers put the reported GDP growth rates for the same eight quarters of +0.5%, +0.1%, -0.1%, +0.1%, +0.2%, +0.0%, -0.1%, and -0.3% respectively (equivalent to cumulative GDP growth of +0.4% between 2021 Q4 and 2023 Q4), into perspective, highlighting just how weak the performance of the UK economy has been over the past two years.
Just as the recession is being described as ‘technical’, there are good arguments for describing positive growth in GDP as also ‘technical’ when per capita growth is negative at the same time, reflecting how much stronger economic growth needs to be for living standards to improve.
This week’s chart takes a look at recent revisions to GDP that have caused some consternation in the world of statistics.
Each year the Office for National Statistics (ONS) publishes the ‘Blue Book’ on the national accounts, its definitive analysis of economic activity over the course of the previous year. This analysis supersedes the preliminary and revised monthly and quarterly estimates issued up until that point, based on extensive analysis by the official statisticians.
The 2023 edition of the Blue Book is scheduled to be published on 31 October 2023. It will be eagerly pored over by economists in and outside government who will be eager to understand how the UK economy performed during 2022, and how this ‘final’ version of the 2022 numbers line up with those preliminary and revised estimates, just as they did last year when looking at GDP for 2021.
However, in the world of statistics numbers are never final. On 1 September 2023, the ONS announced methodological and data improvements to last year’s Blue Book – the numbers for 2021 and earlier years. These prior-period adjustments partly reflected a methodology change in the way the three different methods of calculating GDP (output, income and expenditure) are reconciled, but much more significant were revisions to the data used to calculate some of the key statistics, causing much wailing and gnashing of teeth by some prominent economic commentators as the narrative around the UK’s emergence from the pandemic changed.
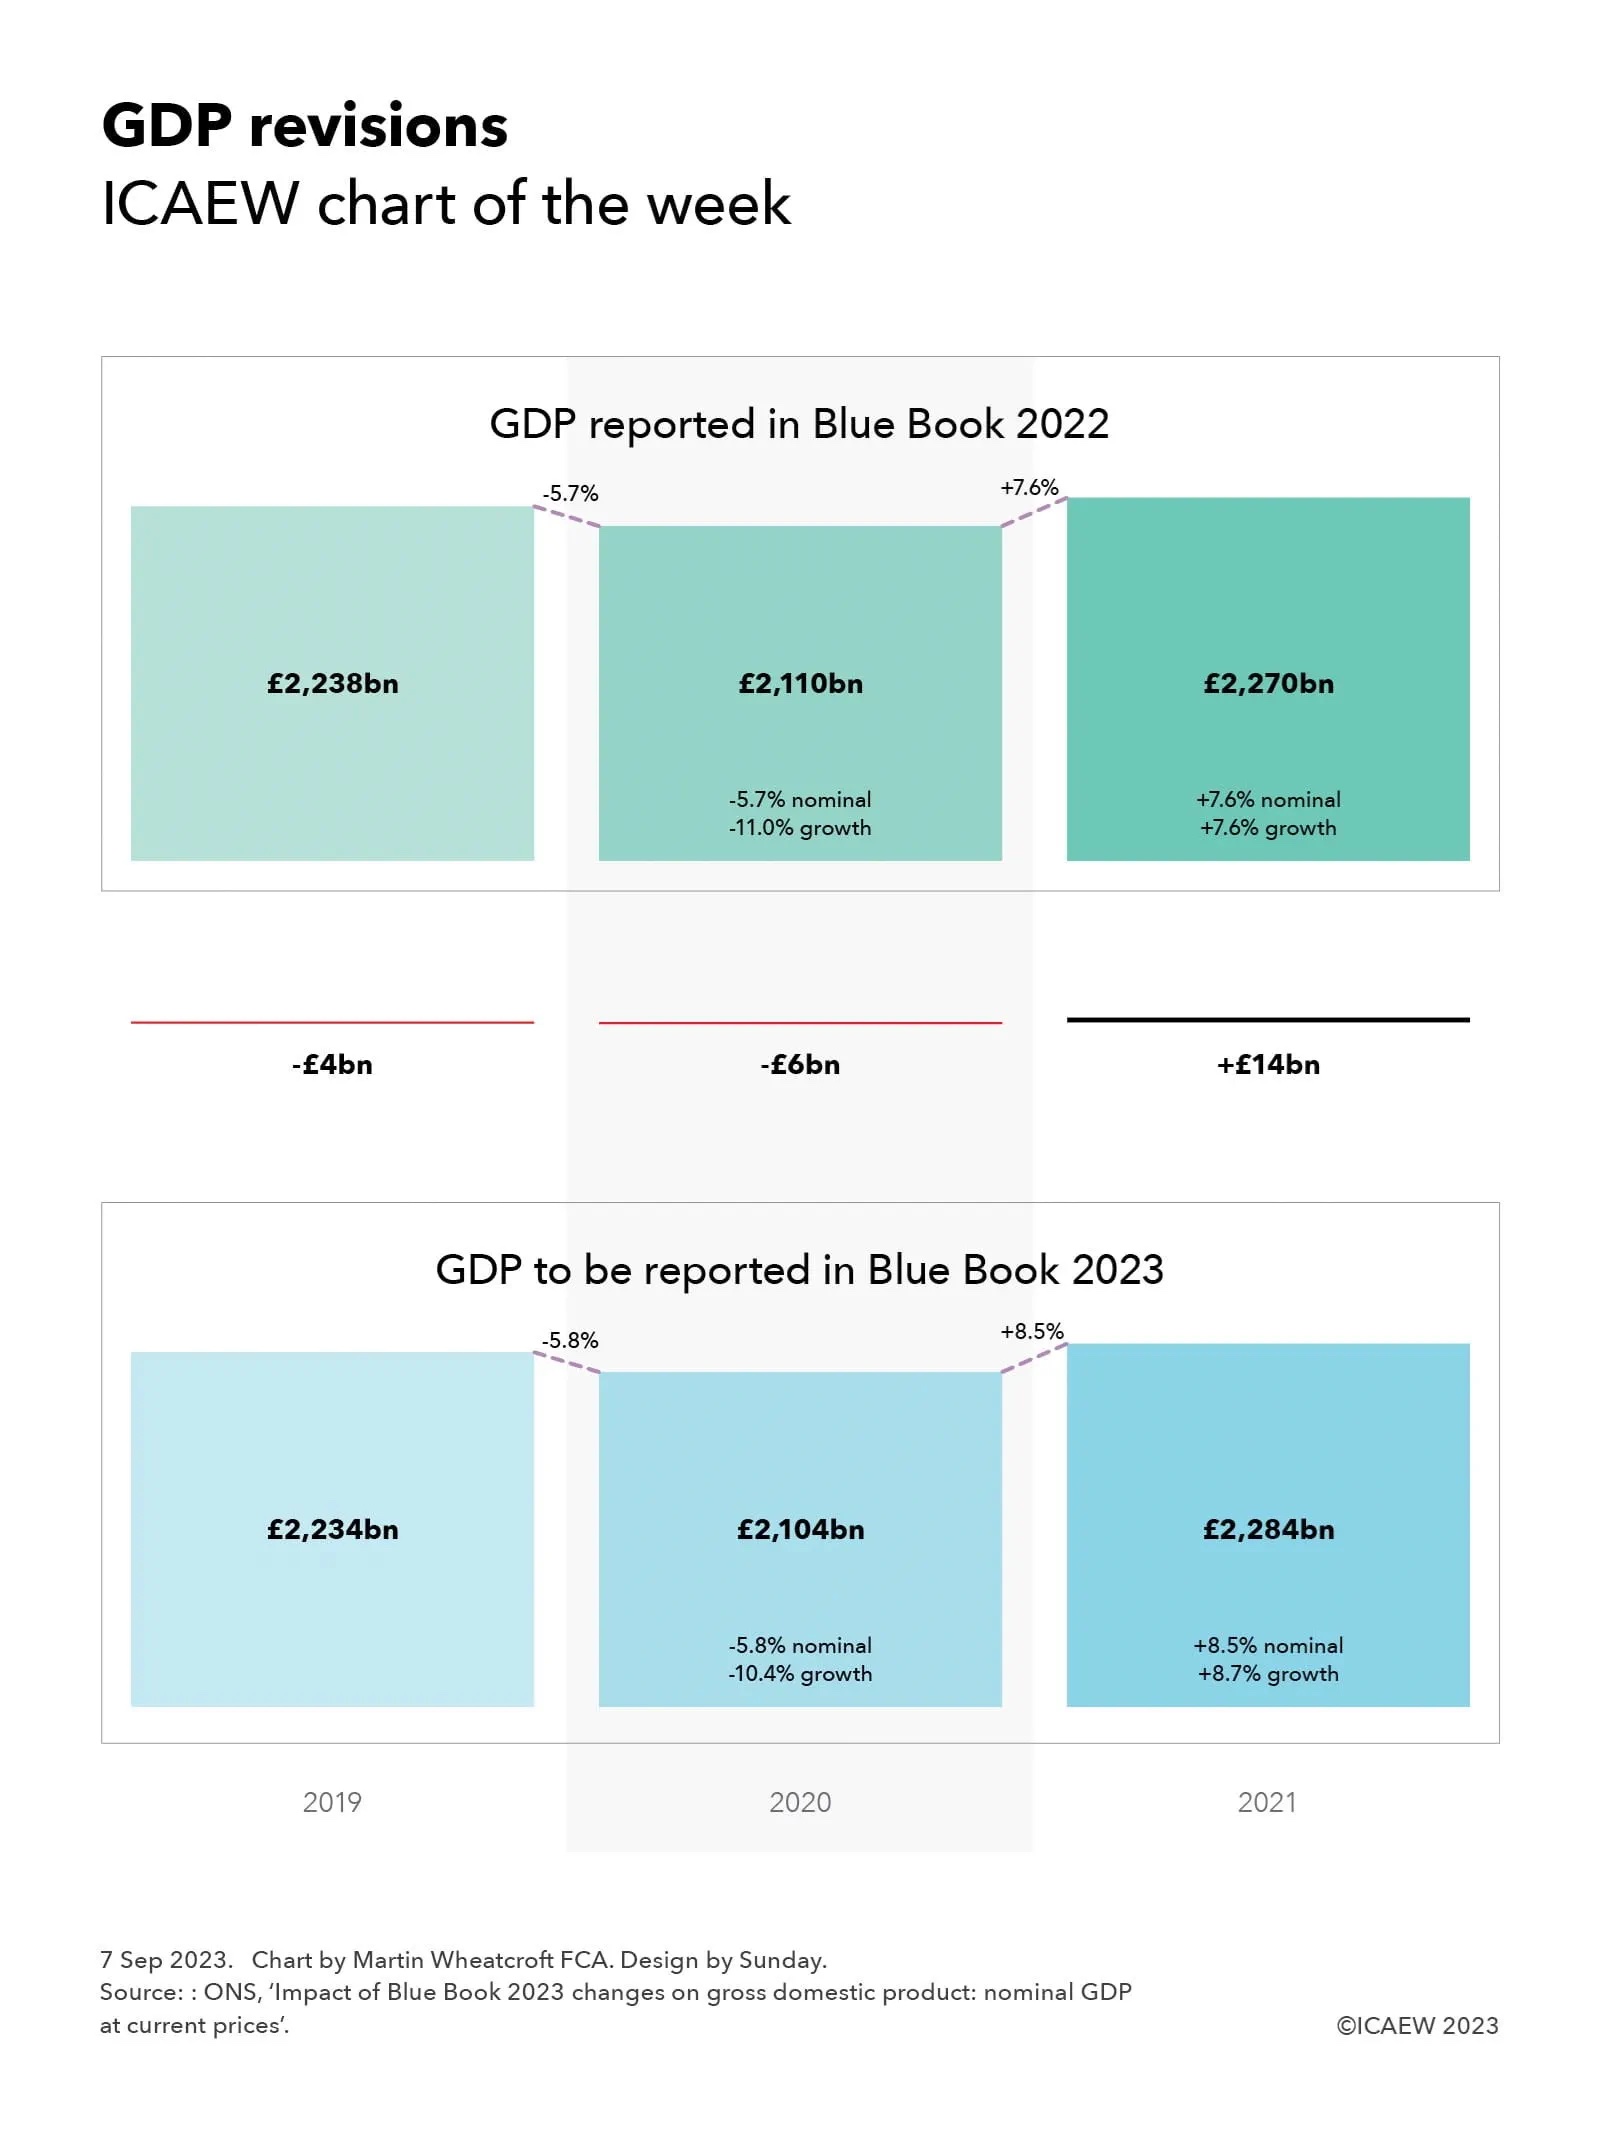
As our chart this week illustrates, the revisions to GDP do not at first sight appear to be that significant. GDP for 2019 has been revised down by £4bn from the previously reported £2,238bn to a new official number of £2,234bn; GDP for 2020 is £6bn down from £2,110bn to £2,104bn; and GDP for 2021 has been revised up by £14bn from £2,270bn to £2,284bn. These seem relatively small changes when looking at trillions of pounds of economic activity.
Where the change really has an impact is in looking at the trends, especially after adjusting for inflation. On a nominal basis, a 5.7% nominal decrease in 2020 followed by a 7.6% increase in 2021 has changed to a 5.8% decrease and an 8.5% increase, but in real terms the previously reported economic contraction of 11.0% in 2020 followed by a 7.6% recovery has changed to a smaller contraction of 10.4% followed by a stronger recovery of 8.7%.
Of course, the devil is in the detail and some of the revisions at an industry level have been much more dramatic, with wholesalers and retailers now believed to have grown more strongly than previously believed, while the iron and steel industry changed from growth to contraction.
Many economic commentators have focused on the change in quarterly GDP (not shown in the chart) where the arithmetical changes have been more pronounced. The movement from the fourth quarter of 2019 (previously £568bn, now £566bn) and the fourth quarter for 2021 (previously £593bn, now £597bn) has gone from a 4.4% increase over two years to a 5.5% increase; in real terms from a 1.2% contraction in the economy to growth of 0.7%. Still anaemic, but at least in positive territory.
Despite this small improvement in the economic story portrayed by the GDP statistics, we should not get too carried away. Economic growth remains well below the pre-financial crisis levels and the public finances are in a significantly worse state than they were back in 2008.
In the meantime, the Office for Statistics Regulation has commenced a review into how these small revisions with big implications for our understanding of the economy were not identified at the time.
This week’s chart reviews the sharp increase in the national debt to GDP ratio as we reflect on the challenges facing Chancellor Rishi Sunak.
Better tax receipts and higher inflation are expected to contribute to an improvement in the fiscal forecasts that will accompany the Spring Statement on 23 March 2022, further increasing the pressure on the Chancellor to do more to support households and businesses facing spiralling energy prices and a cost-of-living crisis.
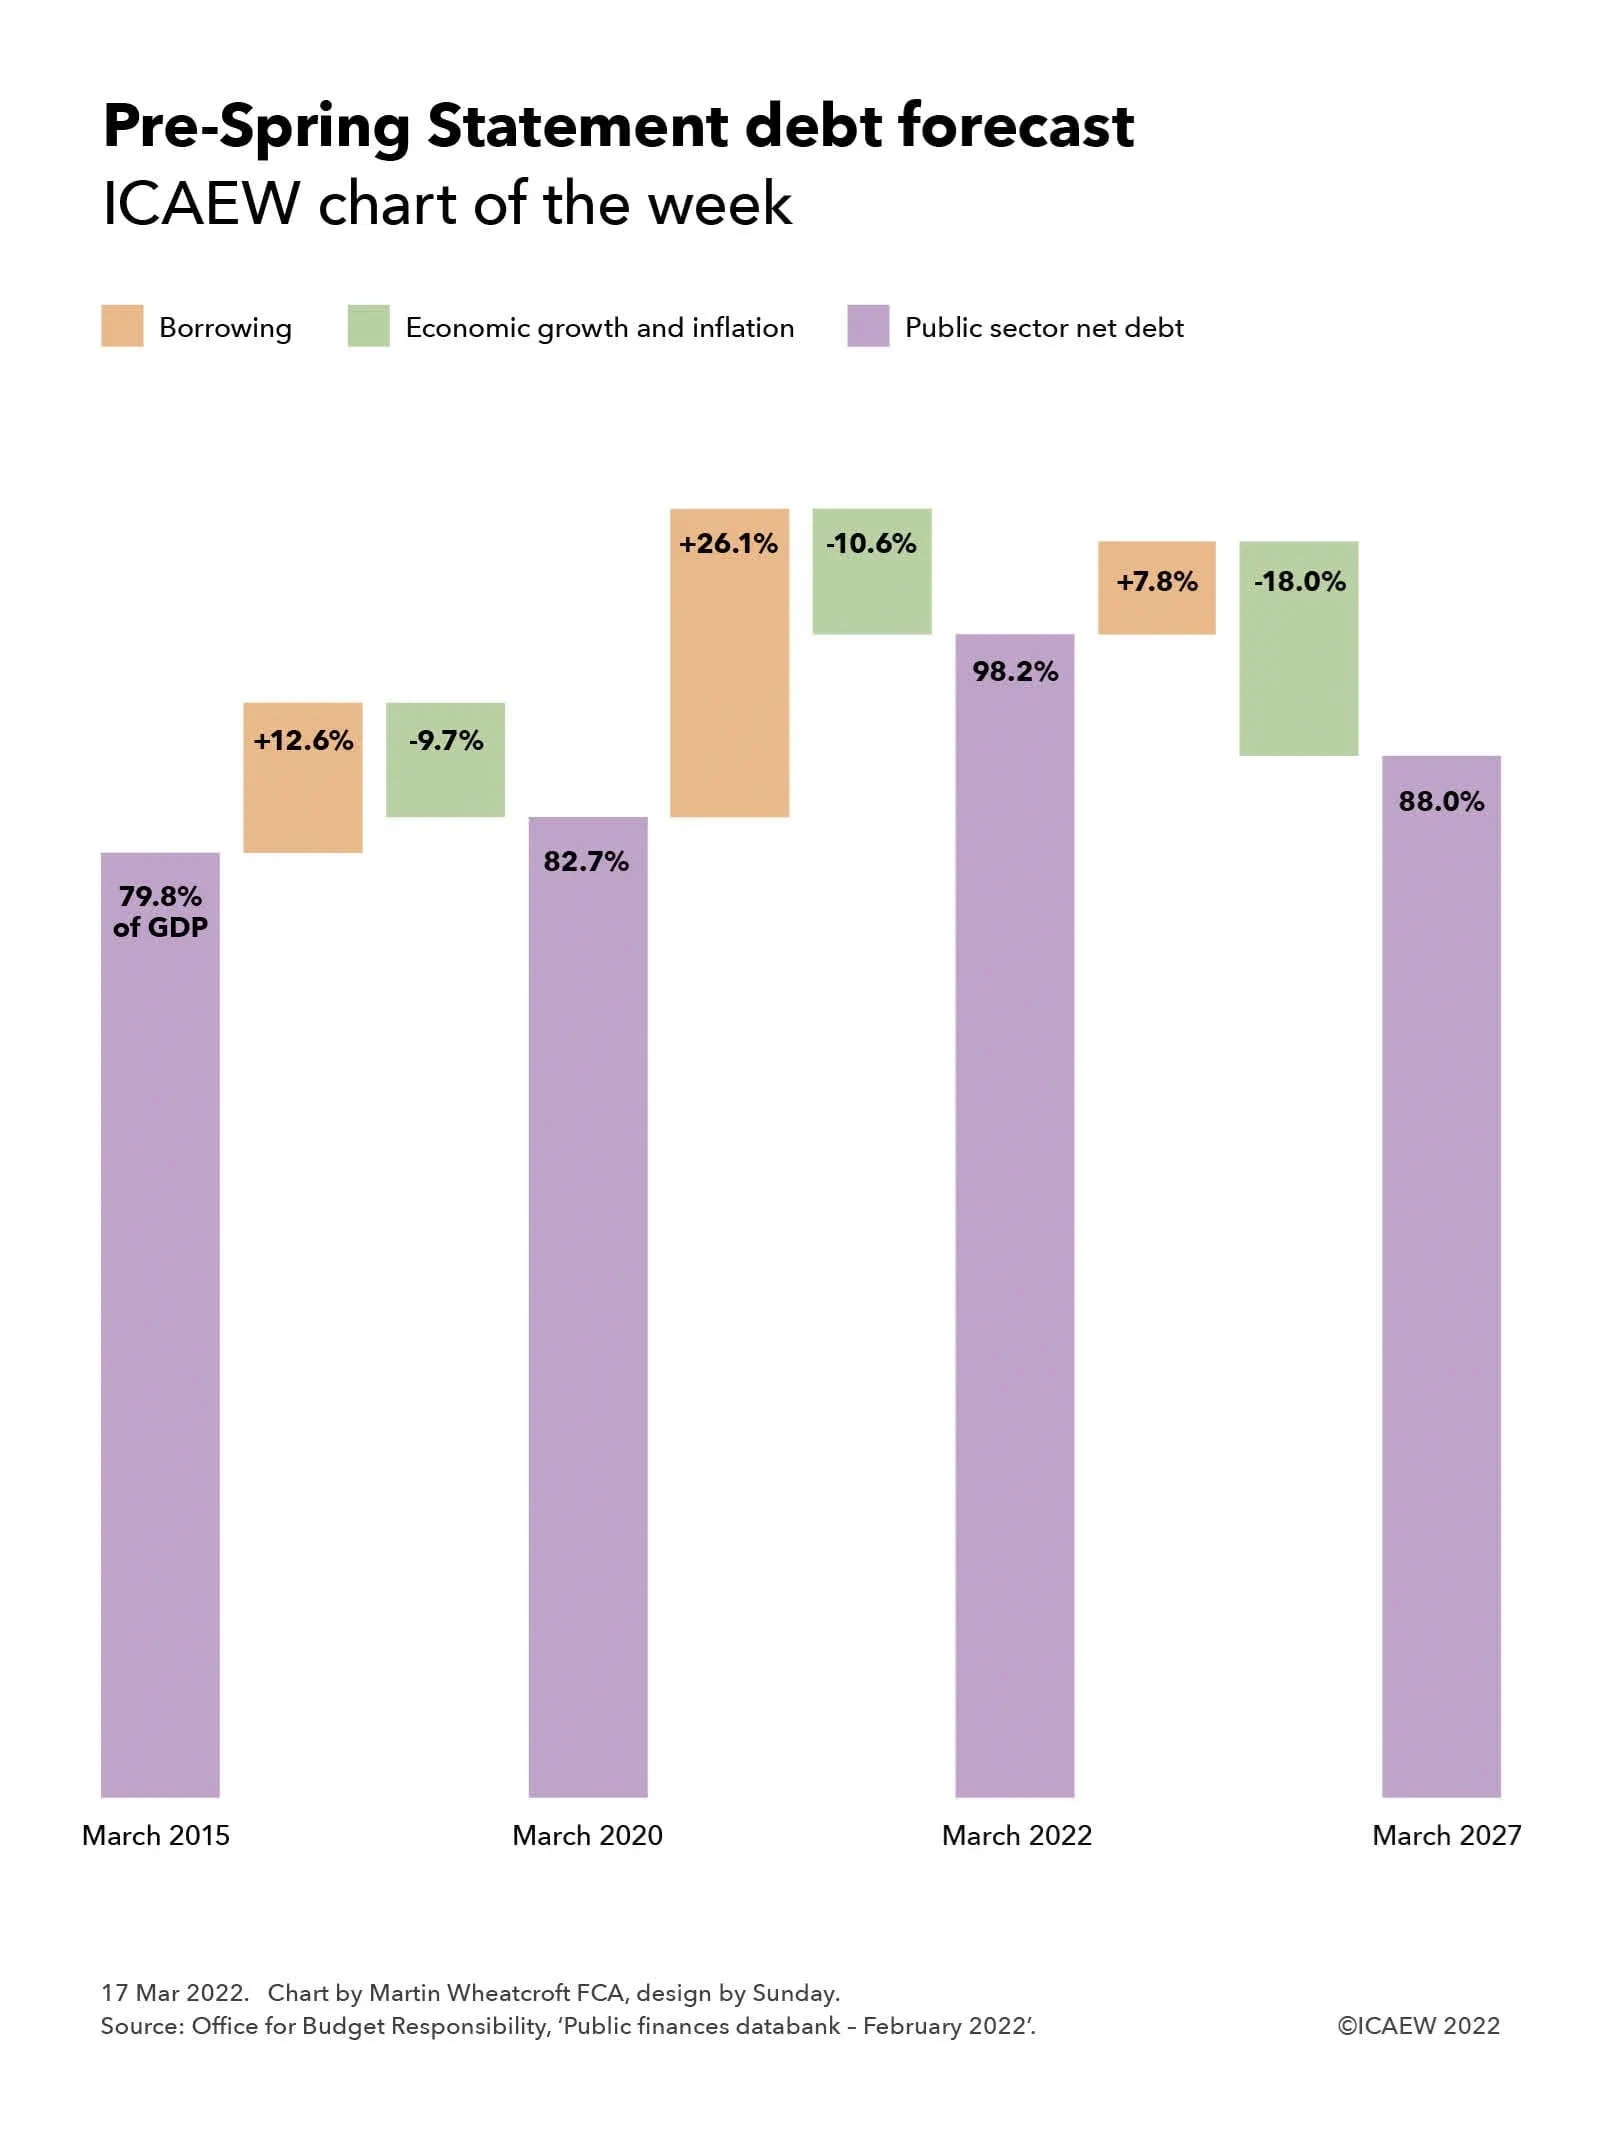
Our chart this week is based on the latest official forecast for public sector net debt prior to its update on 23 March 2022 at the Spring Statement. The chart highlights how it took five years for debt to increase from 79.8% to 82.7% as a share of GDP before leaping to a projected 98.2% over the two years to 31 March 2022 and then falling to a projected 88.0% at 31 March 2027.
The debt to GDP ratio is probably the most important key performance indicator used by most governments to assess their public finances, so much so that when ministers talk about reducing debt, they do not mean paying back the amounts owed to debt investors (unless they are in the German government). Instead, governments in most developed countries aim to borrow at a slower rate than the increase in the size of the economy, allowing the combination of economic growth and inflation to offset the often-significant sums of cash required to finance the shortfall between tax receipts and public spending.
This objective has been difficult to achieve over the past decade of low economic growth and low inflation, as illustrated by the increase in the UK’s debt to GDP ratio from 79.8% to 82.7% between 31 March 2015 and 2020. In cash terms, public sector net debt increased by £261bn from £1,532bn to £1,793bn over that five-year period, equivalent to 12.6% of a year’s GDP. The debt to GDP ratio only went up by 2.9 percentage points, with economic growth and inflation offsetting the increase in the amounts owed by the equivalent of 9.7% of GDP. (The objective would have been achieved but for a quirk in the choice of GDP measure used for this calculation by the Office for National Statistics in the UK, which is ‘mid-year GDP’; at 31 March 2020 this encompassed both the last six months of 2019/20 before the pandemic but also the first six months of 2020/21 and the lockdowns that occurred during that time, reversing some of the economic growth experienced in the preceding five years.)
The chart goes onto illustrate how the more than half a trillion pounds (£576bn or 26.1% of GDP) borrowed by the government in just two years over the course of the pandemic is partially offset by the economic recovery and a great deal more inflation, reducing the impact on the debt to GDP ratio by the equivalent of 10.6%.
Debt as a share of GDP over the next five years is then expected to decline, with a projected net addition of £198bn (7.8% of GDP) expected to be added to debt according to last October’s forecast. Projected public sector net debt of £2,567bn at 31 March 2027 is currently expected to be lower in proportion to the size of the economy at 88.0% of GDP, as the post-pandemic recovery and already forecast higher rates of inflation cause GDP to rise at a faster rate than the government can borrow, resulting in a reduction equivalent to 18.0% of GDP.
The official projections for the current financial year, prepared last October by the Office for Budget Responsibility (OBR), are expected to be revised upwards to incorporate the stronger tax receipts reported in recent monthly public sector finance reports and higher levels of GDP from even higher rates of inflation than previously expected. These effects are likely to combine to reduce the 98.2% of GDP forecast for debt for the end of March 2022 by several percentage points.
There is a much greater deal of uncertainty about how the OBR’s medium-term projections will deal with the potential future path of the pandemic, the cost-of-living squeeze on household incomes, and the effect of the war in Ukraine and sanctions on Russia on UK businesses. This is in addition to its normal difficulty in both measuring and forecasting the trillions of financial transactions that are undertaken every year in an economy of more than 67m people.
Many economic commentators expect stronger tax receipts and higher inflation to flow through to the projections for the next five years, even after taking account of the increased interest costs that come from higher rates of inflation and higher interest rates and the already announced package of support measures for households struggling with energy price rises. This should in theory result in a substantial improvement in the projected debt to GDP ratio in March 2027 from the 88.0% previously forecast, but what we won’t know until the Spring Statement is to what extent Chancellor Rishi Sunak intends to spend some of that improvement.
Mixed signals mean that it is difficult to tell to whether there will be an improvement to the support package to households facing large rises in their energy costs and the prices they pay for food and other essentials, whether the Chancellor will also choose to reduce fuel duties to help motorists, and how far he will opt to support businesses affected by substantially higher input costs in addition to the knock-on effects of the war in Ukraine and sanctions on Russia. Not to mention the political pressure on the Chancellor to announce increases in the defence budget now rather than waiting for the Autumn Budget.
For what was envisioned as a quiet fiscal occasion dealing with routine revisions to the fiscal forecasts, the Spring Statement has turned into a significant fiscal event. After all, even if the Chancellor decides to do nothing, that will still be a choice, with major implications for the public finances and the UK economy.
As the sage once said (or possibly didn’t), we live in fiscally interesting times.