First quarter fiscal deficit in line as Chancellor ponders tax rises

Despite borrowing to fund the deficit in the first three months of the financial year of £58bn being in line with expectations, it was still the third-highest first quarter result on record.

The monthly public sector finances release for June 2025 published by the Office for National Statistics (ONS) on 22 July reported a provisional deficit of £21bn for the month of June and £58bn for the three months then ended. This is £4bn more and in line with budget respectively, and £7bn and £8bn more in each case than the first fiscal quarter a year ago.

Alison Ring OBE FCA CPFA, ICAEW Director of Public Sector and Taxation, says: “Even if borrowing to fund the deficit in the month of June was only a little higher than expected and was in line with expectations in the first three months of the financial year, the first quarter was still the third highest since monthly records began. This trajectory will not have lightened the Chancellor’s mood as she decides which taxes to put up in the Autumn Budget later this year. 

“The government has two big problems with the public finances: the short-term outlook – which is bad – and their long-term prospects – which are worse. Public spending continues to outpace tax receipts by a significant margin, while the OBR has reiterated its conclusion that the public finances are unsustainable over the next 25 to 50 years if this and future governments continue on the current path. 

“Unfortunately, the major challenges facing the public finances over the next quarter of a century and beyond means that this will not be the last time a chancellor of the exchequer needs to come back asking for more. Now is the time to stop kicking the can down the road and develop a comprehensive long-term fiscal strategy to put the public finances onto a sustainable path.”

Month of June 2025

The fiscal deficit for June 2025 was £21bn, £4bn more than budgeted and £7bn more than a year previously. According to the ONS, this was the second-highest June deficit since monthly records began in 1993, with only June 2020 during the pandemic being higher.

First quarter to June 2025

The deficit for the first three months of the 2025/26 financial year was £58bn, £8bn more than a year previously. Despite being in line with budget, this is the third-highest first quarter deficit since monthly records began (after the first quarter deficits in 2020/21 and 2021/22). 

Table 1 highlights how total receipts and total current spending in the three months to June 2025 of £278bn and £323bn were up 7% and 8% respectively, compared with the same period last year.

Receipts were boosted by the employer national insurance increase from April 2025 onwards in addition to the effect of fiscal drag on income tax caused by the continued freeze in personal tax allowances. Meanwhile, the increase in current spending over the past year was primarily as a consequence of public sector pay rises, higher supplier costs and rises in welfare benefits.

The increase in debt interest of £5bn to £42bn consisted of a £6bn increase in indexation on inflation-linked debt as inflation returned less a £1bn reduction in interest on variable and fixed-interest debt. The latter was primarily the effect of a lower Bank of England base rate offsetting a higher level of debt compared with a year ago.

Net investment of £13bn in the first quarter of 2025/26 was £1bn or 8% higher than the same period last year. Capital expenditure of £22bn was up by £1bn and capital transfers (capital grants, research and development funding, and student loan write-offs) of £9bn were up by £1bn, less depreciation of £18bn up by £1bn.

Table 1: Summary receipts and spending

3 months to June2025/26
£bn
2024/25
£bn
Change
%
Income tax6460+7%
VAT5250+4%
National insurance4841+17%
Corporation tax2624+8%
Other taxes5756+2%
Other receipts3130+3%
Current receipts278261+7%
Public services(178)(165)+8%
Welfare(77)(72)+7%
Subsidies(8)(8)
Debt interest(42)(37)+14%
Depreciation(18)(17)+6%
Current spending(323)(299)+8%
Current deficit(45)(38)+18%
Net investment(13)(12)+8%
Deficit(58)(50)+16%

Borrowing and debt

Table 2 summarises how the government borrowed £64bn in the first quarter to take public sector net debt to £2,874bn on 30 June 2025. The movements comprised £58bn in public sector net borrowing (PSNB) to fund the deficit and £6bn to fund government lending activities and working capital movements.

The table also illustrates how the debt to GDP ratio increased from 95.2% of GDP at the start of the financial year to 96.3% on 30 June 2025, with the incremental borrowing partly offset by the ‘inflating away’ effect of inflation and economic growth adding to GDP, the denominator in the net debt to GDP ratio.

Table 2: Public sector net debt and net debt/GDP

3 months to June2025/26
£bn
2024/25
£bn
PSNB5850
Other borrowing6(3)
Net change6447
Opening net debt2,8102,686
Closing net debt2,8742,733
PSNB/GDP2.0%1.8%
Other/GDP0.2%(0.1%)
Inflating away(1.1%)(1.5%)
Net change1.1%0.2%
Opening net debt/GDP95.2%95.6%
Closing net debt/GDP96.3%95.8%

Public sector net debt on 30 June 2025 of £2,874bn comprised gross debt of £3,286bn less cash and other liquid financial assets of £412bn. 

Public sector net financial liabilities were £2,504bn, comprising net debt of £2,874bn plus other financial liabilities of £706bn less illiquid financial assets of £1,076bn. Public sector negative net worth was £878bn, being net financial liabilities of £2,504bn less non-financial assets of £1,626bn.

Revisions

Caution is needed with respect to the numbers published by the ONS, which are repeatedly revised as estimates are refined and gaps in the underlying data are filled. This includes local government where the numbers are only updated in arrears and are based on budget or high-level estimates in the absence of monthly data collection.

The latest release saw the ONS revise the previously reported deficit for the two months to May 2025 down by £1bn and revise public sector net debt on 31 May 2025 up by £7bn.

For further information, read the public sector finances release for June 2025.
This article was originally published by ICAEW.

ICAEW chart of the week: the end of year capital rush

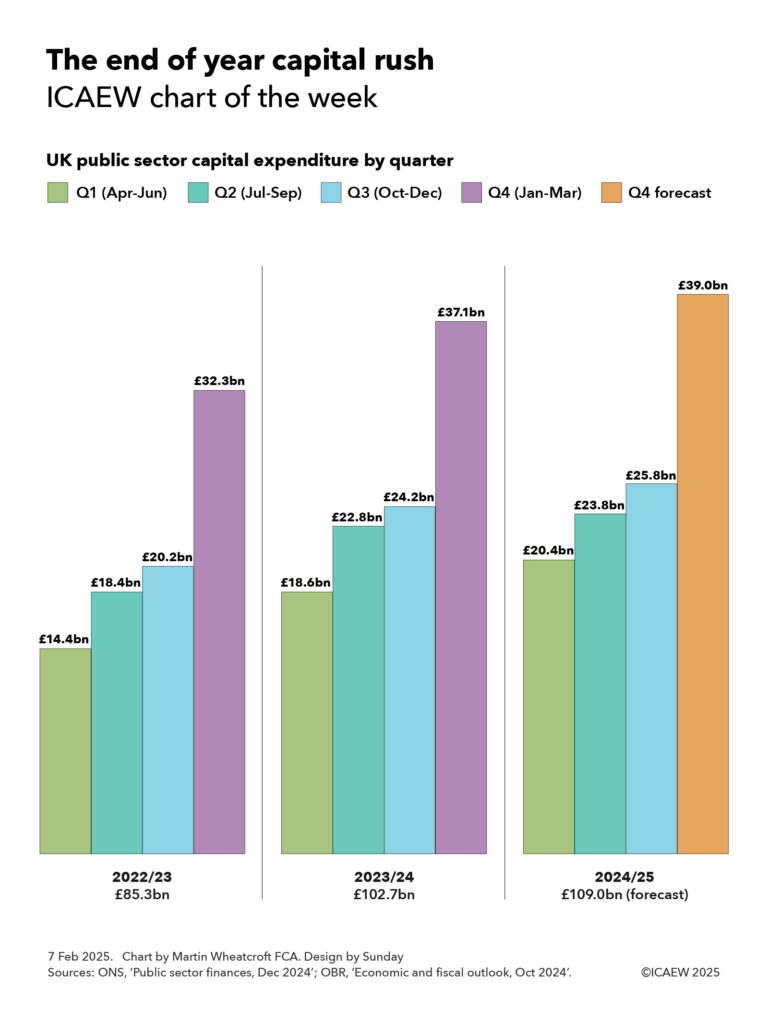
My chart of the week for ICAEW highlights the big rush in UK public sector capital expenditure in the final quarter of each financial year, prompting us to ask why March is the best time of the year to build new assets.

Column chart illustrating UK public sector capital expenditure by quarter, comprising three financial years each made up of four quarters: Q1 (Apr-Jun), Q2 (Jul-Sep), Q3 (Oct-Dec), and Q4 (Jan-Mar). 

2022/23 £85.3bn: £14.4bn, £18.4bn, £20.2bn, and £32.3bn. 
2023/24 £102.7bn: £18.6bn, £22.8bn, £24.2bn and £37.1bn. 
2024/25 £109.0bn (forecast): £20.4bn, £23.8bn, £25.8bn and £39.0bn (forecast). 
 

7 Feb 2025. Chart by Martin Wheatcroft FCA. 
Sources: ONS, 'Public sector finances, Dec 2024’; OBR, ‘Economic and fiscal outlook, Oct 2024’.

Over the years, the process for delivering capital expenditure in the public sector in the UK has had a pretty bad reputation. The anecdote goes that the first quarter is spent arguing about budgets, in the second everyone goes on holiday, and it is only in the third quarter that programmes finally get up and running, before everything stops for the Christmas break. The final quarter is then a mad rush to spend the remaining budget before the end of the financial year.

Unfortunately, there does appear to be some support for this conjecture when we take a look at the actual numbers.

According to the public sector finance release for December 2024, together with the latest Office for Budget Responsibility forecast for the current financial year to March 2025, public sector gross capital formation (in effect capital expenditure) is lowest in the first quarter, picks up in the second (despite the summer holidays), rises slightly again in the fourth (despite the Christmas break) and then explodes in the fourth quarter of each financial year (despite winter).

Our chart shows capital expenditure in 2022/23 of £85.3bn comprised £14.4bn in Q1 (Apr-Jun), £18.4bn in Q2 (Jul-Sep), £20.2bn in Q3 (Oct-Dec) and £32.3bn in Q4 (Jan-Mar). A similar pattern occurs in 2023/24 when a total £102.7bn of capex was incurred, with £18.6bn in Q1, £22.8bn in Q2, £24.2bn in Q3, and £37.1bn in Q4. Meanwhile in the current 2024/25 financial year, £20.4bn was incurred in Q1, £23.8bn in Q2, and £25.8bn in Q3, with a forecast of £39.0bn in Q4 to reach a forecast total of £109.0bn.

In practice the fourth quarter jump is principally seen in the final month of the financial year, as seen in 2023/24 when fourth quarter capital expenditure of £37.1bn consisted of £9.6bn in January 2024 (£1.0bn more than the monthly average capital expenditure of £8.6bn that financial year), £10.2bn in February 2024 (£1.6bn more than the monthly average), and £17.3bn in March 2024 (£8.7bn more than the monthly average).

This pattern is a stubbornly consistent feature of the public finances in the UK, even after numerous attempts within government to improve capital budgeting and delivery processes. For example, departments are able to carry over some of their capital budgets to future years, which in theory should reduce the incentive to spend every last penny of their allocation in-year. The new spending review process coming into force this summer should also help by setting out a four-year capital budget for 2026/27 to 2029/30, providing much greater forward certainty for investment programmes and (in theory) reducing the concern of future budgets disappearing if the current year budget is not spent in full.

Of course, it is possible that our concerns about the quality of government’s investment delivery process are not fully justified. There could after all be some very good practical reasons as to why March is the best time of the year for carrying out public capital works!

This chart was originally published by ICAEW.

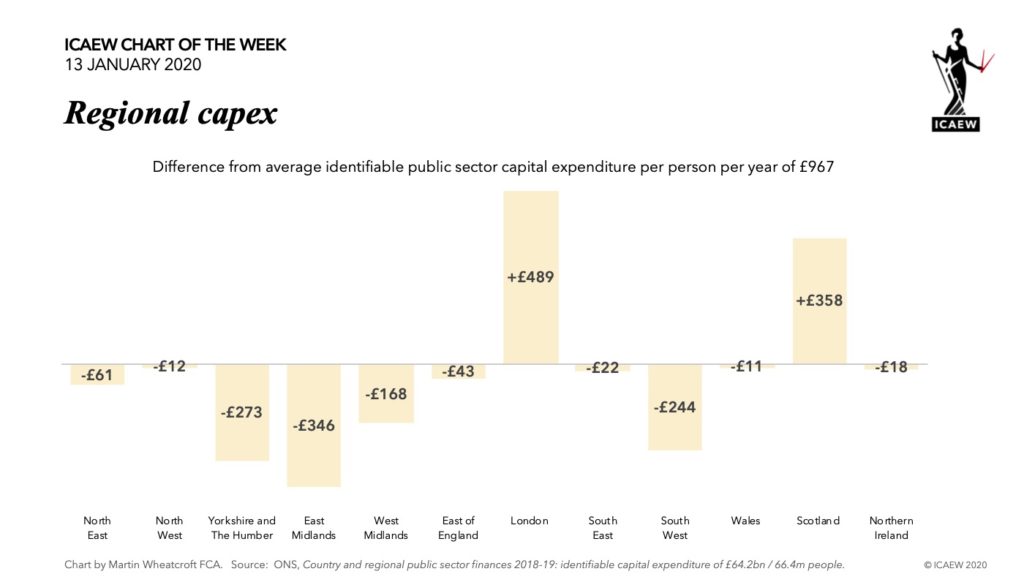
ICAEW chart of the week: Regional capex

Chart: Difference from average identifiable public sector Capex per per year of £967. See table at end of post.

The #icaewchartoftheweek this week is on the subject of public sector capital expenditure across the UK in the light of speculation that the Spring Budget in March will feature a significant boost to capital spending in the North of England.

We thought it might be interesting to look at the most recent data; albeit the usual caveats apply to the numbers given the lack of formal systems in government to fully track expenditure by region and the differences between capital expenditure in the fiscal numbers (shown in the chart) and the capital expenditure reported in the (as yet unpublished) Whole of Government Accounts for 2018-19.

According to the ONS, there was £64.2bn in capital expenditure that can be identified by nation and region of the UK, an average of £967 for the 66.4m people living in the UK in 2018-19.

It is perhaps not surprising that there is more capital spending in London than the per capita average given that the millions of commuters and visitors that add to the 8.9m local population every day. However, the scale of the difference is substantial with £13bn invested in 2018-19, an average of £1,456 per person – £489 more than the UK average.

Of course, variations in capital expenditure are to be expected across a country of the size of the UK given the different natures and needs of each region and nation. For example, Scotland’s much higher level of per capita public capital expenditure (£7.2bn / 5.4m people = £1,325 per person) needs to be seen in the context that it comprises a third of the land area of the entire UK, but only has 8% of the population.

The region that incurs the least capital expenditure on a per capita basis is the East Midlands, where £3.0bn was spent in 2018-19, an average of £621 per person (£346 less than the average) for each of the 4.8m people living there. This is followed by Yorkshire and The Humber (£694 per person), the South West (£723) and the West Midlands (£799).

Most of the other regions are close to the average, including (perhaps surprisingly given some of the headlines), the North East and the North West.

One question that does come to mind – if Government’s intention is to rebalance regional inequalities by investing more in the ‘Northern Powerhouse’ and the ‘Midlands Engine’, will it have anything to spare for the ‘Great South West’ too?

2018-19
Capex

Population
Per
capita
Difference
from average
North East£2.4bn2.7m£906-£61
North West£7.0bn7.3m£955-£12
Yorkshire and The Humber£3.8bn5.5m£694-£273
East Midlands£3.0bn4.8m£621-£346
West Midlands£4.7bn5.9m£799-£168
East of England£5.7bn6.2m£924-£43
London£13.0bn8.9m£1,456+£489
South East£8.6bn9.1m£945-£22
South West£4.0bn5.6m£723-£244
Wales£3.0bn3.1m£956-£11
Scotland£7.2bn5.4m£1,325+£358
Northern Ireland£1.8bn1.9m£949-£18
United Kingdom£64.2bn66.4m£967

Source: ONS, Country and regional public sector finances 2018-19: identifiable capital expenditure.

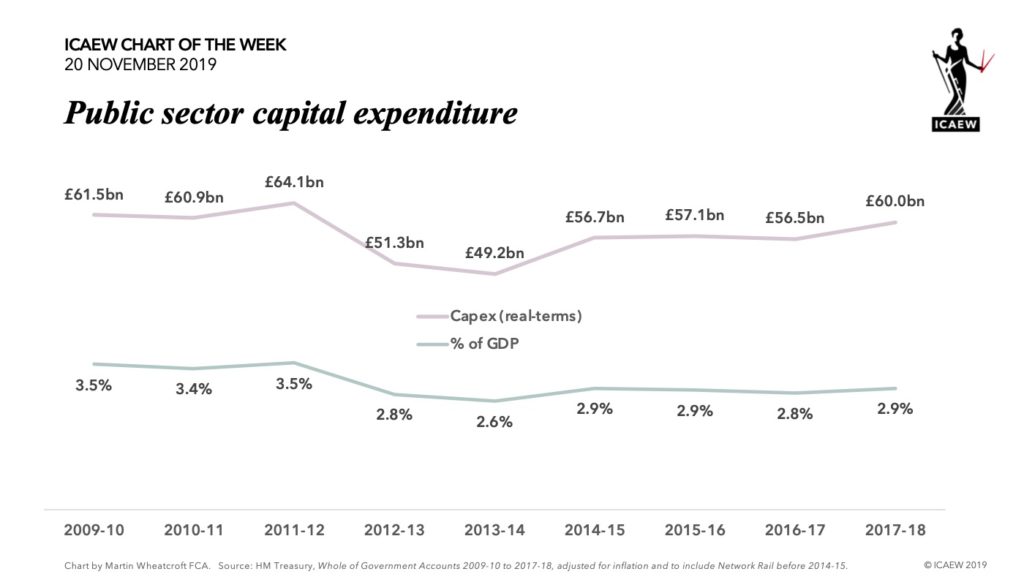
ICAEW chart of the week: Public sector capital expenditure

Chart: Capex (real-terms) £61.5bn (3.5% of GDP) in 2009-10, to £64.1bn in 2011-12, down to £49.2bn (2.6%)  in 2013-14, up to £60.0bn (2.9%) in 2017-18.

With apologies for the delay because of being away, this week’s #ICAEWchartoftheweek is on public sector capital expenditure (capex), something that all the political parties in the #GE2019 have promised to increase – in some cases by very significant amounts! 

As part of ICAEW’s It’s More Than A Vote campaign, ICAEW will be analysing the political party manifestos over the next few weeks, including the potential implications for the public finances.

One area that all the major parties appear to agree on is the need to increase investment in infrastructure and other assets, which is why we thought we would look at the last nine years of capital expenditure reported in the Whole of Government Accounts (WGA), prepared under International Financial Reporting Standards. This differs from public sector investment in the National Accounts, with the latter including capital grants and other transactions that do not result in the creation of publicly-owned fixed assets.

As the chart illustrates, capital expenditure in 2017-18 of £60.0bn was lower than the £64.1bn incurred in 2011-12 after adjusting for inflation and to include Network Rail, the government owned railway infrastructure company prior to 2014-15 when it was incorporated into the WGA). As a proportion of the economy, capex in 2017-18 was 2.9% of GDP, a smaller ratio than the 3.5% calculated for 2011-12.

Only around £16bn (0.8% of GDP) of the amount spent in 2017-18 went into infrastructure assets (principally transport infrastructure such as roads and railways), with in the order of £24bn (1.2%) going into land & buildings, including hospitals and schools. Approximately £9bn (0.4%) was spent on military equipment, with the balance of £11bn (0.5%) invested in other public sector assets, ranging from tangible fixed assets such as plant & equipment, IT hardware, vehicles and furniture & fittings, as well as intangible fixed assets such as software.

Capex comprises a relatively small proportion of total expenditures (capital and non-capital) of £1.0tn reported in the WGA for 2017-18. As a consequence, even relatively small incremental amounts will constitute proportionately large increases in capital budgets in the next few years.

Whether these plans will be deliverable is another question, given that traditionally the government has struggled to spend all its capital budgets, not to mention the difficulties there will be in finding all the workers necessary for a major expansion in construction activity.

It’s More Than A Vote