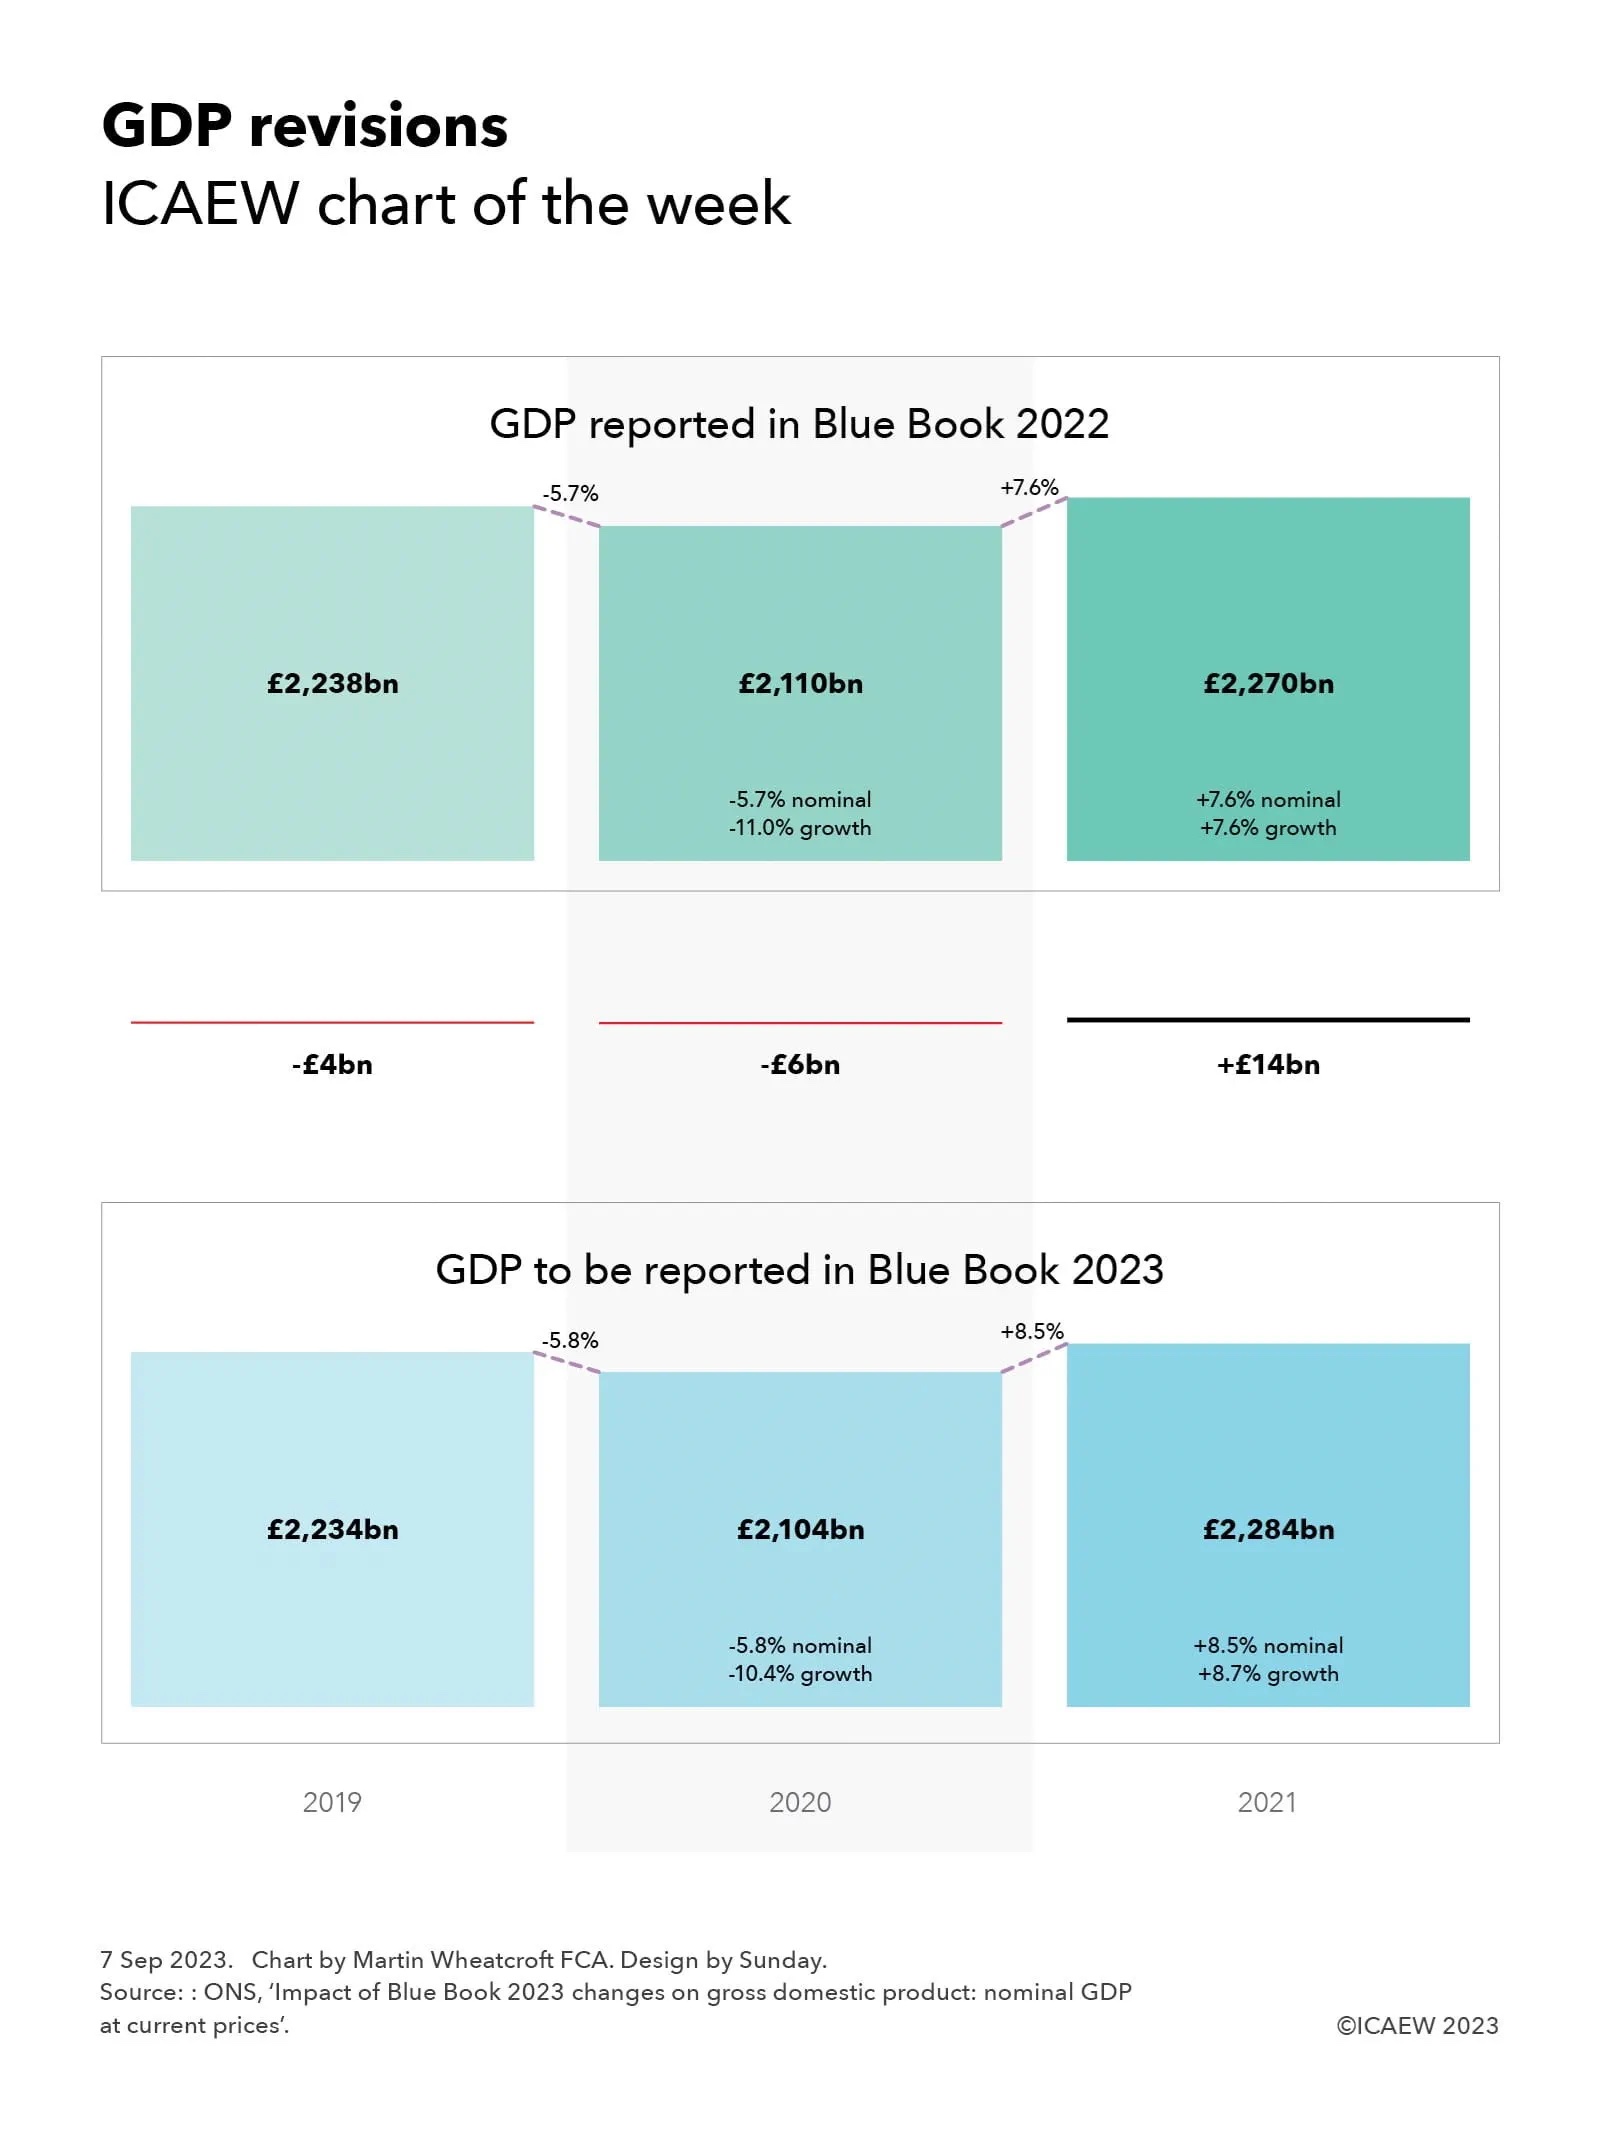
My chart this week looks at the 1.5% drop in the number of VAT- and PAYE-registered businesses in the year to 31 March 2023.
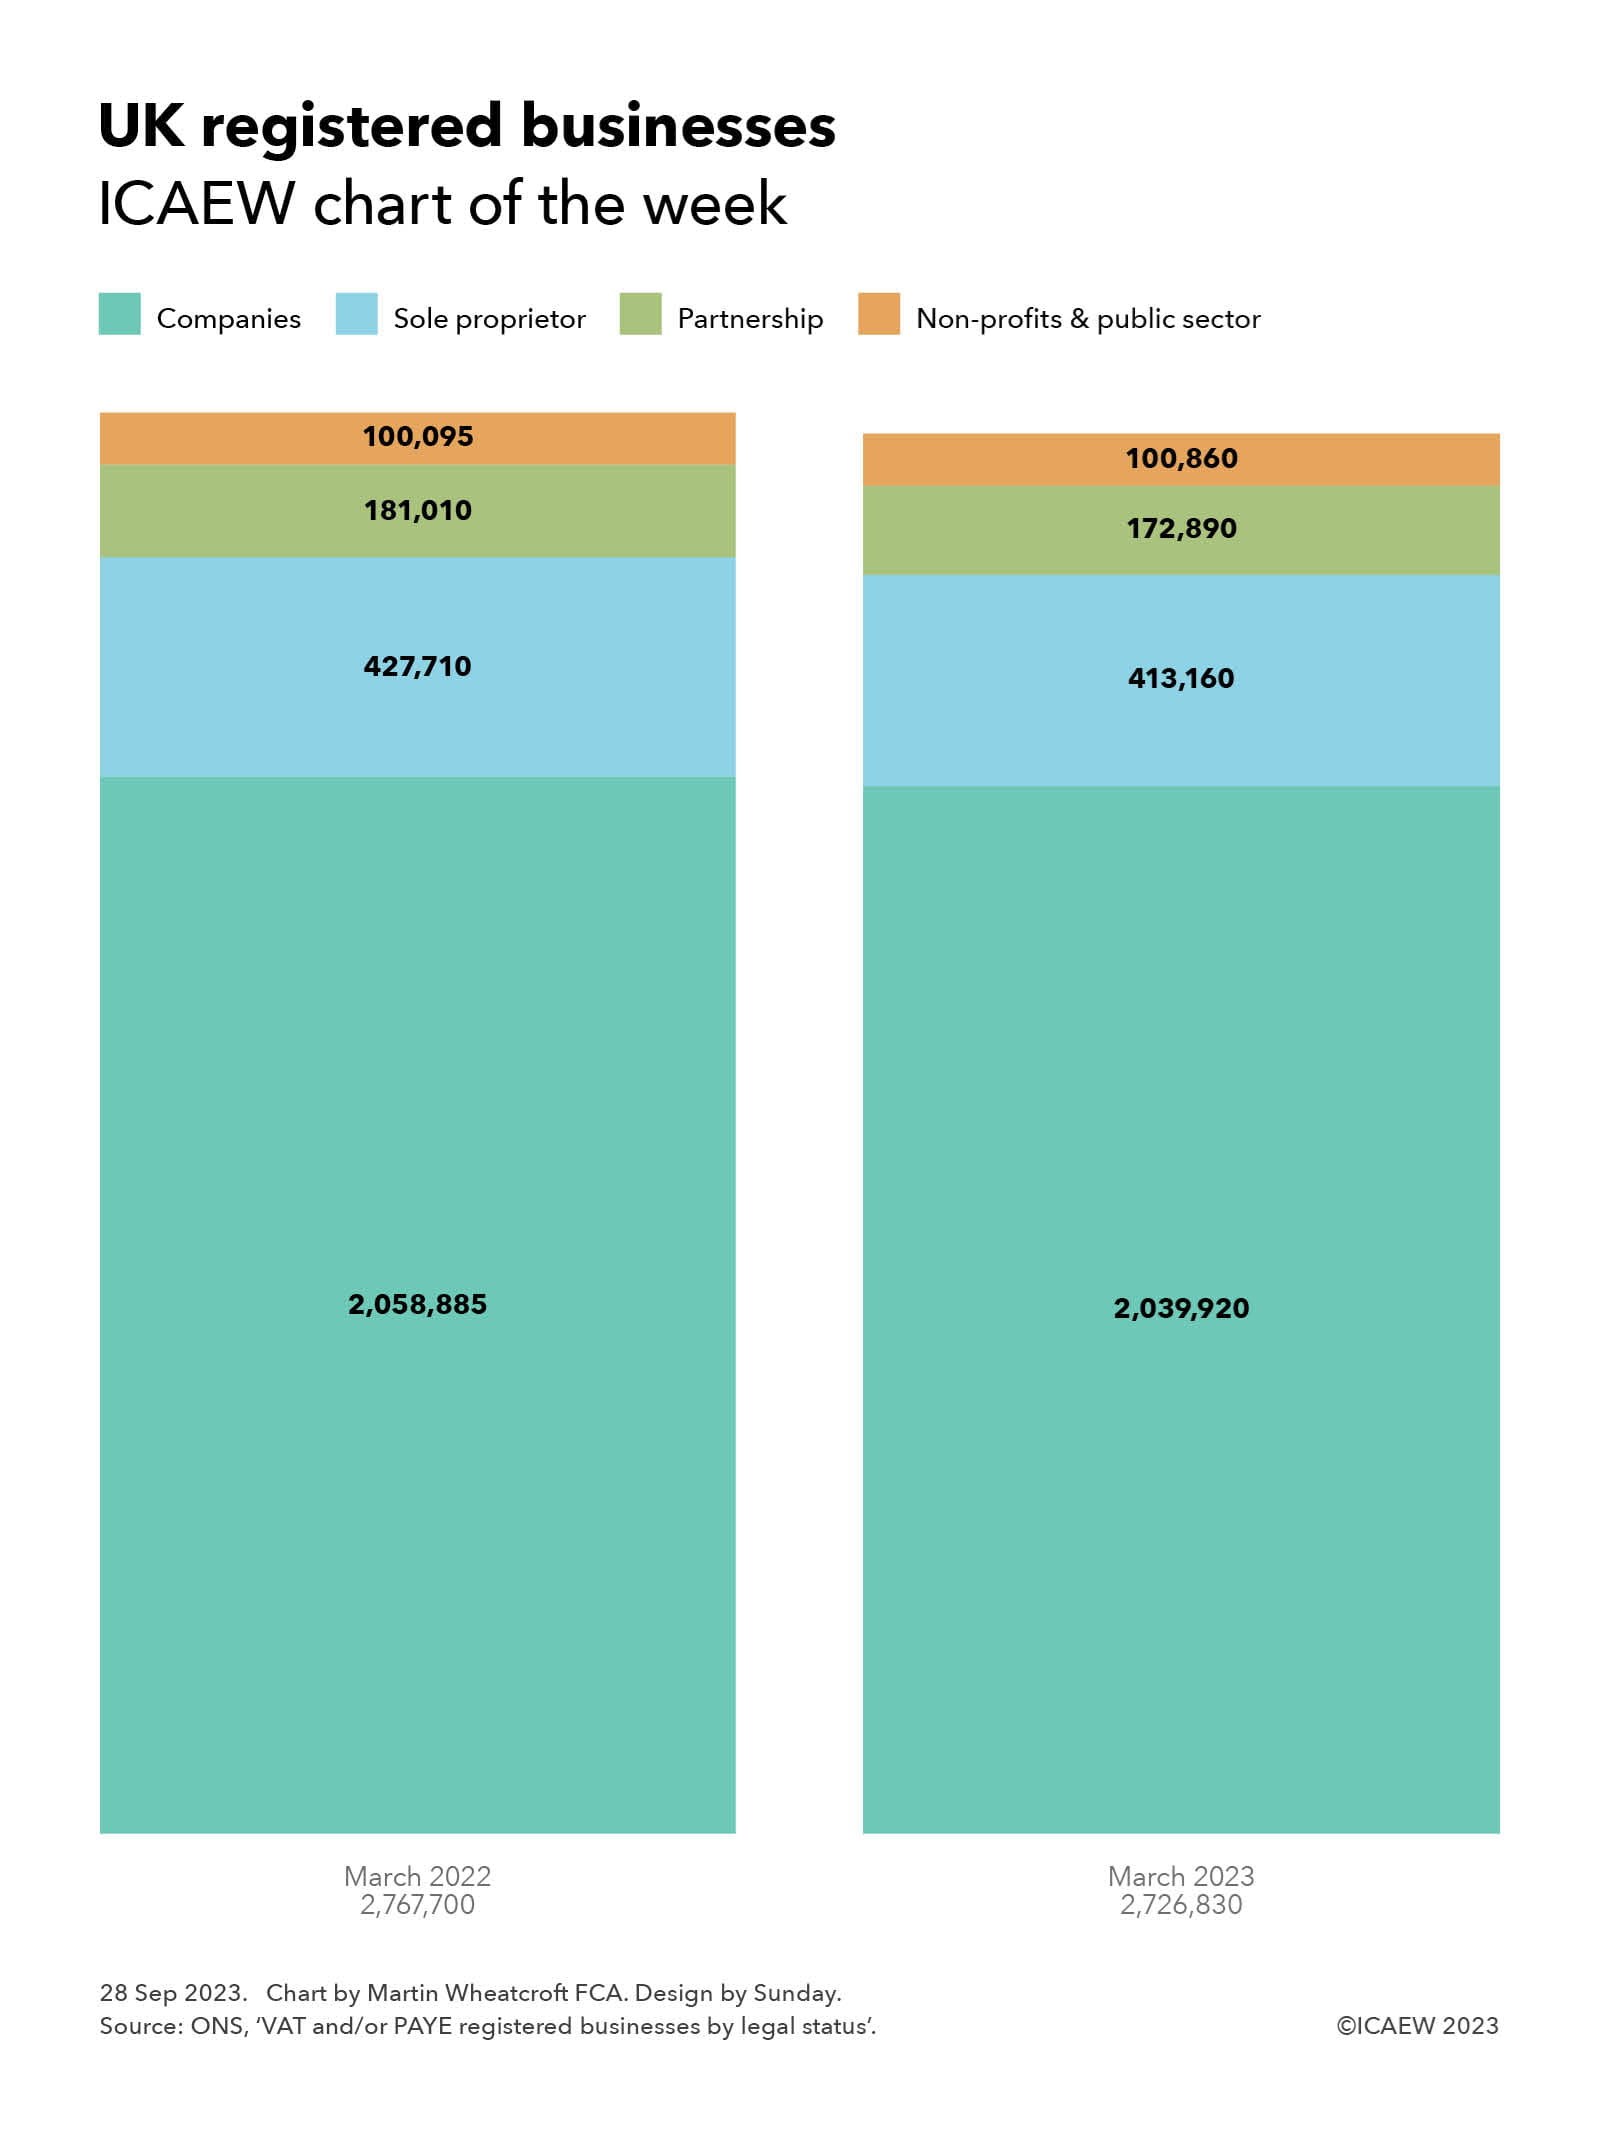
On 27 September 2023, the Office for National Statistics (ONS) published data on the 2,726,830 businesses that were registered for VAT and/or PAYE in the UK as of March 2023, a 1.5% fall from the 2,767,700 businesses that were registered a year previously.
As illustrated by our chart this week, the number of VAT- and PAYE-registered companies fell by 0.9% from 2,058,885 to 2,039,920, sole proprietorships fell by 3.4% from 427,710 to 413,160, and partnerships fell by 4.5% from 181,010 to 172,890.
Bucking the trend were non-profit bodies, mutual associations and public sector organisations, which rose by 0.8% from 100,095 to 100,860. The latter comprised 88,375 non-profit bodies and mutuals, 9,030 local authority entities, 3,280 central government entities and 175 public corporations and other publicly owned businesses, as of March 2023.
Not shown in the chart are in the order of 2.8m ‘unregistered’ businesses that are not registered for VAT or PAYE. Most of these are self-employed individuals, sole traders, or one-person companies that generate revenue below the VAT threshold of £85,000 and do not have any payrolled employees.
The number of registered businesses in March 2023 by industry group are comprised as follows:
- 415,250 professional, scientific and technical (down 3.7% on March 2022);
- 402,165 motor trades (-2.8%);
- 377,585 construction (+0.7%);
- 226,285 business administration and support services (-1.1%);
- 187,360 information and communication (-4.5%);
- 184,420 arts, entertainment, recreation and other services (+2.0%);
- 174,830 accommodation and food services (-0.2%);
- 151,710 production (-1.8%);
- 141,390 agriculture, forestry and fishing (-0.8%)
- 128,600 transport and storage including postal (-6.9%);
- 113,785 (+2.8%) property, 109,095 health (+2.8%);
- 59,210 finance and insurance (-2.0%);
- 47,340 education (+1.3%); and
- 7,805 public administration and defence (+0.4%).
There were 2,115,105 businesses with between zero and four employees as of March 2023, followed by 313,780 (five to nine employees), 157,955 (10-19), 86,285 (20-49), 27,660 (50-99). 15,135 (100-249) and 10,910 (250+).
By turnover band, the numbers as of March 2023 were: 445,020 (£0-£49,999); 563,610 (£50,000-£99,999); 846,615 (£100,000-£249,999); 367,315 (£250,000-£499,999); 222,155 (£500,000-£999,999); 123,995 (£1m-£2m); 85,655 (£2m-£5m); 32,100 (£5m-£10m); 29,080 (£10m-£50m); and 9,285 (£50m+).
The fall in the number of businesses in 2022/23 is perhaps not surprising given the significant amount of support provided to many businesses during the pandemic, which will have delayed the normal process of business closure during the previous two years. Meanwhile, the cost-of-living and energy crises will have also made it difficult for some businesses to survive in the year to March 2023. Even though energy prices have come down, the cost-of-living crisis and consequent reductions in consumer demand could see further businesses fail during 2023/24.
Find out more: ONS: UK business – activity, size and location 2023.