My chart for ICAEW this week looks at how climate change is now expected to make the OBR’s dire predictions for the public finances even worse.
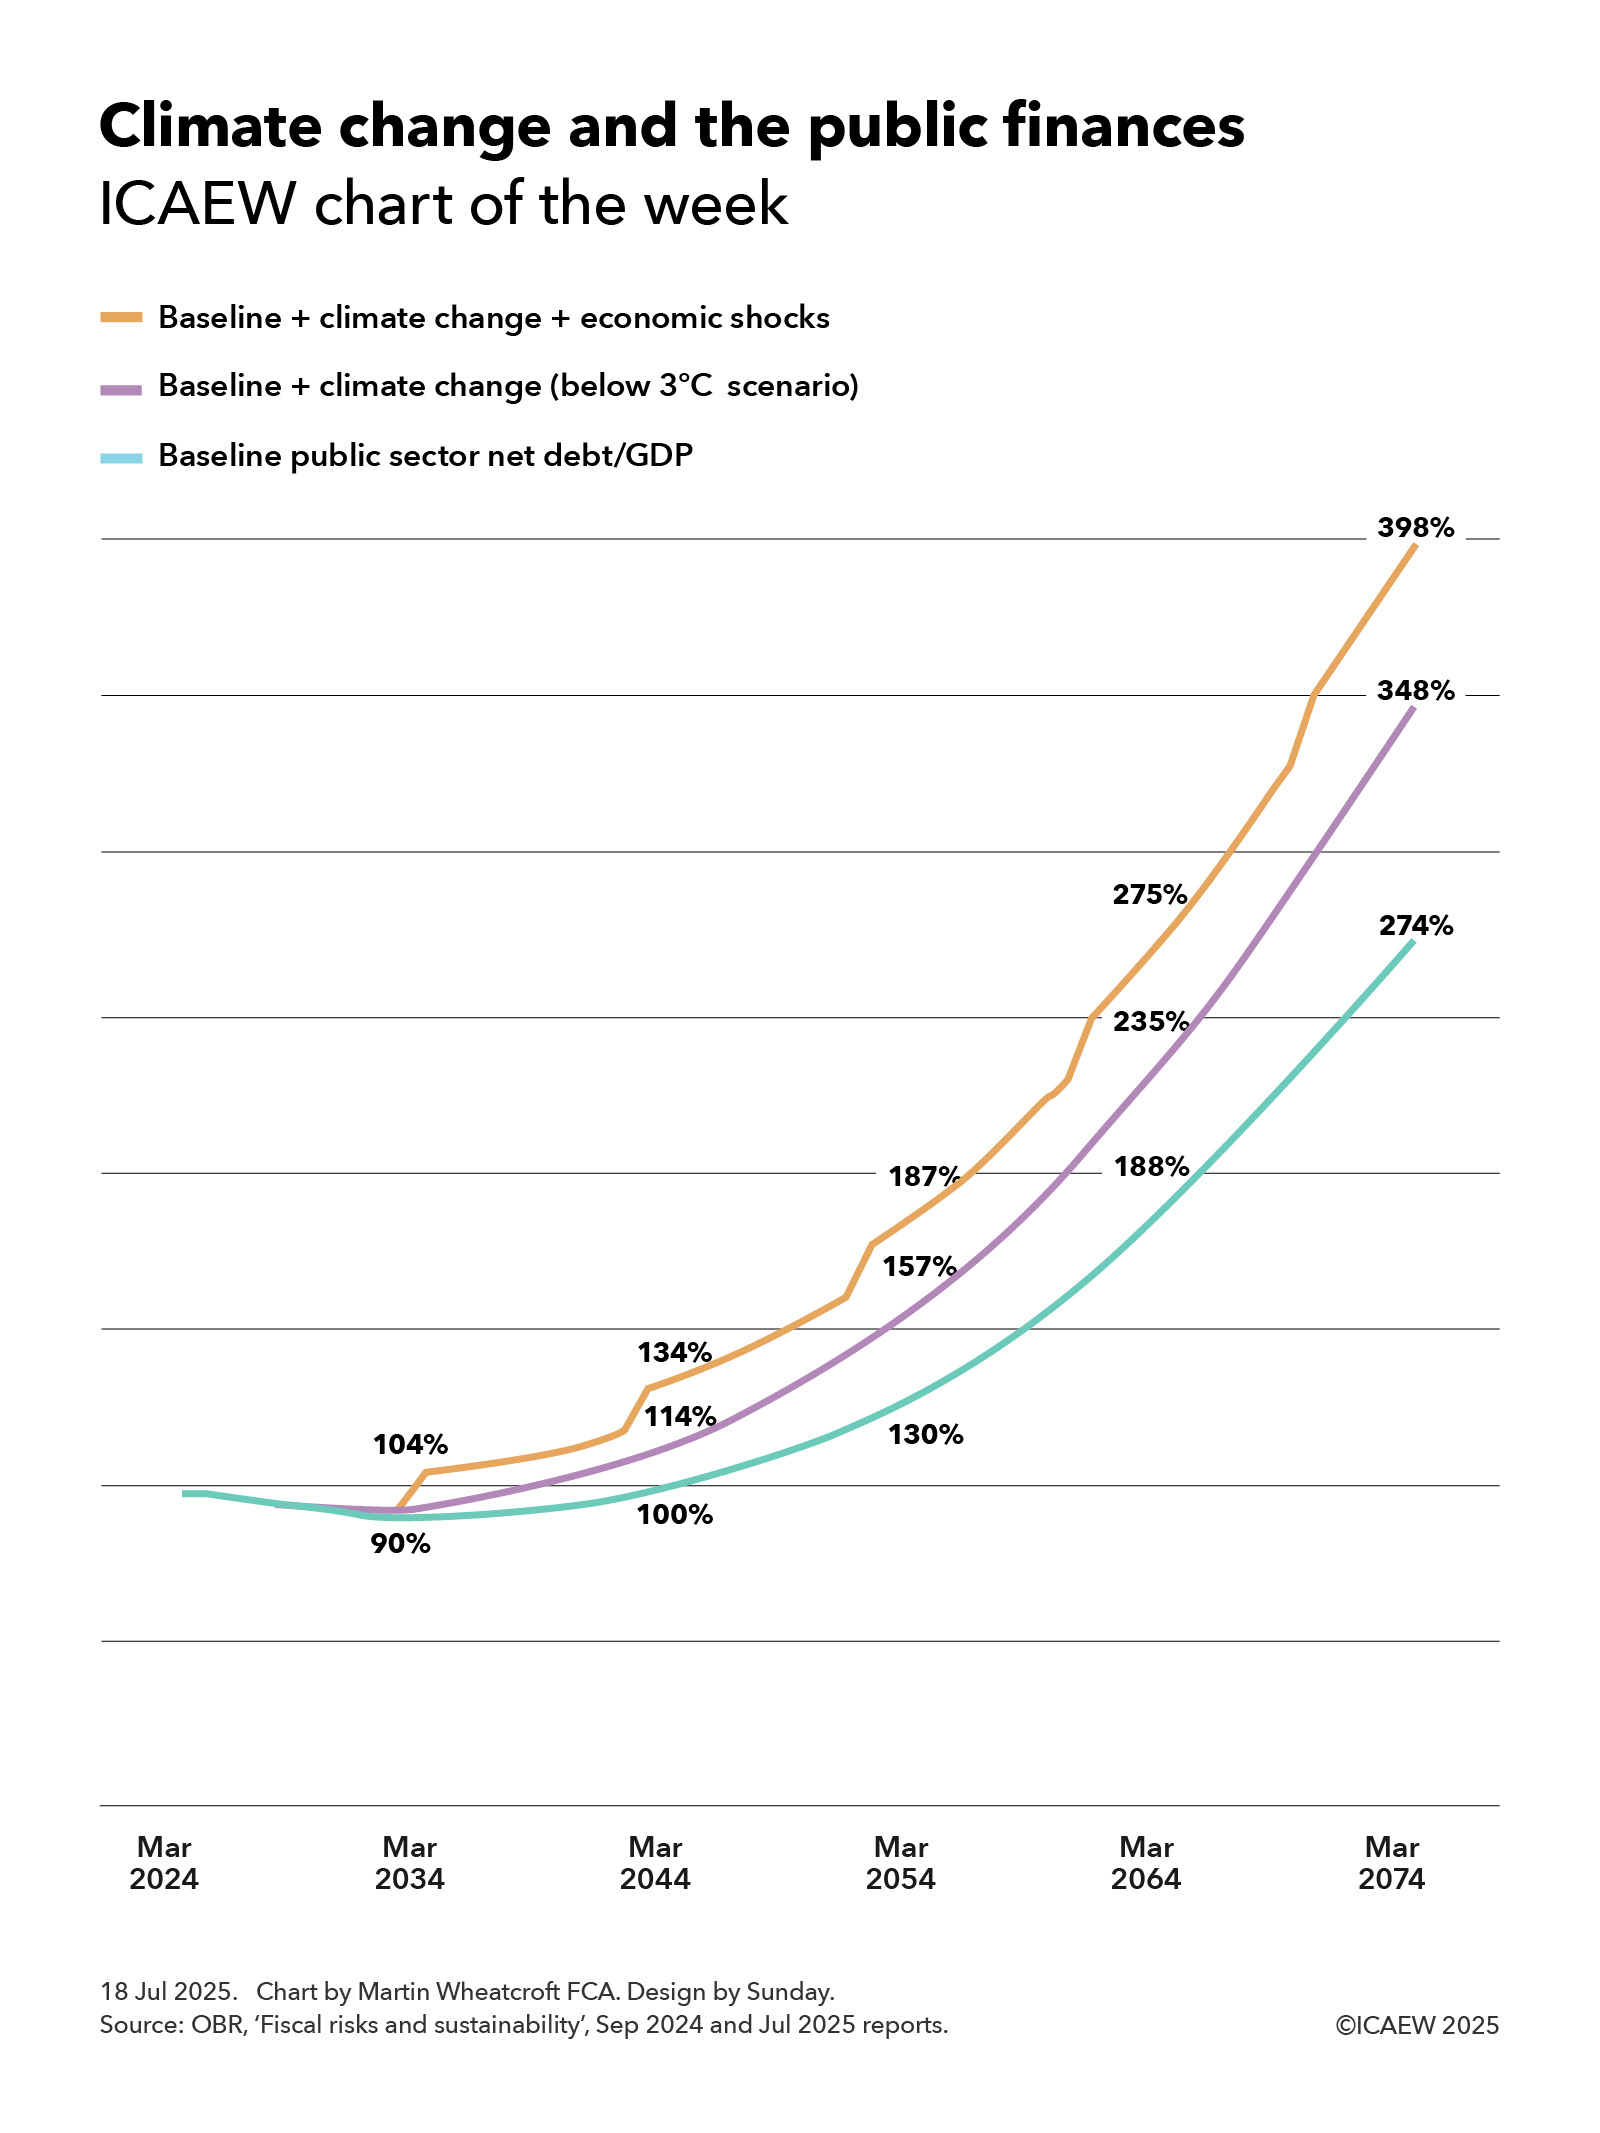
ICAEW’s chart of the week is on climate change this week, illustrating how it could add a further 74 percentage points to the Office for Budget Responsibility (OBR)’s already disheartening baseline projection for public sector net debt of 274% of GDP to reach 348% of GDP, or potentially 398% if economic shocks are included.
The baseline projection, published by the OBR in September 2024, showed public sector net debt as a proportion of the size of the economy falling from just under 100% of GDP to 90% of GDP in March 2034 and then rising to 100%, 130%, 188% and 274% of GDP in March 2044, 2054, 2064 and 2074 respectively.
One of the main drivers of the baseline projection is the expected rise in spending on pensions, health and social care as more people live longer, sometimes less healthy lives, combined with a falling fertility rate that means there will be proportionately fewer working age adults to pay the taxes needed to fund that rise.
Incorporating the OBR’s new central projection for climate change, public sector net debt would be 94% of GDP in March 2034 (not shown in the chart because of a lack of space between lines) and then 114%, 157%, 235% and 348% of GDP in March 2044, 2054, 2064 and 2074 respectively. Adding potential economic shocks on top would increase the projection for public sector net debt/GDP to 104% in March 2034 rising to 134%, 187%, 275% and then 398% in March 2074.
The September 2024 baseline projection included the loss of fuel duty receipts from the phasing out of petrol and diesel vehicles between now and 2050, but the OBR in its recent July 2025 fiscal and sustainability report has looked in more detail at both the incremental costs of transitioning to net zero and the damage that is likely to result from a much warmer and wetter climate in several different scenarios.
OBR’s central ‘below 3°C’ scenario is based on global average temperatures rising by 2.9°C above pre-industrial levels by 2100, of which weather and other damage associated with a much warmer and wetter climate is projected to add 17 percentage points to accumulated debt over the next half century from direct and indirect costs and revenue losses. Climate damage is also expected to result in slower economic growth that would add 27 percentage points over 50 years by reducing the denominator in the debt to GDP ratio. The government’s share of transition costs (including lower tax receipts from higher private sector spending) is projected to add 7 percentage points, while there is a 22 percentage point impact from the incremental debt interest that would be incurred on a higher level of debt.
This is before taking account of recessions and other potential economic shocks, which based on historical patterns are expected to add 10% of GDP to public sector net debt every decade or so.
The chart does not reflect other risks identified by the OBR in its latest report, where it reports that the exposures to the public finances have increased since its assessment last year. One risk they did look at in some detail is the prospect of higher interest rates on government borrowing on the basis that demand for gilts reduces as the Bank of England winds down its holdings of gilts (quantitative tightening) and defined benefit pension schemes gradually sell their holdings of gilts to fund pension payments. This risk might be mitigated by selling shorter-dated gilts, although shorter maturities would make the public finances less resilient by increasing the amount of debt needing to be refinanced each year.
The OBR’s dismal assessment of the prospects for the public finances highlights just how difficult a financial position the UK finds itself in, with a lot to do (and some luck needed) if it is to be restored to a sustainable path. At the same time, the costs of climate change are now becoming that much more apparent as extreme weather events and other climate-related costs start to show up in public finance and insurance data.
For more information about the role of the accountancy profession in climate change, visit ICAEW’s climate hub.
My chart for ICAEW this week highlights how the number of pensioners in the UK is expected to increase by 14% over the next 10 years. This will have major implications for the public finances.
The Office for National Statistics (ONS) published its latest population projections for the UK on 28 January 2025.
Extrapolated from the 2021 Census in England, Wales and Northern Ireland and the 2022 Census in Scotland, the ONS’s principal projection is for the UK population to increase by 5% over the next decade from a projected 69,868,000 in June 2025 to 73,426,000 in June 2035. This is on the basis of 132,000 more deaths than births in total over the next 10 years (6,979,000 versus 6,847,000) and net inward migration of 369,000 a year on average.
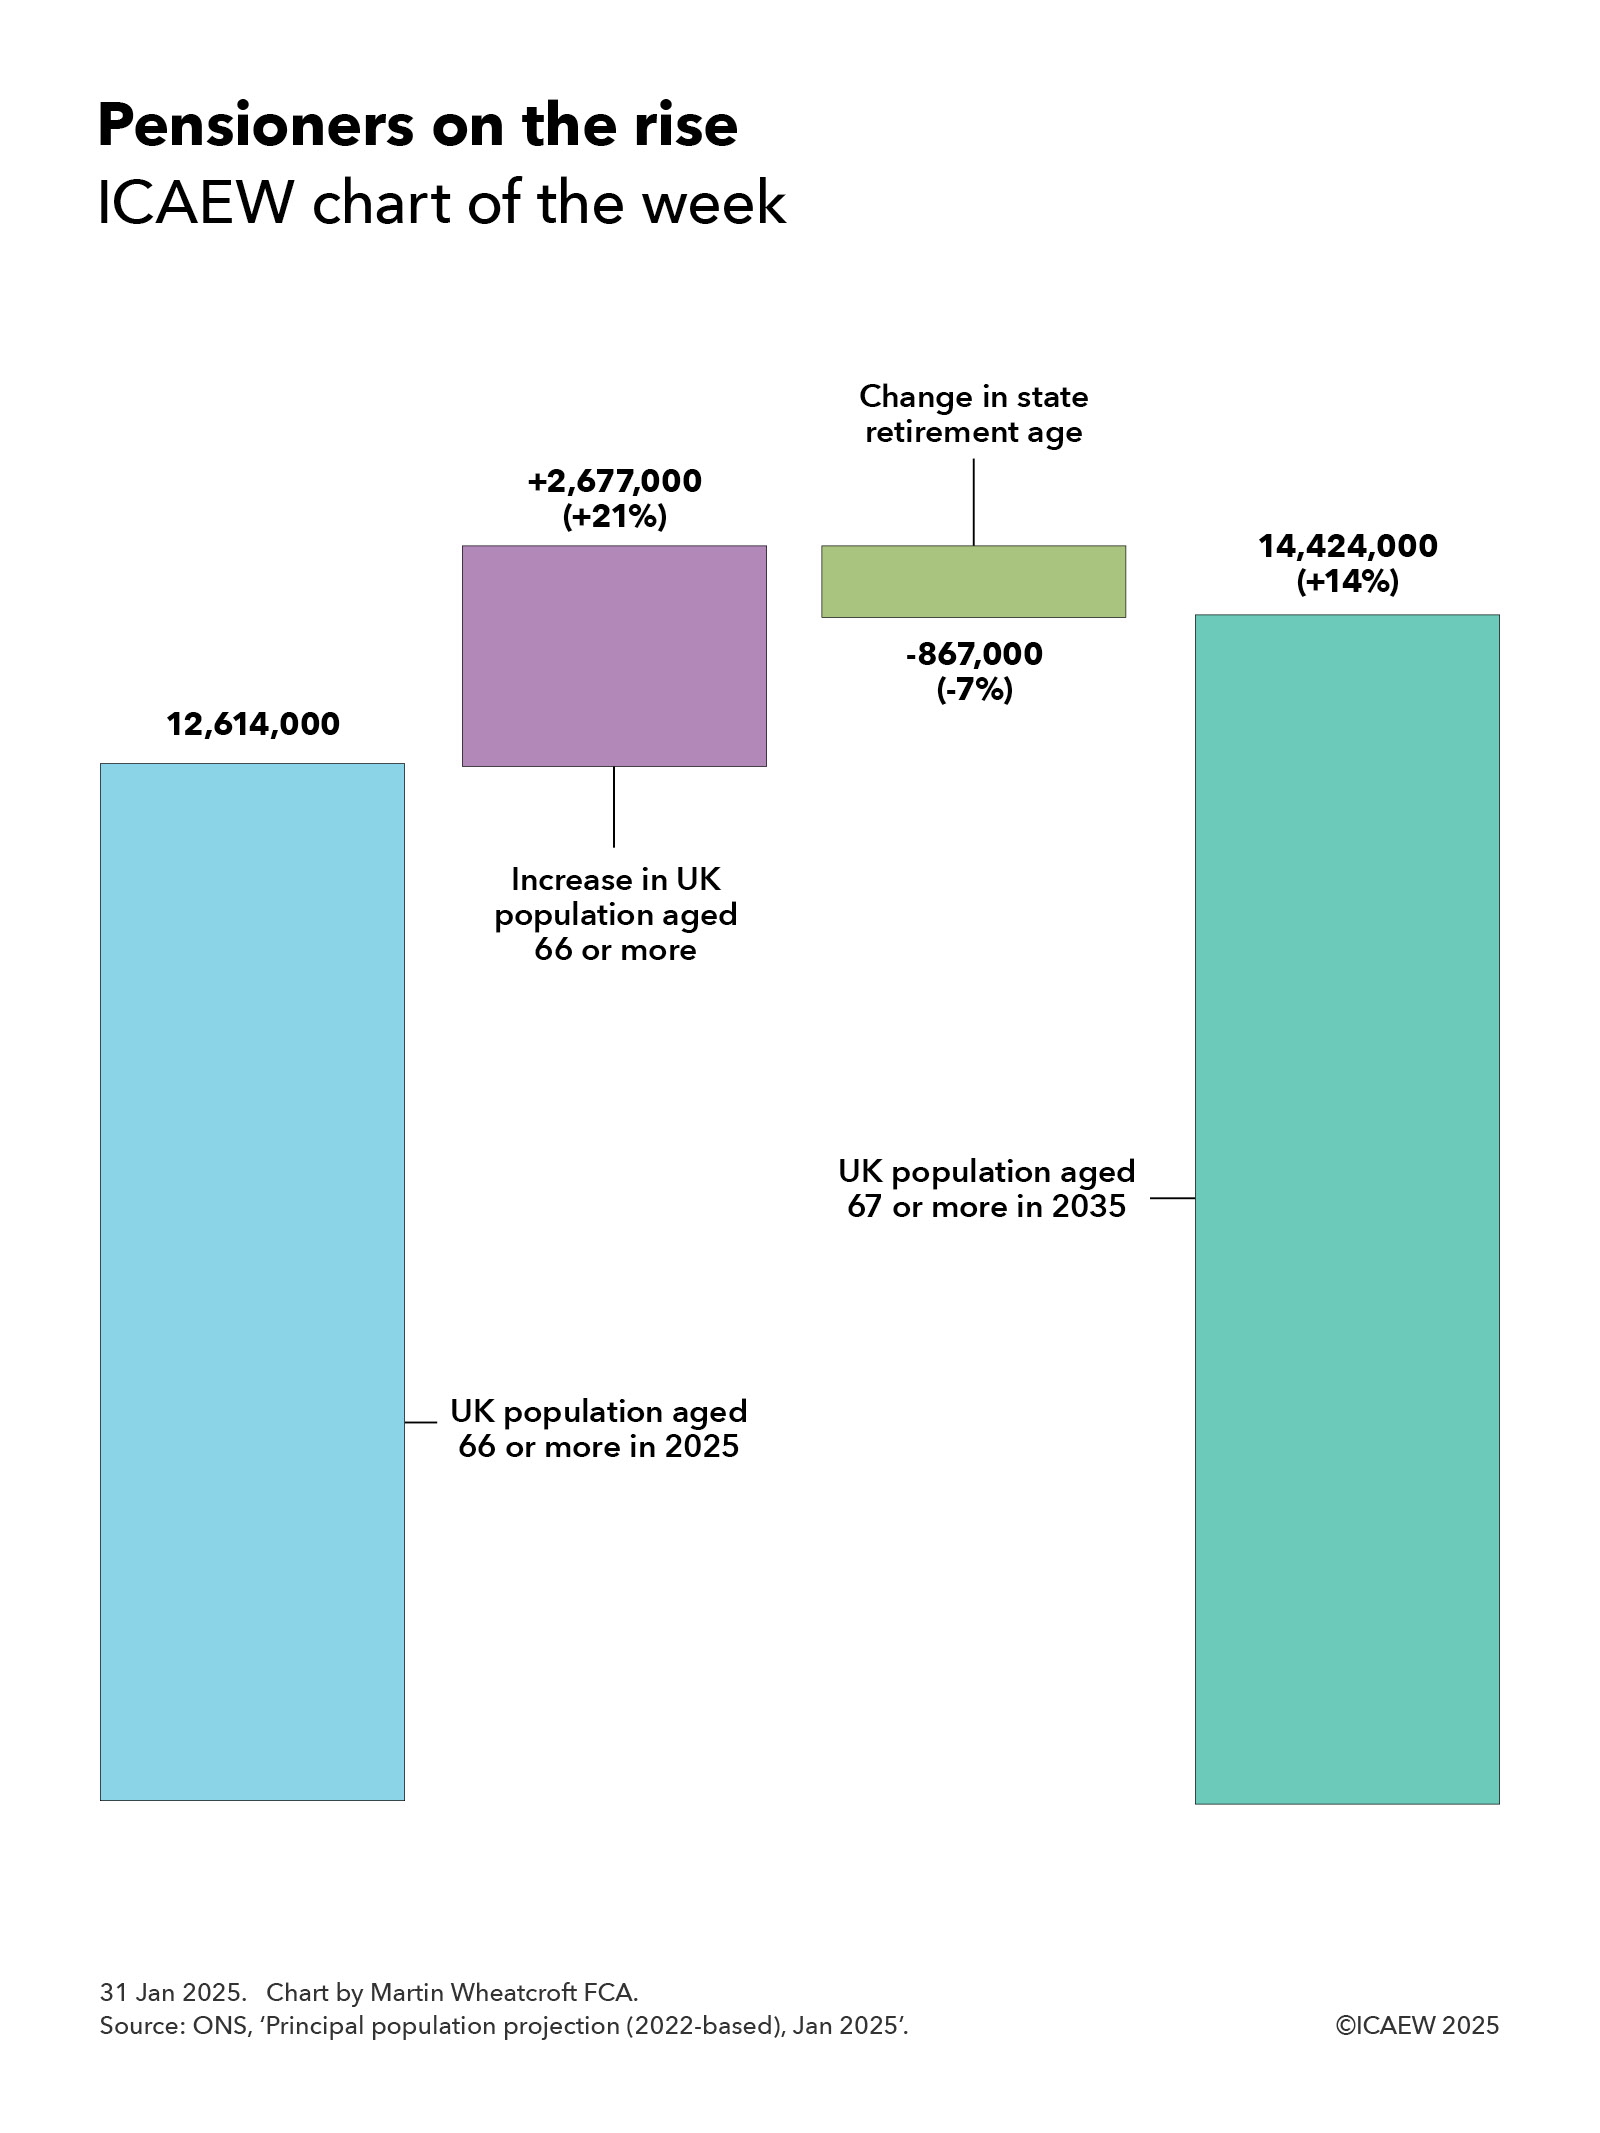
Our chart highlights how the number of pensioners is expected to increase by 14% over the next 10 years, from a projected 12,614,000 this summer to 14,424,000 in 2035, despite an increase in the state retirement age from 66 to 67.
The main driver of this increase is an additional 2,677,000 people aged 66 or more, reflecting 8,522,000 people passing the age of 66 over the 10 years to June 2035, plus 28,000 from net inward migration (119,000 in and 91,000 out), less 5,873,000 deaths
This 21% increase is partially offset by a 7% reduction for the 867,000 66-year-olds who will still be waiting for their state pension in June 2035 as a result of the planned rise in the state retirement age from 66 to 67 between 2026 and 2028.
Over the same period the ONS is projecting a 7% fall in the number of children from 12,272,000 in June 2025 to 11,434,000 in June 2035, and a 6% increase in the size of the working age population from 44,982,000 to 47,569,000. The latter would have been a 4% increase if not for the statutory increase in the state pension age to 67.
The ONS stresses that its national population projections are not forecasts and do not attempt to predict potential changes in international migration in particular. It also notes that demographic assumptions for future fertility and mortality are based on observed demographic trends, which is no guarantee that these trends might not change in the future.
Despite those caveats, the projected increase in the number of pensioners is one of the more likely areas of the projections to turn into reality. This is because almost all of those future pensioners are alive today and already living in the country, while mortality rates tend to change gradually over time.
A much more significant factor relates to the ONS’s long-term assumption for net inward migration of 340,000. While this is unlikely to affect the anticipated number of pensioners in a decade’s time, it will have a significant impact on the projected ratio between the number of pensioners and those of working age.
Either way, the projected rise in the number of pensioners compared with the size of the working-age population over the coming decade will have major implications for the public finances.
Tax receipts will fall proportionately as retirees leave the workforce faster than new workers join. State pension payments will increase, even before taking account of the ratchet effect of the pension triple-lock on the amount payable to each pensioner. Health care and adult social care costs will rise substantially given how skewed these costs are to older generations. And pension credit, housing benefit and other welfare benefits that go to poorer pensioners are also likely to increase.
Successive governments, including the current administration, have worked on the basis that they should be able to afford the higher costs of many more people living for longer in retirement through a combination of gradual rises in the state pension age (long hoped for but not delivered), higher levels of economic growth, and cuts in other areas of public spending such as the defence budget.
With the number of pensioners increasing much faster than the government can raise the state pension age (given the decade or more advance notice that needs to be given), relatively low levels of economic growth even in more optimistic scenarios, calls for an increase in the defence budget and significant cost pressures affecting many other public services, the big question will be the extent to which taxes will have to go up even further over the next 10 years if the promises made by successive governments over the last century are to be kept.
My chart for ICAEW this week divides some very big numbers for the public finances by an estimated 69.2m people living in the UK to highlight how UK public spending is now in excess of £1,500 per person per month.
According to the Autumn Budget 2024, the UK public sector expects to bring in £1,149bn and spend £1,276bn in the financial year ended 31 March 2025 (2024/25). At more than a trillion pounds a year in each case, these are very big numbers that can be difficult to comprehend.
My chart of the week attempts to make these numbers more understandable by averaging them over an estimated UK population of 69.2m for the current financial year and dividing them by 12 to arrive at per person per month equivalents (rounded to the nearest £5).
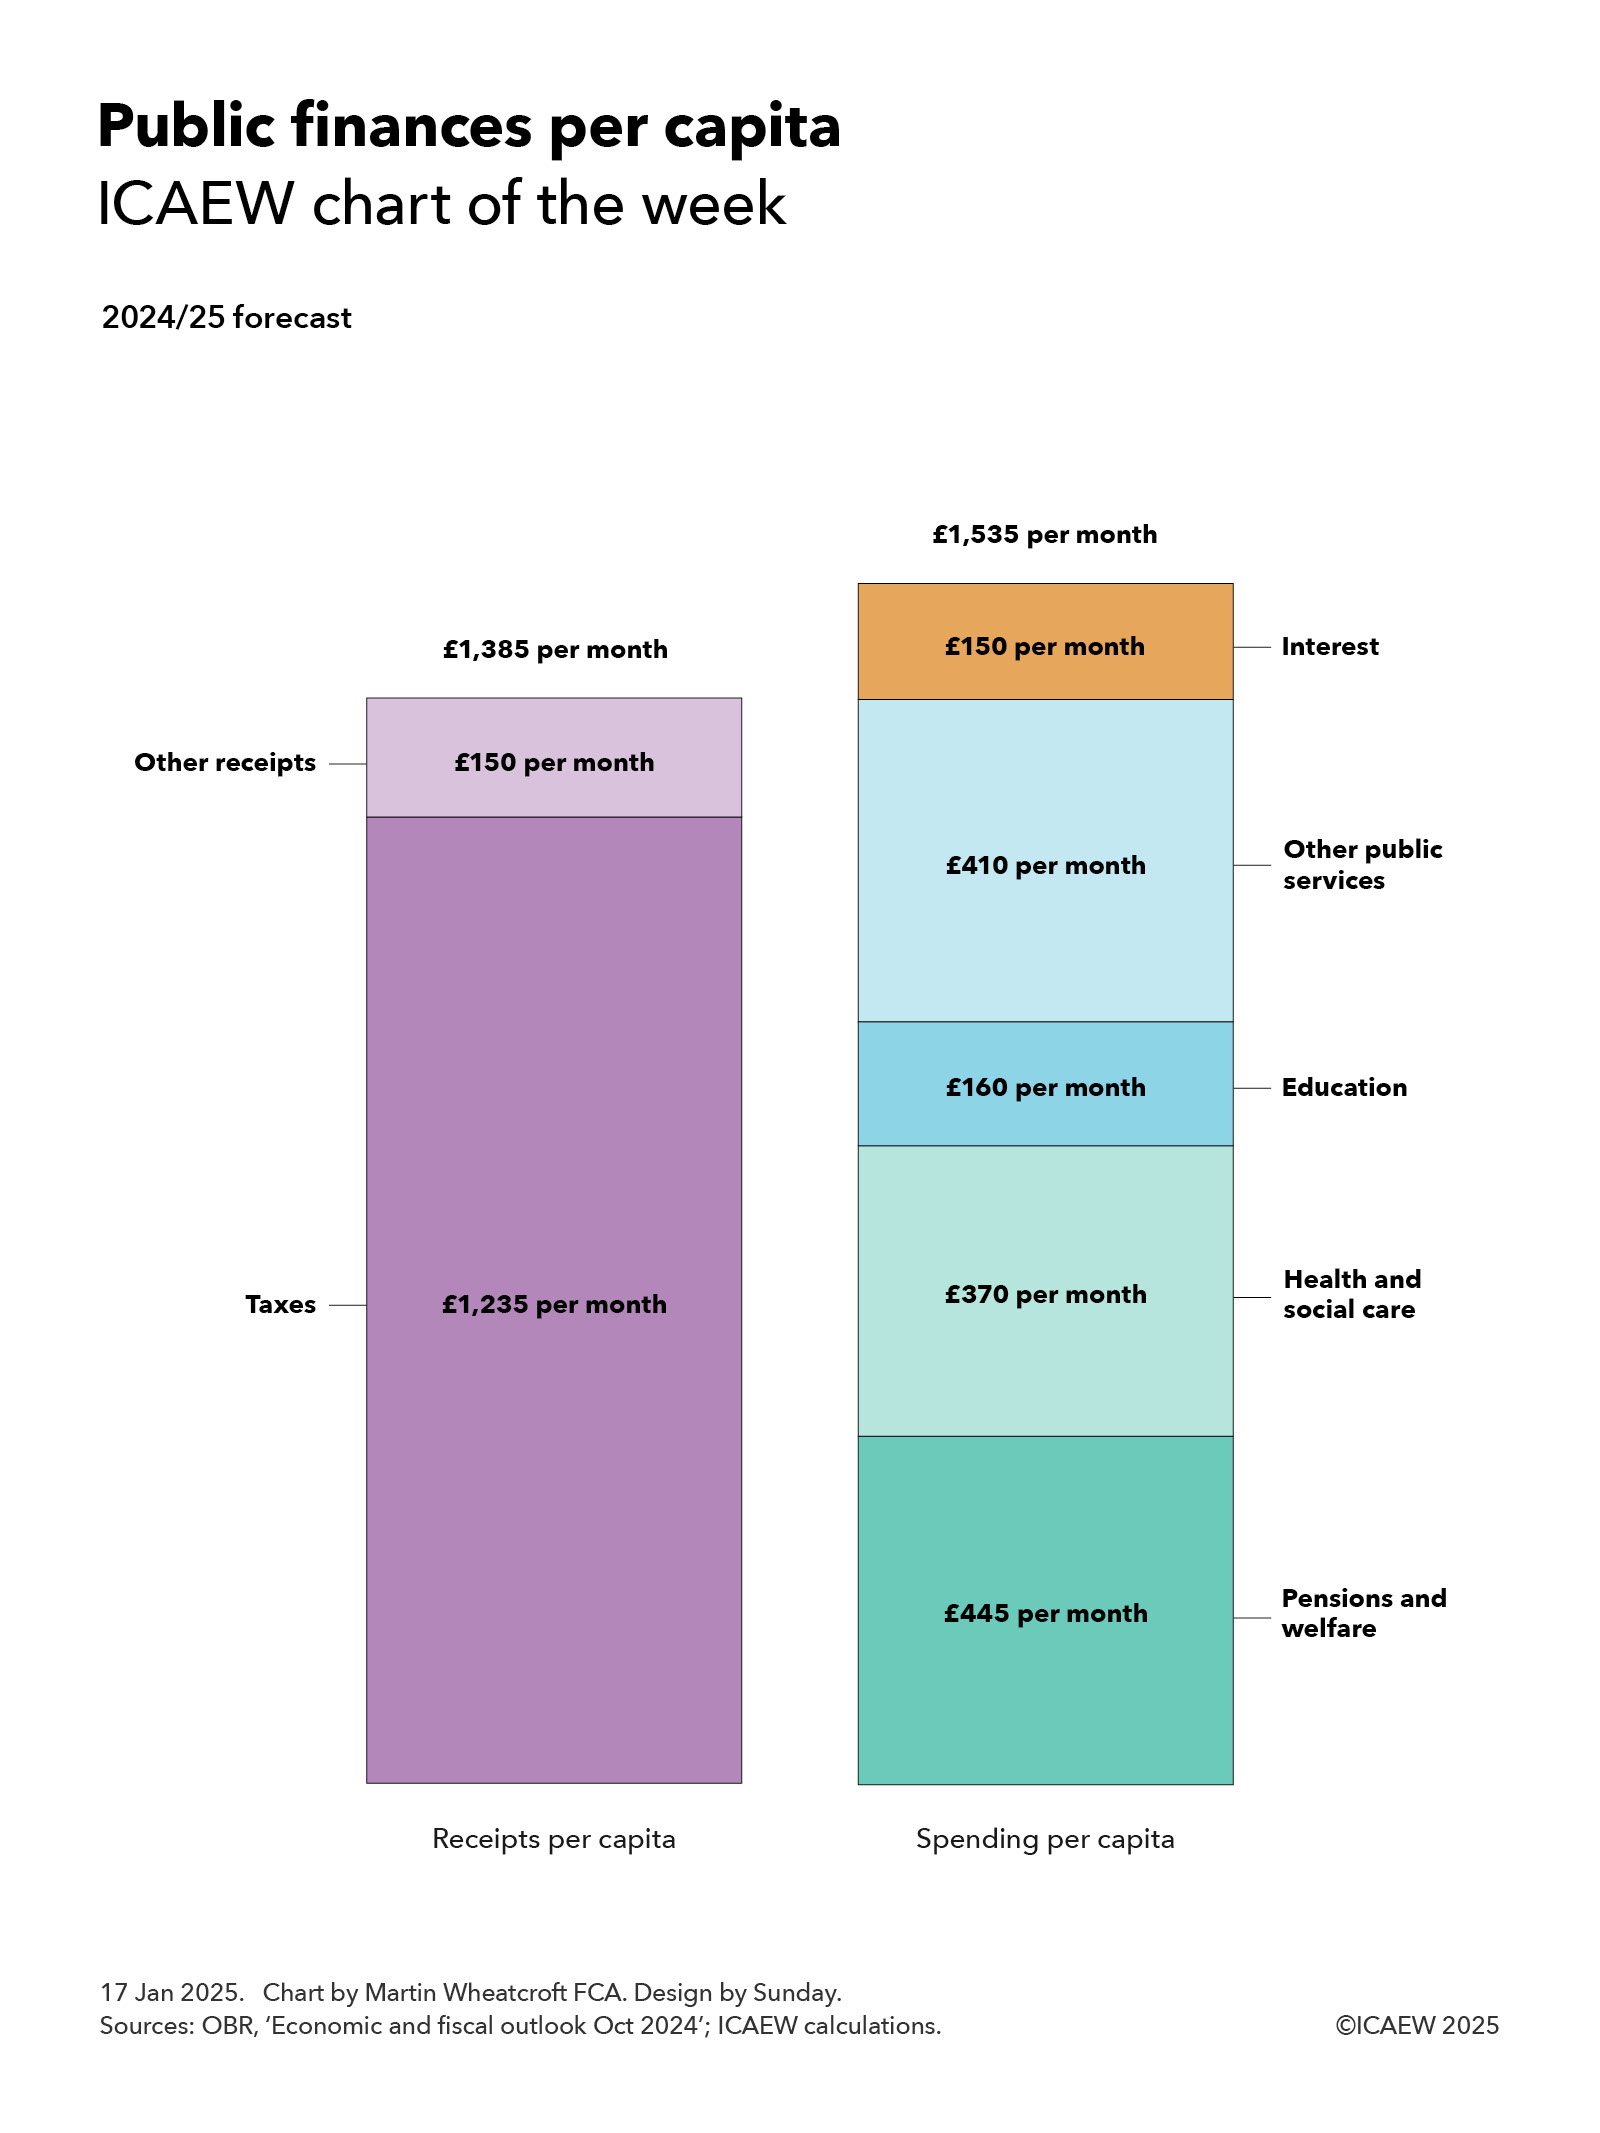
On this basis, total receipts are expected to average £1,385 per month for each person living in the UK in 2024/25, comprising £1,235 a month from tax receipts (£1,025bn in total) and £150 a month in other receipts (£124bn).
Not shown in the chart is the approximately £940 per person per month on average – just over two-thirds of total receipts – that comes from the top five taxes: income tax £375 per month, VAT £245 per month, employer national insurance £135 per month, corporation tax £120 per month, and employee national insurance £65 per month.
Public spending is expected to average £1,535 per person per month in 2024/25, comprising approximately £445 per month on pensions and welfare, £370 per month on health and social care, £160 per month on education, £410 per month on other public services, and £150 per month on debt interest, based on forecast total spending in 2024/25 of £370bn, £307bn, £134bn, £340bn, and £125bn respectively.
Spending on welfare
Welfare spending includes (but is not limited to) approximately £170 per person per month to cover the cost of paying the state pension, around £105 per month to pay for universal credit (including housing benefit), and in the order of £75 per month to fund disability and illness benefits.
Per capita spending on health and social care comprises close to £290 per person per month on the NHS, £55 on social care and £25 on public health, health research and other health-related spending.
Education costs each of us an average of £160 per month, of which approximately £115 per month pays for schools, £35 funds university and higher education (including just over £10 for student loans that are not expected to be repaid) and around £10 per month goes on further education, training and other.
The £410 per month cost of other public services includes in the region of £85 per month on defence and security, approximately £75 per month on roads and railways, £65 on industry and agriculture, nearly £60 per month on public order and safety, £15 per month on dealing with waste, and around £10 per month on international development and aid. This leaves approximately £100 per month to pay for all the other services that central and local government provide, including 11p per person per month for the Royal Family and palaces.
These numbers are averages and of course the amounts individuals pay in taxes and receive either in pensions and welfare benefits or in public services will vary significantly. For example, while health and social care spend is £370 per month when spread over the whole population, average spending on teenagers and those in their 70s are estimated to be significantly different from each other at £130 per month and £700 per month respectively.
Forecast per capita taxes and other receipts of £1,385 per month fall short of planned public spending of £1,535 per month to give rise to an expected deficit of approximately £150 per month funded by borrowing, being £127bn in total in 2024/25, divided by the estimated population of 69.2m. As a consequence, public debt now exceeds £2.8tn, equivalent to just under £41,000 for each person living in the UK, or somewhere in the region of £98,000 per household.
Navigating the public finances can be difficult at the best of times, but it is often helpful to translate the huge numbers you hear on the news into per capita equivalents to make sense of them. £1bn when spread across the UK population works at being equivalent to just over £1.20 per month.
The OBR’s latest fiscal risks and sustainability report projects that public debt could reach 274% of GDP in 50 years’ time, or 324% if likely economic shocks are included.
Our chart this week is on the long-term fiscal projections included in the Office for Budget Responsibility’s (OBR) latest fiscal risk and sustainability report published on 12 September 2024.
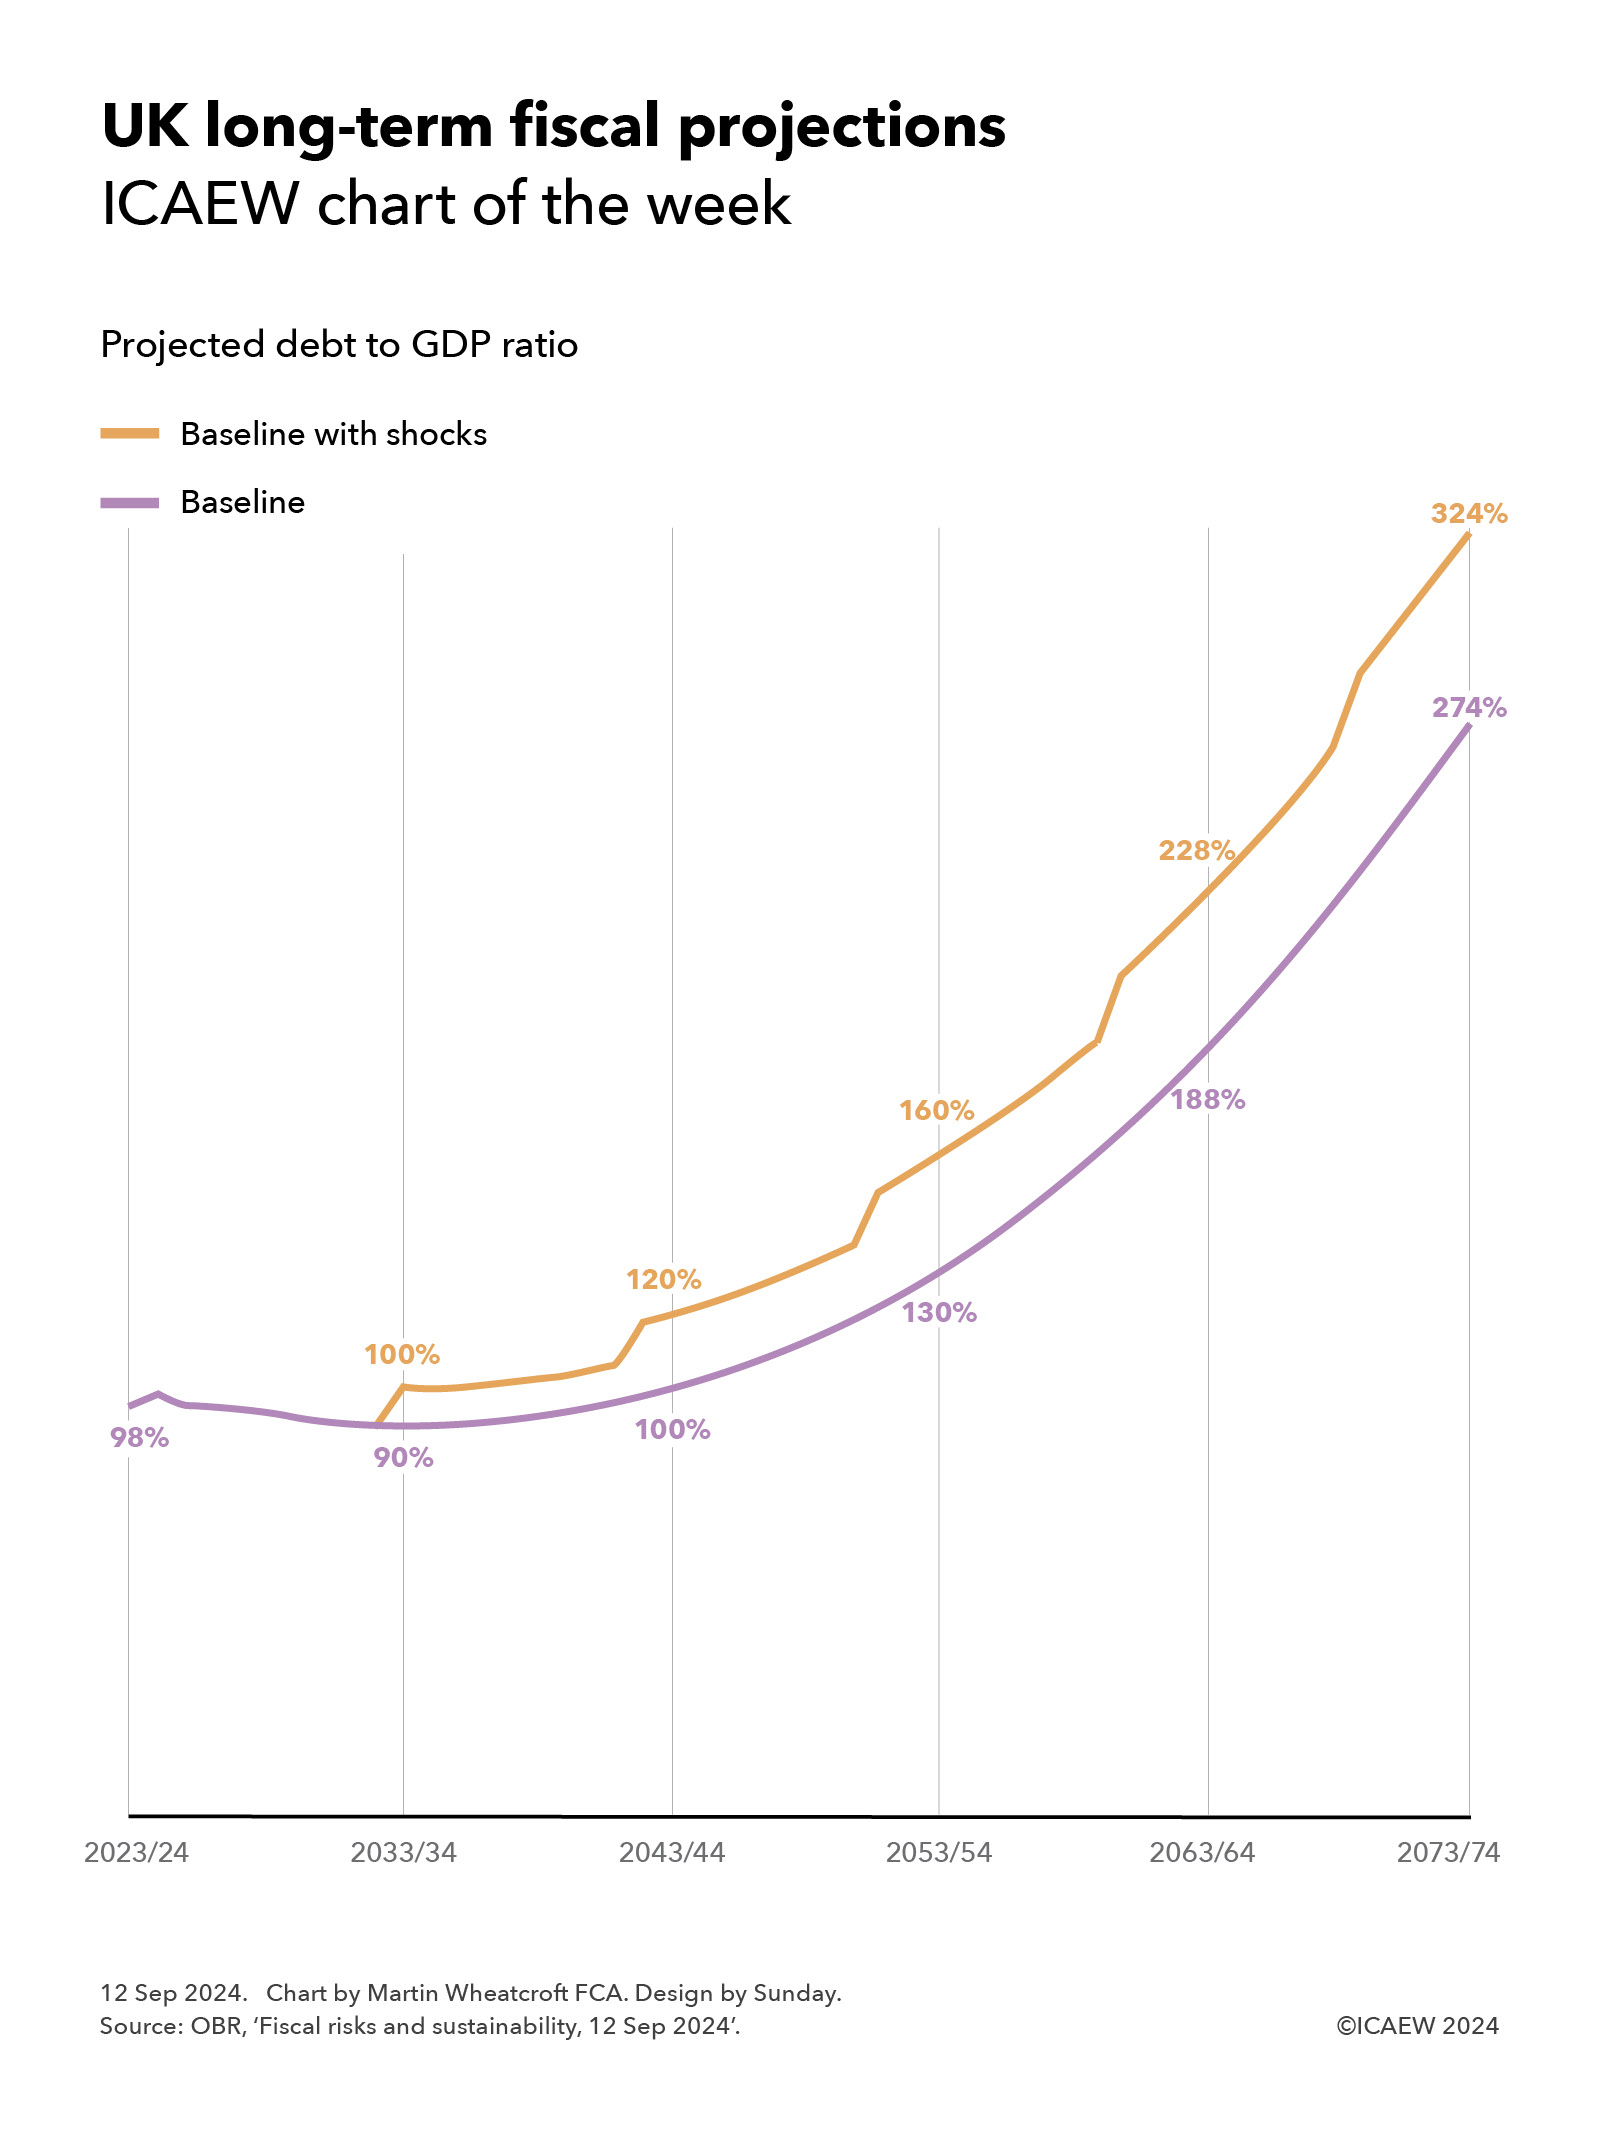
The OBR suggests that – without action to improve productivity, increase taxes, cut spending, bring in more people or do more to tackle climate change – public sector net debt is projected to rise to 274%, or potentially 324% if likely economic shocks are included.
As the chart illustrates, debt to GDP was 98% at the end of 2023/24 and the baseline projection shows this falling over the coming decade to 90% by 2033/34, and then gradually increasing to 100% of GDP in 2043/44, 130% in 2053/54, 188% in 2063/64, and then 274% in 2073/74.
Experience tells us to expect an economic shock such as a recession every decade or so, and so the OBR also reports a ‘baseline with shocks’ scenario that sees the debt to GDP ratio reaching 100% of GDP in 2033/34, 120% in 2043/44, 160% in 2053/54, 228% in 2063/64, and then 324% in 2073/74.
The projections reflect long-term pressures on the public finances from the post-economic crisis slowdown in economic growth, an ageing population, the effects of climate change, and higher defence spending.
They are, of course, dependent on the assumptions used in their calculation, especially reproductivity growth, net inward migration, the health of the population, and the degree of rise in global temperatures. They also assume that the previous government’s plans to cut public spending significantly over the next five years are adopted by the incoming government, which is considered to be unlikely given that most economic commentators thought these plans were unrealistic even if there had not been a change in government.
Alternative scenarios prepared by the OBR include a better health scenario that results in a 44% lower debt to GDP ratio in 2073/74, a worse health scenario that increases debt by 49% of GDP, a higher rise in global temperatures to 2℃ that increases debt by 23% and to 3℃ that increases debt by 33%.
The good news is that all of these projections are completely unrealistic.
They are based on extrapolating from current tax and spending policies, without taking account of any actions that governments might take in the future to raise taxes, cut spending or develop the economy. It is extremely unlikely that future governments would be willing, or even able, to finance such large fiscal deficits over the next 50 years.
The bad news is that in consequence taxes are likely to go up.
While there are options to mitigate pressures on the public finances by cutting spending on public services or cutting the level of benefits such as the state pension, these are likely to be politically and practically difficult to achieve. Similarly, immigration remains a politically charged issue and encouraging higher levels of net inward migration significantly more than the 315,000 a year assumed from 2028/29 onwards might be challenging.
The OBR suggests a ‘fiscal tightening’ of 1.5% each decade would be necessary to return debt to its pre-pandemic level of approximately 80% of GDP. If accomplished through tax rises alone, this would see tax levels increase from a projected 37% of GDP in 2027/28 to around 43% of GDP in 2073/24.
Avoiding either of these outcomes – unsustainable debt or ever-increasing levels of taxation – will require productivity growth to increase significantly. So, if you have any good ideas on how to achieve higher productivity that no one else has thought of (preferably without increasing public spending too much), please write to the Chancellor at 11 Downing Street as she would probably be interested to hear them.
Boost from self assessment tax receipts not enough to prevent a deficit in July as Chancellor searches for cost savings in the run up to the Autumn Budget.
The monthly public sector finances for July 2024 released by the Office for National Statistics (ONS) on Wednesday reported a provisional deficit for the first four months of the 2024/25 financial year of £51.4bn, £4.7bn worse than budgeted.
Alison Ring OBE FCA, ICAEW Director of Public Sector and Taxation, says: “Today’s data shows that the customary boost from self assessed tax receipts in July was not enough to prevent a deficit of £3.1bn, higher than budgeted, as cost pressures drove up public spending. Debt increased to £2,746bn or 99.4% of GDP at the end of July, up £5.9bn from the end of June 2024.
“The government is now in crisis control mode as it searches for savings to offset significant unbudgeted cost overruns in this financial year, with the cumulative deficit to July 2024 standing at £51.4bn, £4.7bn more than budgeted.
“Rumours that the government is looking at significant cuts in public investment programmes this year to keep within budget are concerning, given the importance to economic growth of infrastructure and the urgent need for upfront investment in technology to fix poorly performing public services. Our hope is that the Chancellor will be able to take a more strategic view in her Autumn Budget in October and in the Spending Review in the spring.”
Month of July 2024
There was a shortfall between receipts and spending of £3.1bn in the month of July 2024, £1.8bn higher than in July 2023 and £3.0bn worse than the budgeted deficit of £0.1bn.
Taxes and other receipts amounted to £99.4bn in July 2024, up £10.3bn or 12% from the previous month driven by self assessment income tax receipts in July, in line with the trend last year. Receipts were £2.0bn or 2% higher than in the same month last year, in contrast with total managed expenditure of £102.5bn, which was £3.8bn or 4% higher than in July 2023.
Financial year to date
The shortfall between receipts and spending of £51.4bn for the four months to July 2024 was £0.5bn better than in the same period last year, but £4.7bn over budget.
Cumulative taxes and other receipts amounted to £359.3bn in the first third of the financial year, up 2% compared with the same period last year, while total managed expenditure was 2% higher at £410.7bn. This is illustrated by Table 1, which highlights how cuts to employee national insurance rates have been offset by higher income tax, VAT, corporation tax, and non-tax receipts.
Total managed expenditure for the first four months of £410.7bn was also up by 2% compared with April to July 2023, but this reflected spending on public services up 4%, welfare spending up 6% and gross investment up 10% driven by overruns and construction cost inflation being offset by lower energy-support subsidies and lower debt interest.
The reduction in debt interest of £6.1bn compared with the first four months of last year was driven by a £26.5bn swing in indexation on inflation-linked debt that more than offset a £20.4bn increase in interest on variable and fixed-rate debt.
Table 1: Summary receipts and spending
Apr-Jul 2024 £bn
Apr-Jul 2023 £bn
Change %
Income tax
89.9
86.4
+4%
VAT
67.9
66.0
+3%
National insurance
53.5
58.3
-8%
Corporation tax
34.0
31.6
+8%
Other taxes
73.5
72.1
+2%
Other receipts
40.5
37.5
+8%
Total receipts
359.3
351.9
+2%
Public services
(212.2)
(204.8)
+4%
Welfare
(103.1)
(97.5)
+6%
Subsidies
(10.6)
(14.0)
-24%
Debt interest
(46.6)
(52.7)
-12%
Gross investment
(38.2)
(34.8)
+10%
Total spending
(410.7)
(403.8)
+2%
Deficit
(51.4)
(51.9)
-1%
Table 2 summarises how public sector net borrowing (PSNB) to fund the deficit of £51.4bn combined with borrowing of £4.4bn to fund working capital movements, student loans and other financing requirements increased debt by £55.8bn during the first four months of the financial year. As a result, public sector net debt grew to £2,745.9bn on 31 July 2024, which is £931bn or 51% more than the £1,815bn reported for 31 March 2020 at the start of the pandemic.
The ratio of net debt to GDP ratio is at the highest it has been since the 1960s, having increased by 1.3 percentage points from 98.1% on 1 April 2024 to 99.4% on 31 July 2024. Borrowing to fund the deficit was equivalent to 1.9% of GDP and other borrowing was equivalent to 0.2%, an increase of 2.1% before being offset by 0.8% from the effect of inflation and economic growth on GDP (usually referred to as ‘inflating away’). Lower inflation this year means this effect is less pronounced than in the same period last year.
Table 2: Public sector net debt and net debt/GDP
Apr-Jul 2024 £bn
Apr-Jul 2023 £bn
PSNB
51.4
52.3
Other borrowing
4.4
(11.4)
Net change
55.8
40.9
Opening net debt
2,694.1
2,539.7
Closing net debt
2,745.9
2,580.6
PSNB/GDP
1.9%
2.0%
Other/GDP
0.2%
(0.4%)
Inflating away
(0.8%)
(1.5%)
Net change
1.3%
0.1%
Opening net debt
98.1%
95.7%
Closing net debt
99.4%
95.6%
Public sector net worth, the new balance sheet metric launched by the ONS last year, was -£740bn on 31 May 2024, comprising £1,613bn in non-financial assets and £1,062bn in non-liquid financial assets minus £2,746bn of net debt (£343bn liquid financial assets – £3,089bn public sector gross debt) and other liabilities of £669bn. This is a £67bn deterioration from the start of the financial year and is £123bn more negative than in July 2023.
Revisions and other matters
Caution is needed with respect to the numbers published by the ONS, which are expected to be repeatedly revised as estimates are refined and gaps in the underlying data are filled. This includes local government, where monthly data is based on budget or high level estimates in the absence of monthly data collection.
The latest release saw the ONS reduce the reported deficit for the first three months of the financial year by £1.5bn from £49.8bn to £48.3bn as estimates were revised for new data.
First quarter shortfall between receipts and spending of almost £50bn emphasises the significant challenges facing the Chancellor as she puts together her first Budget.
The monthly public sector finances for June 2024 released by the Office for National Statistics (ONS) on Friday 19 July 2024 reported a provisional deficit for the first three months of the 2024/25 financial year of £49.8bn, £1.1bn better than a year previously but £3.2bn worse than budgeted.
Alison Ring OBE FCA, ICAEW Director of Public Sector and Taxation, says: “This is the first set of public sector finance data since the new government was elected, and today’s numbers set out the size of the obstacle the UK’s leaders face.
“£14.5bn was borrowed to finance the deficit in June, which although £3.2bn less than in June 2023, brought the total for the first three months of the financial year to £49.8bn, slightly worse than expectations. The latest numbers also highlighted the growing amount of public debt, which stood at 99.5% of GDP or £2,740bn on 30 June 2024. Although total debt interest was lower than last year because of the effect of lower inflation on inflation-linked debt, interest on the bulk of debt continues to rise.
“The high level of debt – and the associated interest bill – means that the new Prime Minister and Chancellor will be faced with some very difficult decisions over the coming months as they decide which elements of their programme to prioritise, and which will have to wait.”
Month of June 2024
Taxes and other receipts amounted to £88.2bn in June 2024, up 2% compared with the same month last year, while total managed expenditure was 2% lower at £102.7bn. This resulted in a reduction of £3.2bn from a fiscal deficit of £17.7bn in June 2023 to £14.5bn in June 2024.
Financial year to date
Taxes and other receipts amounted to £258.0bn in the three months to June 2024, up 1% compared with the same month last year, while total managed expenditure was 1% higher at £307.8bn. This resulted in a reduction of £1.1bn from a fiscal deficit of £50.9bn for the first quarter of 2023/24 to £49.8bn for the first quarter of 2024/25. However, this is £3.2bn more than the £46.6bn for the first quarter included in the Spring Budget 2024.
Table 1 analyses receipts for the first quarter of the financial year, highlighting how cuts to employee national insurance rates have been offset by higher income tax, corporation tax, and non-tax receipts.
Table 1: Summary receipts and spending
Three months to
Jun 2024 (£bn)
Jun 2023 (£bn)
Change (%)
Income tax
58.1
56.1
+4%
VAT
49.9
49.6
+1%
National insurance
39.7
43.4
-9%
Corporation tax
25.3
23.4
+8%
Other taxes
54.9
54.1
+1%
Other receipts
30.1
27.7
+9%
Total receipts
258.0
254.3
+1%
Public services
(158.8)
(152.6)
+4%
Welfare
(76.9)
(73.7)
+4%
Subsidies
(7.8)
(11.3)
-31%
Debt interest
(35.2)
(41.1)
-14%
Gross investment
(29.1)
(26.5)
+10%
Total spending
(307.8)
(305.2)
+1%
Deficit
(49.8)
(50.9)
-2%
Table 1 also shows how total managed expenditure for the first quarter of £307.8bn was up by 1% compared with April to June 2023, with higher spending on public services and welfare offset by lower energy-support subsidies and lower debt interest. The reduction in the latter of £5.9bn was driven by a £9.2bn reduction in indexation on inflation-linked debt that more than offset a £3.3bn or 44% increase in interest on variable and fixed-rate debt.
Table 2: Public sector net debt
Three months to
Jun 2024 (£bn)
Jun 2023 (£bn)
Deficit
(49.8)
(50.9)
Other borrowing
3.9
(7.7)
Debt movement
(45.9)
(58.6)
Opening net debt
(2,694.1)
(2,539.7)
Closing net debt
(2,740.0)
(2,598.3)
Net debt/GDP
99.5%
96.7%
Public sector net debt was £2,740bn or 99.5% of GDP on 30 June 2024, just under £46bn higher than at the start of the financial year. At 99.5%, the debt to GDP ratio is the highest it has been since the 1960s.
The increase in the first quarter reflects borrowing to fund the deficit of just under £50bn minus close to £4bn in net cash inflows from loan recoveries and working capital movements in excess of lending by government.
Public sector net debt is £142bn or 5% higher than a year previously, equivalent to an increase of 2.8 percentage points in relation to the size of the economy. It is £925bn or 51% more than the £1,815bn reported for 31 March 2020 at the start of the pandemic and £1,712bn or 167% more than the £1,028bn net debt amount as of 31 March 2007 before the financial crisis, reflecting the huge sums borrowed over the last two decades.
Public sector net worth, the new balance sheet metric launched by the ONS in 2023, was -£726bn on 31 May 2024, comprising £1,613bn in non-financial assets and £1,070bn in non-liquid financial assets minus £2,740bn of net debt (£340bn liquid financial assets – £3,080bn public sector gross debt) and other liabilities of £669bn. This is a £53bn deterioration from the start of the financial year and is £77bn more negative than the -£649bn net worth number for June 2023.
Revisions and other matters
Caution is needed with respect to the numbers published by the ONS, which are expected to be repeatedly revised as estimates are refined and gaps in the underlying data are filled.
The latest release saw the ONS increase the reported deficit for the first two months of the financial year by £1.8bn from £33.5bn to £35.3bn as estimates were revised for new data. More significantly, public sector net debt at the end of May 2024 was reduced by £16.3bn to £2,726.6bn to correct for omitted data on Bank of England repo transactions during the current financial year. This reduced the reported debt to GDP ratio for May 2024 by 0.7 percentage points from 99.8% of GDP to 99.1%.
Public sector net debt has passed £2.7tn for the first time. In May the debt increased by £49bn from £2,694bn to £2,743bn, 51% higher than it was in March 2020 at the start of the pandemic.
The monthly public sector finances for May 2024 released by the Office for National Statistics (ONS) on Friday 21 June 2024 reported a provisional deficit for the first two months of the 2024/25 financial year of £33.5bn, £1.5bn better than the £35.0bn predicted by the Office for Budget Responsibility (OBR) and £0.4bn higher than in April and May 2023.
An ICAEW spokesperson said: “Today’s numbers show that public sector net debt continues to grow, up from £2.69tn in April to £2.74tn in May, the first time it has exceeded £2.7tn.
“Net debt is now 51% higher than it was at the start of the pandemic in March 2020, and 167% higher than it was in March 2010, pushed up by the spikes in spending during the pandemic and to offset energy bills, as well as borrowing to fund day-to-day spending and investment. High borrowing costs and the financial consequences of more people living longer mean that the public finances are significantly weaker and less resilient than they were 14 years ago.
“When the country goes to the polls on 4 July, the reality is that whoever wins power will inherit an extremely challenging fiscal position that will hamper their ability to turn the country around.”
Month of May 2024
Taxes and other receipts amounted to £85.1bn in May 2024, up 2% compared with the same month last year, while total managed expenditure was also 2% higher at £100.1bn.
The resulting fiscal deficit of £15.0bn for the month was £0.8bn higher than in May 2023.
Financial year to date
As summarised in Table 1, total receipts in April and May 2024 of £170.4bn were 2% higher than in the same two months last year, with the cuts to employee national insurance rates offset by higher income tax, corporation tax, and non-tax receipts.
Table 1: Summary receipts and spending
Two months to
May 2024 £bn
May 2023 £bn
Change %
Income tax
38.2
36.8
+4%
VAT
33.9
33.6
+1%
National insurance
25.9
28.2
-8%
Corporation tax
16.6
15.5
+7%
Other taxes
36.0
35.2
+2%
Other receipts
19.8
18.5
+7%
Total receipts
170.4
167.8
+2%
Public services
(108.3)
(104.5)
+4%
Welfare
(51.4)
(49.1)
+5%
Subsidies
(5.2)
(7.8)
-33%
Debt interest
(21.4)
(21.6)
-1%
Gross investment
(17.6)
(17.9)
-2%
Total spending
(203.9)
(200.9)
+1%
Deficit
(33.5)
(33.1)
+1%
Table 1 also shows how total managed expenditure for the two months of £203.9bn was up by more than 1% compared with April and May 2023, with higher spending on public services and welfare offset by lower energy-support subsidies and marginally lower debt interest. The latter was driven by significantly lower indexation on inflation-linked debt offsetting the much higher rates of interest payable on variable rate and refinanced fixed-rate debt.
Table 2: Public sector net debt
Two months to
May 2024 £bn
May 2023 £bn
Deficit
(33.5)
(33.1)
Other borrowing
(10.2)
2.1
Debt movement
(43.7)
(31.0)
Opening net debt
(2,699.2)
(2,539.7)
Closing net debt
(2,742.9)
(2,570.7)
Net debt/GDP
99.8%
96.1%
Public sector net debt as of 31 May 2024 was £2,743bn or 99.8% of GDP, just under £44bn higher than at the start of the financial year. The increase reflects borrowing to fund the deficit of £33.5bn and £10.2bn borrowed to fund lending by government and other cash requirements, net of loan recoveries.
Public sector net debt was £172bn or 7% higher than a year previously, and 3.7 percentage points higher in relation to the size of the economy.
Public sector net debt is £928bn or 51% more than the £1,815bn reported for 31 March 2020 at the start of the pandemic and £1,715bn or 167% more than the £1,028bn net debt amount as of 31 March 2007 before the financial crisis, reflecting the huge sums borrowed over the last 14 years.
Public sector net worth, the new balance sheet metric launched by the ONS in 2023, was -£726bn on 31 May 2024, comprising £1,613bn in non-financial assets and £1,074bn in non-liquid financial assets minus £2,743bn of net debt (£300bn liquid financial assets – £3,043bn public sector gross debt) and other liabilities of £670bn. This is a £47bn deterioration from the start of the financial year and is £95bn more negative than the -£631bn net worth number for May 2023.
Revisions and other matters
Caution is needed with respect to the numbers published by the ONS, which are expected to be repeatedly revised as estimates are refined and gaps in the underlying data are filled.
The latest release saw the ONS reduce the reported deficit for April 2024 by £2.1bn from £20.5bn to £18.4bn and revise the deficit for the year to March 2024 up by £0.7bn from £121.4bn to £122.1bn as estimates of tax receipts and expenditure were updated for better data.
This week’s chart for ICAEW is on manifesto costings, illustrating the scale of each party’s promises and how they expect to fund them.
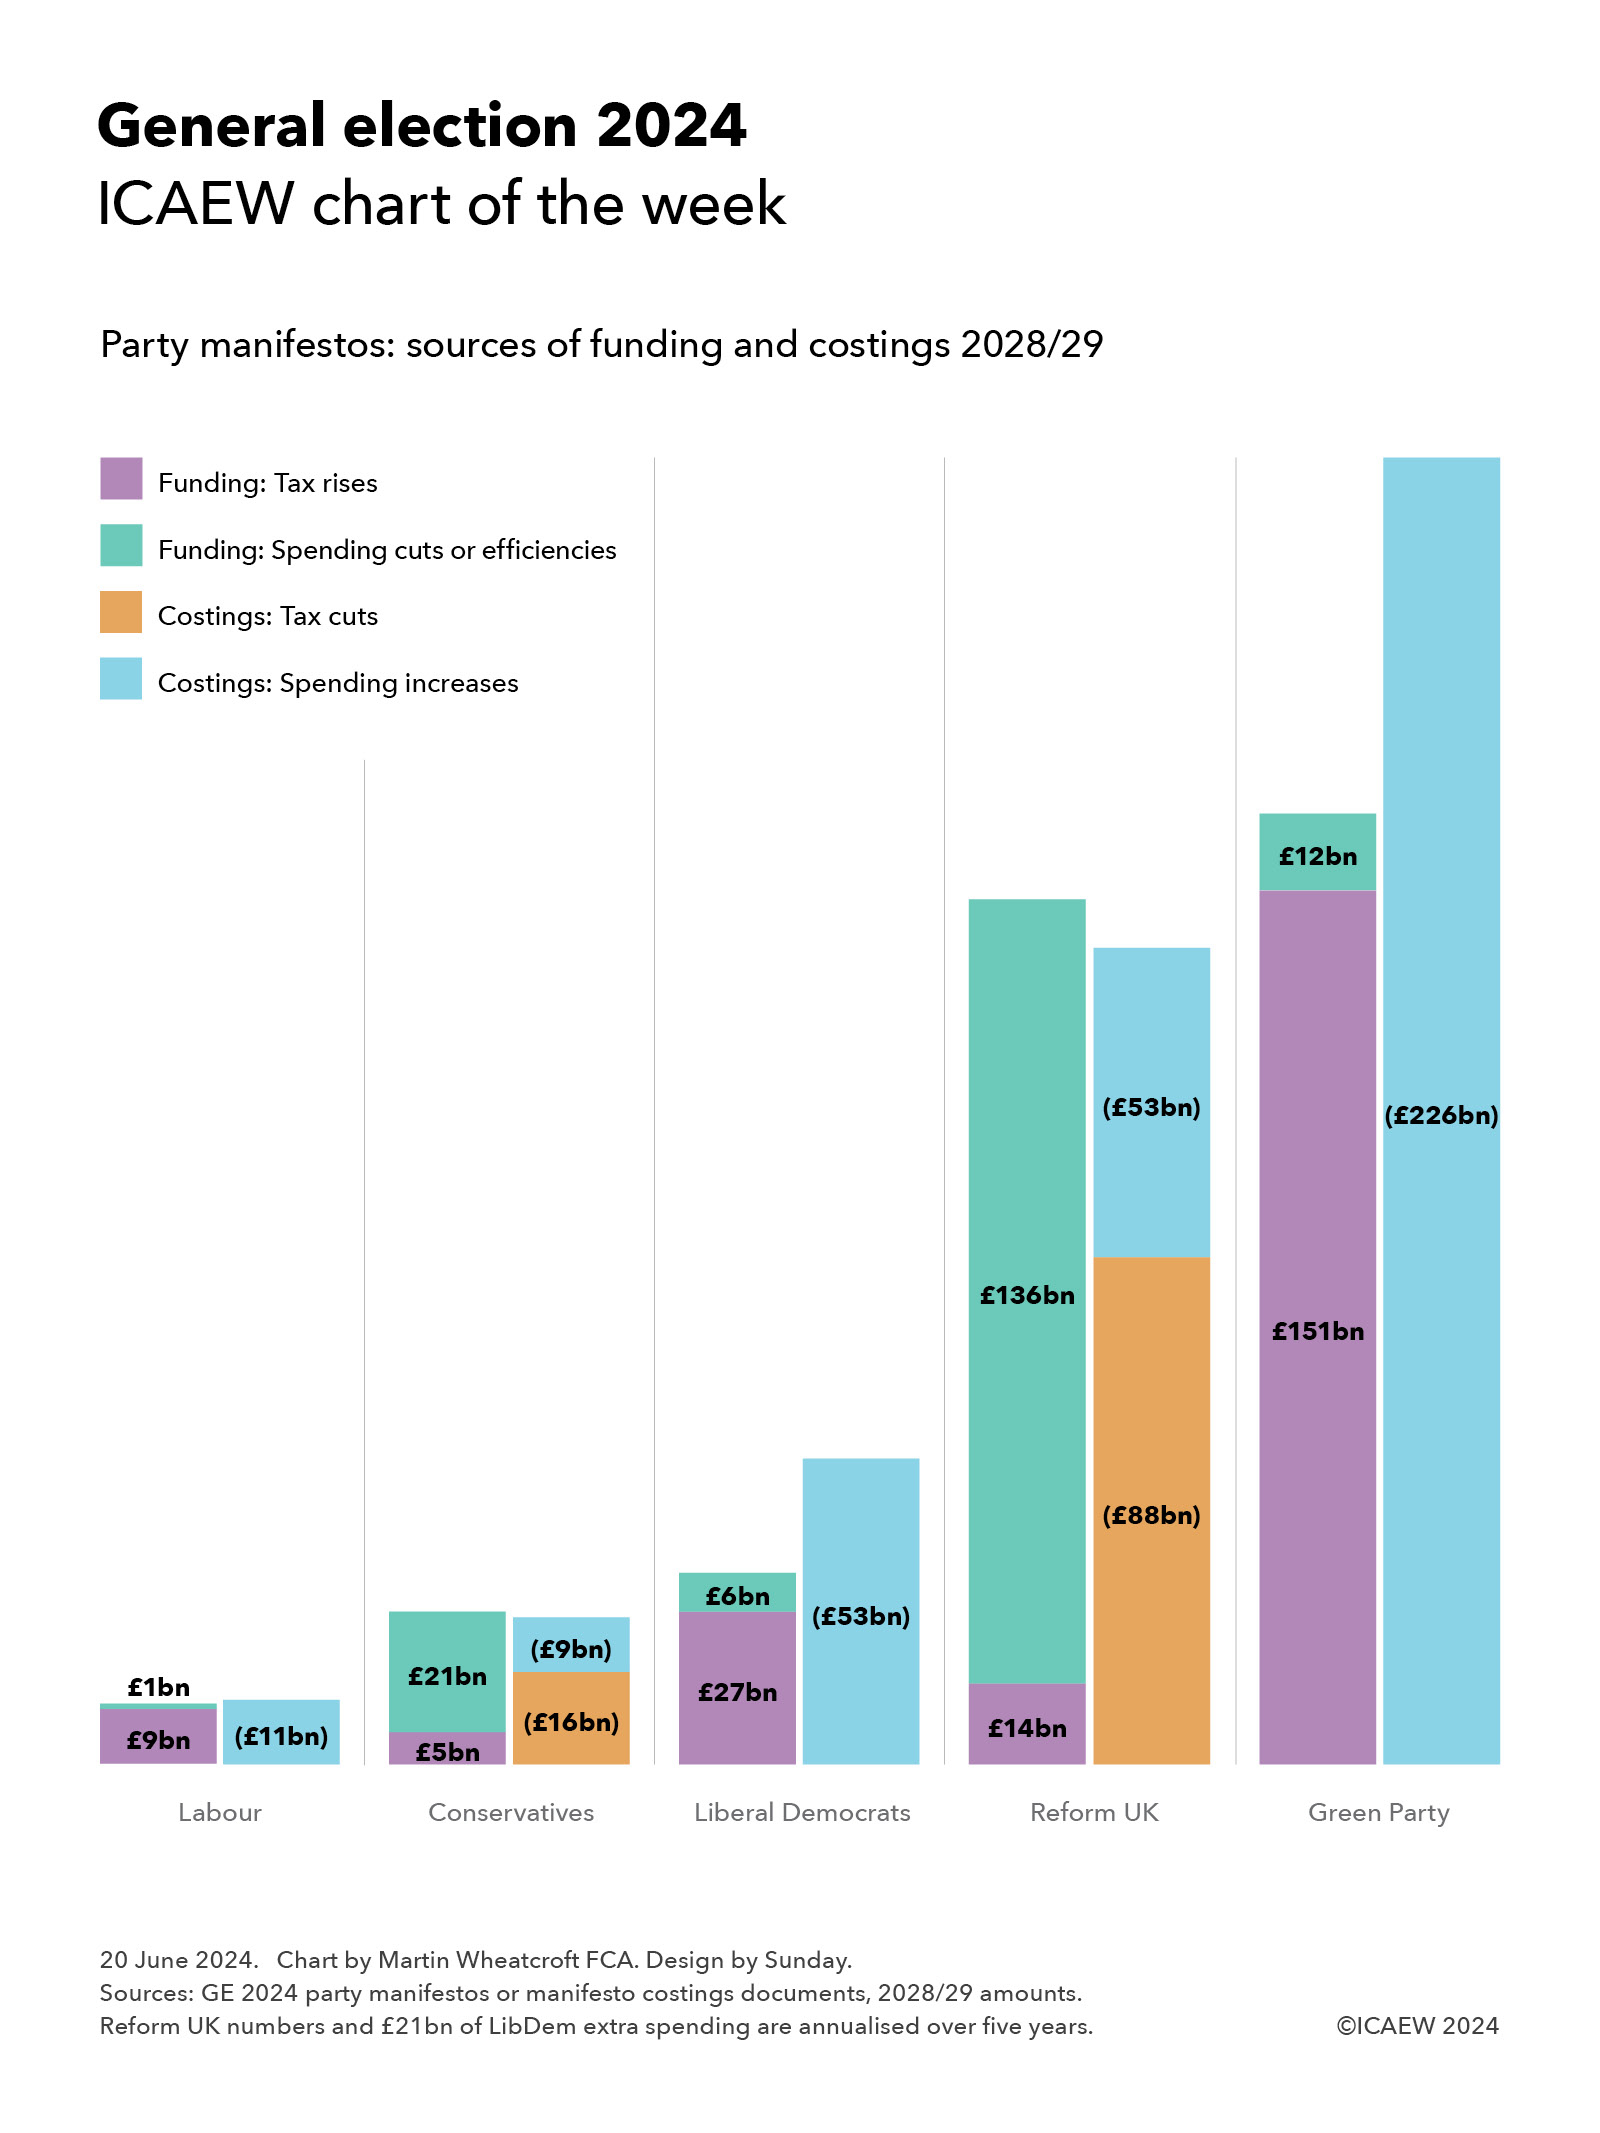
My chart for ICAEW this week summarises the financial commitments in the manifestos of the five UK-wide political parties, together with how they propose to fund their plans.
The Labour Party
The Labour Party manifesto costings are the most cautious financially, with plans to find £9bn in 2028/29 from a combination of tax rises and tackling tax avoidance and evasion and £1bn or so in spending reductions to provide most of the funding for its spending commitments of £11bn.
The additional tax revenue proposed by Labour includes £5.2bn from increasing taxes on non-doms and tackling tax avoidance and evasion, £1.5bn from VAT and business rates on private schools, £1.2bn from extending windfall tax on oil and gas, and £0.6bn from increasing the tax rate on private equity carried interest. Spending reductions include £0.7bn from cutting spending on consultants, £0.4bn from increased collaboration between police forces, and £0.2bn from scrapping the Rwanda plan and ending the use of hotels for asylum seekers.
Labour’s proposals for new spending comprise approximately £6bn for public services and £5bn a year in capital investment. The former includes £1.8bn for the NHS, £1.0bn for schools and young people (including £0.3bn for primary school breakfast clubs), £0.9bn for HMRC to tackle tax avoidance and evasion, £0.7bn for improving public service delivery and capability, £0.4bn for 13,000 neighbourhood and community PCSOs, and £0.2bn for asylum and border control. The latter includes £1.7bn for Great British Energy, £1.5bn for green investment programmes, £1.1bn for home insulation, and £0.3bn in incentives for green energy suppliers.
Labour’s proposals add up to £1bn in extra borrowing in 2028/29, although Labour suggest that they could add £3.5bn to borrowing in 2028/29, implying a further £2.5bn could be available for other priorities.
The Conservative Party
The Conservative Party’s plans are more ambitious, with plans to raise £5bn a year by 2028/29 from tackling tax avoidance and evasion and £21bn from spending cuts and efficiency savings, which they intend to use to fund tax cuts of £16bn and extra spending of £9bn.
Proposed spending cuts by the Tories comprise £11bn from cutting planned spending on welfare (principally disability benefits), £5bn from other cuts (£1.6bn R&D, £1.5bn regional development, £0.9bn from cutting ‘low value’ degrees, £0.4bn from visa changes, and £0.6bn in other measures), and £5bn from efficiency savings (£2.9bn civil service headcount, £1.1bn from quangos, £0.6bn consultancy and £0.4bn NHS managers).
Proposed tax cuts include £10bn per year by 2028/29 to halve employee national insurance, £1.7bn to abolish self-employed national insurance, £2.2bn to increase pensioner tax allowances, £1.2bn to reform the high-income child benefit charge, and £0.6bn to reduce stamp duty for first time buyers.
Unlike Labour, there is no additional investment in HMRC to help achieve the planned reduction in the tax gap, but there is £4.5bn in 2028/29 to increase defence spending to 2.44% of GDP (on its way to 2.5% by 2030/31), £2.0bn for national / community service, £1.4bn for the NHS, £0.8bn for 8,000 more police officers, and £0.7bn for apprenticeships.
The Liberal Democrats
The Liberal Democrats are more hopeful in that they believe they can find £7.2bn from tackling tax avoidance and evasion to supplement proposed tax rises of £19.7bn (£5.2bn capital gains tax, £4.3bn bank levies, £4.0bn aviation taxes, £2.1bn oil and gas, £2.1bn digital services tax, £1.4bn on share buybacks and £0.6bn other). The party also plans to find £5.8bn from spending cuts (£4.3bn asylum, £0.9bn free schools, and £0.6bn consultants).
The Lib Dems plan use this additional funding to spend an extra £32bn on public services in 2028/29 (£9.8bn NHS and social care, £6.7bn on defence, borders and international aid, £6.6bn on education and childcare, £4.1bn to tackle child poverty, £2.9bn for the devolved administrations, £1.0bn for farmers and the environment and £0.6bn for transport.
The balance of £20.7bn a year on average over five years for capital investment is expected to be funded mainly by additional borrowing, including £8.4bn to tackle climate change and protect the environment, £6.2bn for social housing, £1.9bn on school buildings, £1.9bn for the devolved administrations, £1.2bn on transport infrastructure, and £1.1bn for hospitals and other health facilities.
The Reform Party
The Reform UK costings in the ‘Our Contract with You’ are on a much bigger scale than everyone apart from the Green Party, with proposals to raise taxes by £14bn and cut spending by £136bn (10% of total public spending, or more once costs such as the state pensions are excluded) in order to fund an £88bn programme of tax cuts and £53bn a year in spending commitments.
The proposed spending cuts include a blanket £50bn a year in efficiency savings from cutting public service spending by 5% “without touching front line services”, £35bn from ceasing to pay interest to commercial banks on central bank deposits, £20bn from scrapping net zero, £15bn from cutting welfare benefits, £6bn from foreign aid, £5bn from reducing immigration and £5bn from stopping HS2 completely. The tax rises comprise a £10bn tax on renewable electricity generators and a £4bn immigration surcharge on employers, together with unquantified amounts from a 4% online delivery tax and a cut in entrepreneur’s relief to 5% that are netted off within the numbers below.
Reform UK plans to use these sums to cut personal taxes by £70bn (raise income tax threshold to £20,000, abolish VAT on energy bills, cut stamp duty, allow VAT reclaims for tourists, halve inheritance tax rate to 20% and raise threshold to £2m), cut business taxes by £18bn (reduce corporation tax to 15% and to zero for profits under £100,000, increase the VAT threshold to £150,000, abolish business rates for high street SMEs and create SME enterprise zones with zero tax when creating jobs).
Spending commitments include £17bn health and social care (a three-year basic rate tax holiday for NHS and social care staff, 20% tax relief on private healthcare and insurance, write-off medical student fees over 10 years and private treatment vouchers), £14bn for defence and veterans (2.5% of GDP with an aspiration to meet 3% after 2030), £8bn for children and families (including £5,000 transferrable marriage allowance and front loading of child benefit for ages 1-4), £5bn for police and courts (recruiting 40,000 new officers over five years), £5bn for education (including 20% tax relief on private school fees – and no VAT), and £4bn for agriculture, fishing and coastal communities
The Green Party
The Green Party has the most ambitious set of proposals, with tax rises of £151bn and cost savings of £12bn together with £63bn in additional borrowing to fund incremental spending of £226bn in 2028/29. It has an expansive agenda that involves nationalising water and the Big 5 energy companies, investing large sums in the green transition, and spending a significant amount more on health and welfare.
Its proposed tax increases comprise £72bn in higher personal and wealth taxes, £70bn from a carbon tax and around £9bn from business taxation, with £12bn in savings from cancelling the Trident replacement and roadbuilding programmes. Its proposals include aligning capital gain tax rates and investment income with income tax, increasing national insurance above the upper earnings limit from 2% to 10%, restricting pension tax relief to the basic rate, reforming inheritance tax, and introducing a 1% wealth tax on individuals with assets above £10m and 2% above £1bn. It also wants to replace council tax and business rates with land value taxes.
If achieved, this would allow it to pay for £145bn in additional current spending of £145bn in 2028/29 and £81bn in extra capital investment. The former includes £46.4bn for health and social care, £27.2bn welfare, £20.1bn overseas aid, £13.2bn education, £11.9bn transport, £4.5bn nature, food and farming, and £21.7bn for other priorities. The latter includes £56.7bn for green investment, £10.5bn for social housing, £6.6bn for health and education, and £6.8bn for other capital expenditures.
Upcoming Spending Review does not feature
None of the parties addresses the ‘elephant in the room’ represented by the upcoming three-year Spending Review for 2025/26 to 2027/28 that is expected by the Institute for Fiscal Studies and others to identify up to £20bn per year of additional funding requirements to maintain public services at their current level.
Overcoming the current weak state of the public finances is likely to be first order of business for whichever party wins the election.
Now that the dust has settled on last month’s Spring Budget, ICAEW has published a more detailed analysis on the implications for the public finances.
ICAEW’s Fiscal Insight on the Spring Budget 2024 provides an analysis of the key numbers, risks to the Office for Budget Responsibility forecast, tax measures, forecast revisions since the 2023 Autumn Statement, the fiscal position in the 2024/25 Budget year, borrowing over the next five years, the calculation of underlying debt, the £1.2trn that HM Treasury needs to raise from debt investors, and our conclusions on what the numbers mean for the public finances.
Key points highlighted in the report include:
Headlines
Modest improvement in forecasts and small tax increases ‘pay for’ national insurance cut.
Headroom of £9bn against the Chancellor’s primary fiscal rule is tiny compared with risks.
End of low-cost borrowing is hampering investment in infrastructure and public services.
Weak economy, high debt, demographic challenges, underperforming public services.
No long-term fiscal strategy.
Key numbers
Tax and other receipts of £1,139bn in 2024/25, equivalent to £1,375 per person per month.
Public spending of £1,226bn in 2024/25, equivalent to £1,480 per person per month.
Deficit projected to fall by a quarter to £87bn in 2024/25 and gradually to £39bn in 2028/29.
Headline debt expected to reach £2.8trn by March 2025 and £3.0trn by March 2029.
Underlying debt/GDP forecast to increase from 88.8% to 93.2% and then fall to 92.9%.
Conclusions
Difficult choices on spending deferred until after the general election.
Post-election tax increases likely, irrespective of who wins the general election.
A badly designed fiscal rule driving poor decisions and unrealistic spending forecasts.
Predicted reduction in the deficit to below 2% of GDP by 2027/28 is unlikely to occur.
Further pre-election tax cuts could affect credibility with debt markets.
Alison Ring OBE FCA, ICAEW Director for Public Sector and Taxation, is quoted in the Fiscal Insight as follows:
“The principal story of the Spring Budget has been how the Chancellor was able to find room for tax cuts while still meeting his fiscal targets to ‘bring down debt and the deficit’.
“This is a frustrating narrative as it misses the bigger picture of public finances that are on an unsustainable path, with little sign of a long-term fiscal strategy to address demographic change, growing balance sheet liabilities, underperforming public services, rising debt interest, or resilience against future economic shocks.
“Debt is high and projected to be even higher in five years’ time than it is today. ‘Headroom’ is tiny in context of trillions of pounds of tax receipts and public spending over the next five years and forecasts that don’t reflect government practice in freezing fuel duties nor likely spending increases from the now postponed Spending Review.
“And we have a fiscal target that discourages essential infrastructure investment while at the same time never needing to be achieved as it is rolled forward each year.
“All of our fiscal eggs are now in a basket labelled ‘hope’ [for economic growth].”
Fiscal Insight
Read the full Fiscal Insight report, which provides detailed analysis on the Spring Budget’s implications for the public finances.
Our chart this week takes a look at the effect of the Spring Budget 2024 on the public finances.
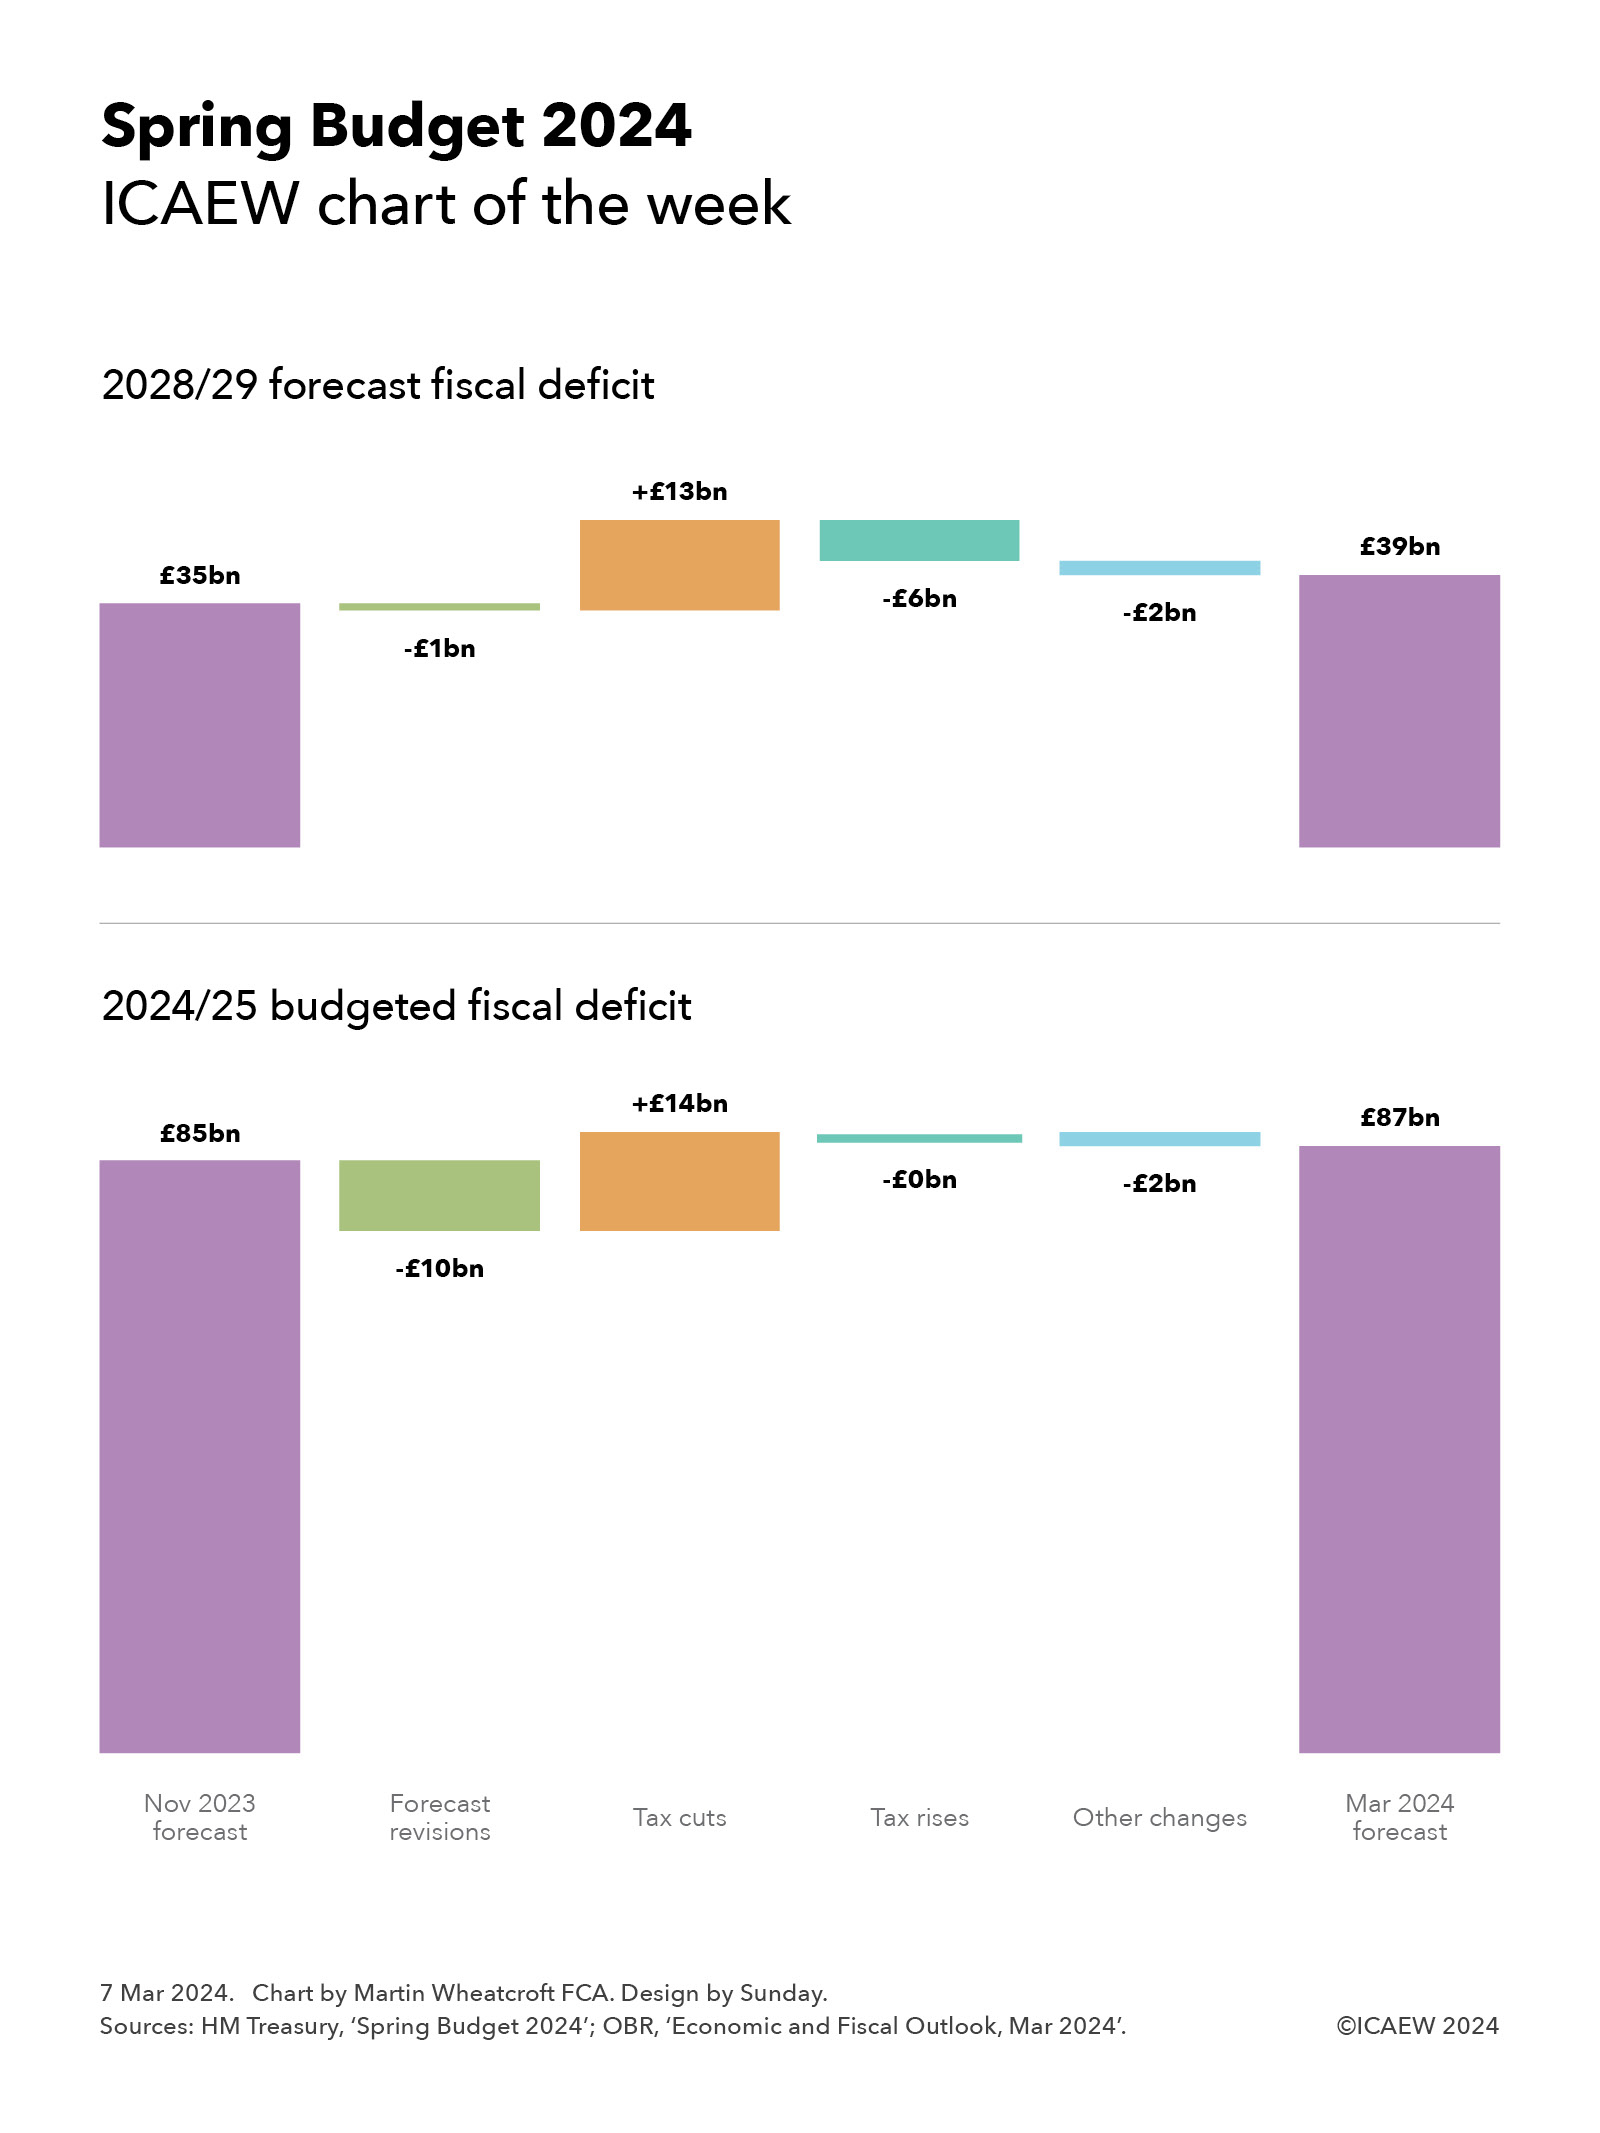
This week’s chart summarises the changes announced in the Spring Budget 2024, analysing the changes in the budgeted fiscal deficit for 2024/25 and the forecast fiscal deficit for 2028/29 since the forecasts that accompanied the Autumn Statement 2023 last November.
As the chart illustrates, the budgeted deficit for 2024/25 of £85bn anticipated in November has been revised up to £87bn, comprising forecast revisions reducing the deficit of £10bn, followed by tax cuts of £14bn increasing the deficit, offset by tax rises of close to zero and other changes of £2bn reducing the deficit.
The chart also shows the changes to the final year of the forecast period, with the forecast of deficit £35bn at the time of the Autumn Statement 2023 reduced by £1bn from forecast revisions, increased by £13bn to fund tax cuts, reduced by £6bn from tax rises and £2bn from other changes to reach a new forecast for the deficit in 2028/29 of £39bn.
The good news for the Chancellor was the improvement in the public finances in the earlier years of the forecast, with interest rate expectations coming down from last year. This resulted in an improvement in the forecasts of £16bn in 2024/25 and £14bn in 2028/29, offset by the effect of lower inflation expectations on tax and other receipts of £2bn and £13bn respectively to result in net forecast revisions of £10bn and £1bn respectively. The lower inflation assumption has a bigger impact over time as there is a compounding effect on tax and other receipts.
This allowed the Chancellor to announce a two-percentage point cut in national insurance pushing up the deficit by £10bn in 2024/25 and £11bn in 2028/29, together with freezes in fuel and alcohol duties, changes in the high-income child benefit charge, an increase in the VAT threshold from £85,000 to £90,000, and a four-percentage point cut in capital gains tax on property sales from 28% to 24%. The latter change is expected to increase tax receipts by a few hundred million pounds a year as it is expected to encourage more property sales, with higher volumes offsetting lower tax on each sale. Overall, these other tax cuts push up the deficit by £4bn in 2024/25 and £2bn in 2028/29.
The forecast revisions weren’t enough to allow the Chancellor to cover the cost of cutting taxes, and so he also announced some tax rises. These include the introduction of a duty on vaping and an increase in tobacco duty, an extension of the energy profits levy to March 2029, and changes in the tax treatment of ‘non-doms’. These have a relatively small effect in 2024/25 but build up to a reduction in the deficit around £6bn a year by 2028/29.
Other changes of £2bn in 2024/25 comprised £1bn in other policy measures and £1bn in indirect benefits to the economy from the Chancellor’s announcements in 2024/25, while the £2bn in 2028/29 reflected £1bn from improvements in tax collection, £1bn in other measures, and £2bn from indirect benefits to the economy, offset by £1bn from interest on increased borrowing, and £1bn to be invested in public sector productivity.
In summary, these are relatively tiny changes in the outlook for the public finance in the context of £1.2trn of public spending each year and public sector net debt that is still on track to exceed £3.0trn by the end of the forecast period in March 2029.
Even relatively small changes in economic assumptions, in spending plans, or in tax policies could have a significant impact on the fiscal forecasts, especially those for 2028/29.
For more information about the Spring Budget 2024 and ICAEW’s letters to the Chancellor and HM Treasury, click here.