Martin Wheatcroft FCA, external adviser on public finances to ICAEW, assesses what options the government has to reduce the gap between receipts and expenditure.
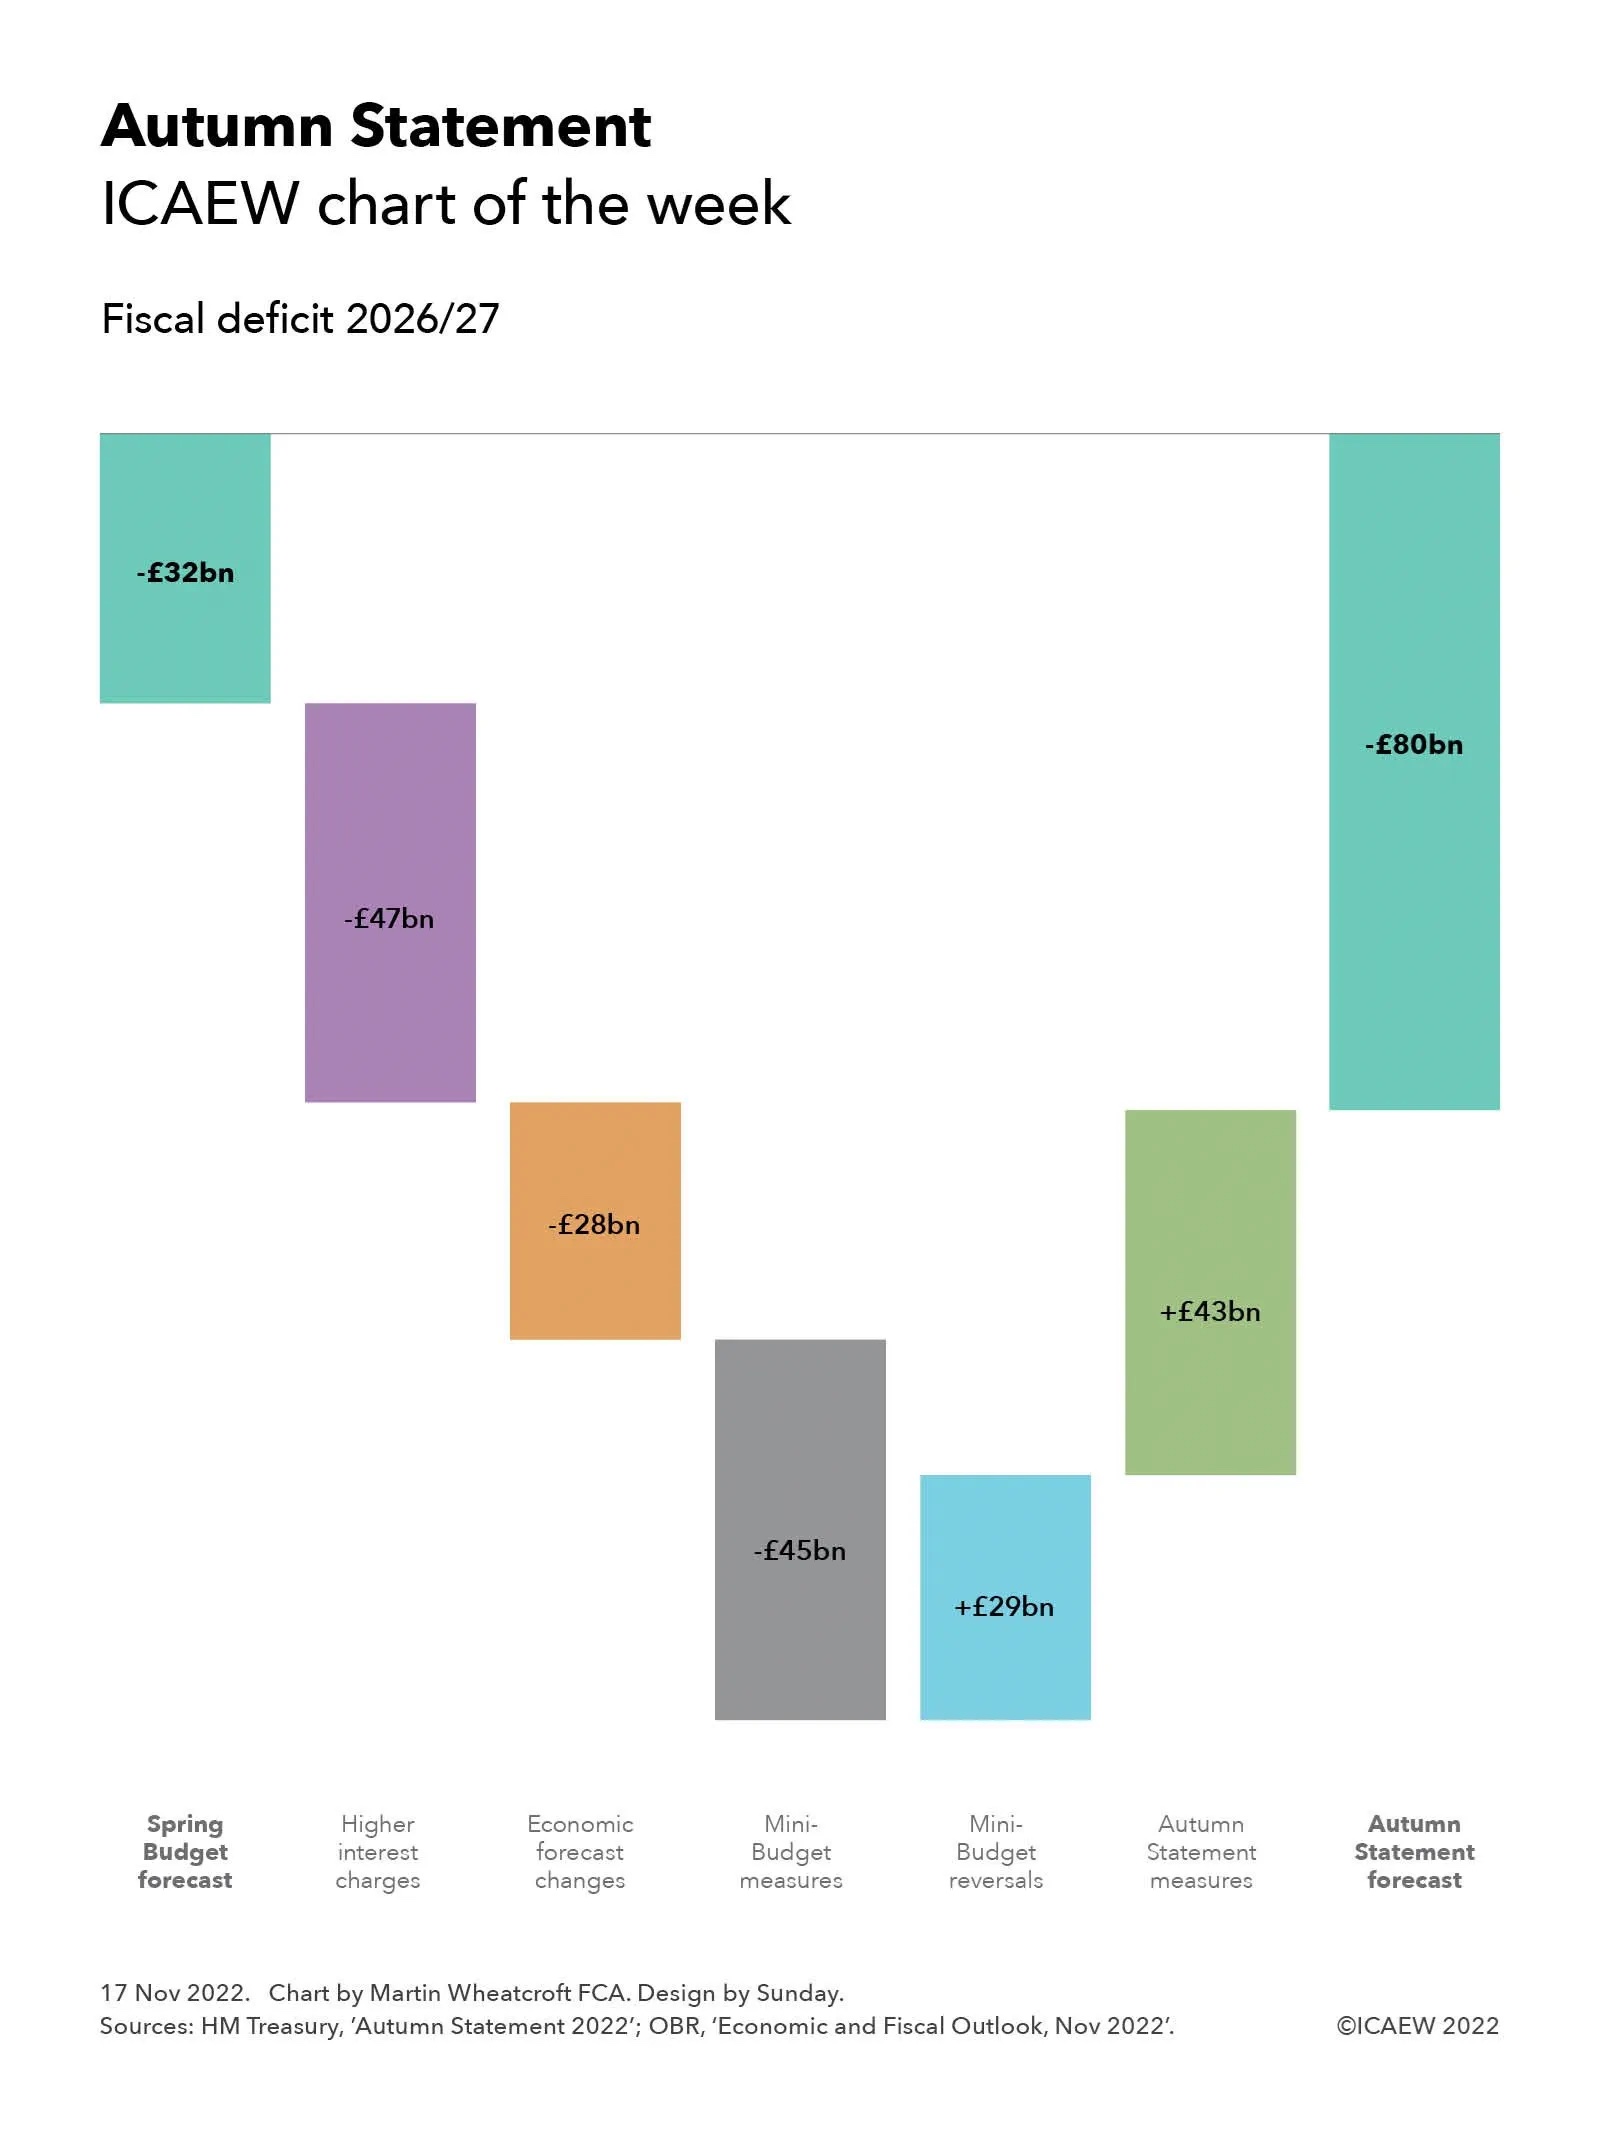
Despite rolling back £32bn out of the £45bn of tax cuts announced in the mini-Budget, Chancellor of the Exchequer Jeremy Hunt is expected to announce tax rises as well as spending cuts when he sets out the Government’s Autumn Statement and medium-term fiscal plan on 17 November.
The consensus is that he needs to find around £50bn a year to reduce the gap between receipts and expenditure if he wants to get the public finances back under control and provide himself with some headroom in case the situation deteriorates further. This could include extending beyond April 2026 the freeze in personal tax allowances announced by Prime Minister Rishi Sunak when he was Chancellor, as well as scaling back the ‘levelling up’ agenda of former Prime Minister Boris Johnson.
You’d think trimming 3% or so off an annual public spending bill of over a trillion pounds a year wouldn’t be that difficult, but each of the main options for cutting spending in the medium term are unpalatable and politically challenging:
- Real-terms cuts in pensions and welfare are possible but difficult to deliver politically during a cost-of-living crisis, as previous Prime Minister Liz Truss discovered when she was forced to deny she was planning to abandon the triple-lock mechanism.
- Real-terms cuts in public sector pay are likely but come with the prospect of much greater disruption from industrial action and increasing difficulties in recruiting and retaining staff.
- Cutting investment in infrastructure and capital programmes is the easiest option to achieve but comes with risks to future economic growth and business investment.
- Greater efficiency is possible but practically difficult to deliver, with significant project delivery risks and the need for sufficient capital investment to be successful.
- Higher fees and charges are possible but risk a political backlash.
- Lowering public service outputs or quality is possible but there are practical limits to how far you can continue to cut funding for many public services without adverse effects.
Forecasts for public spending
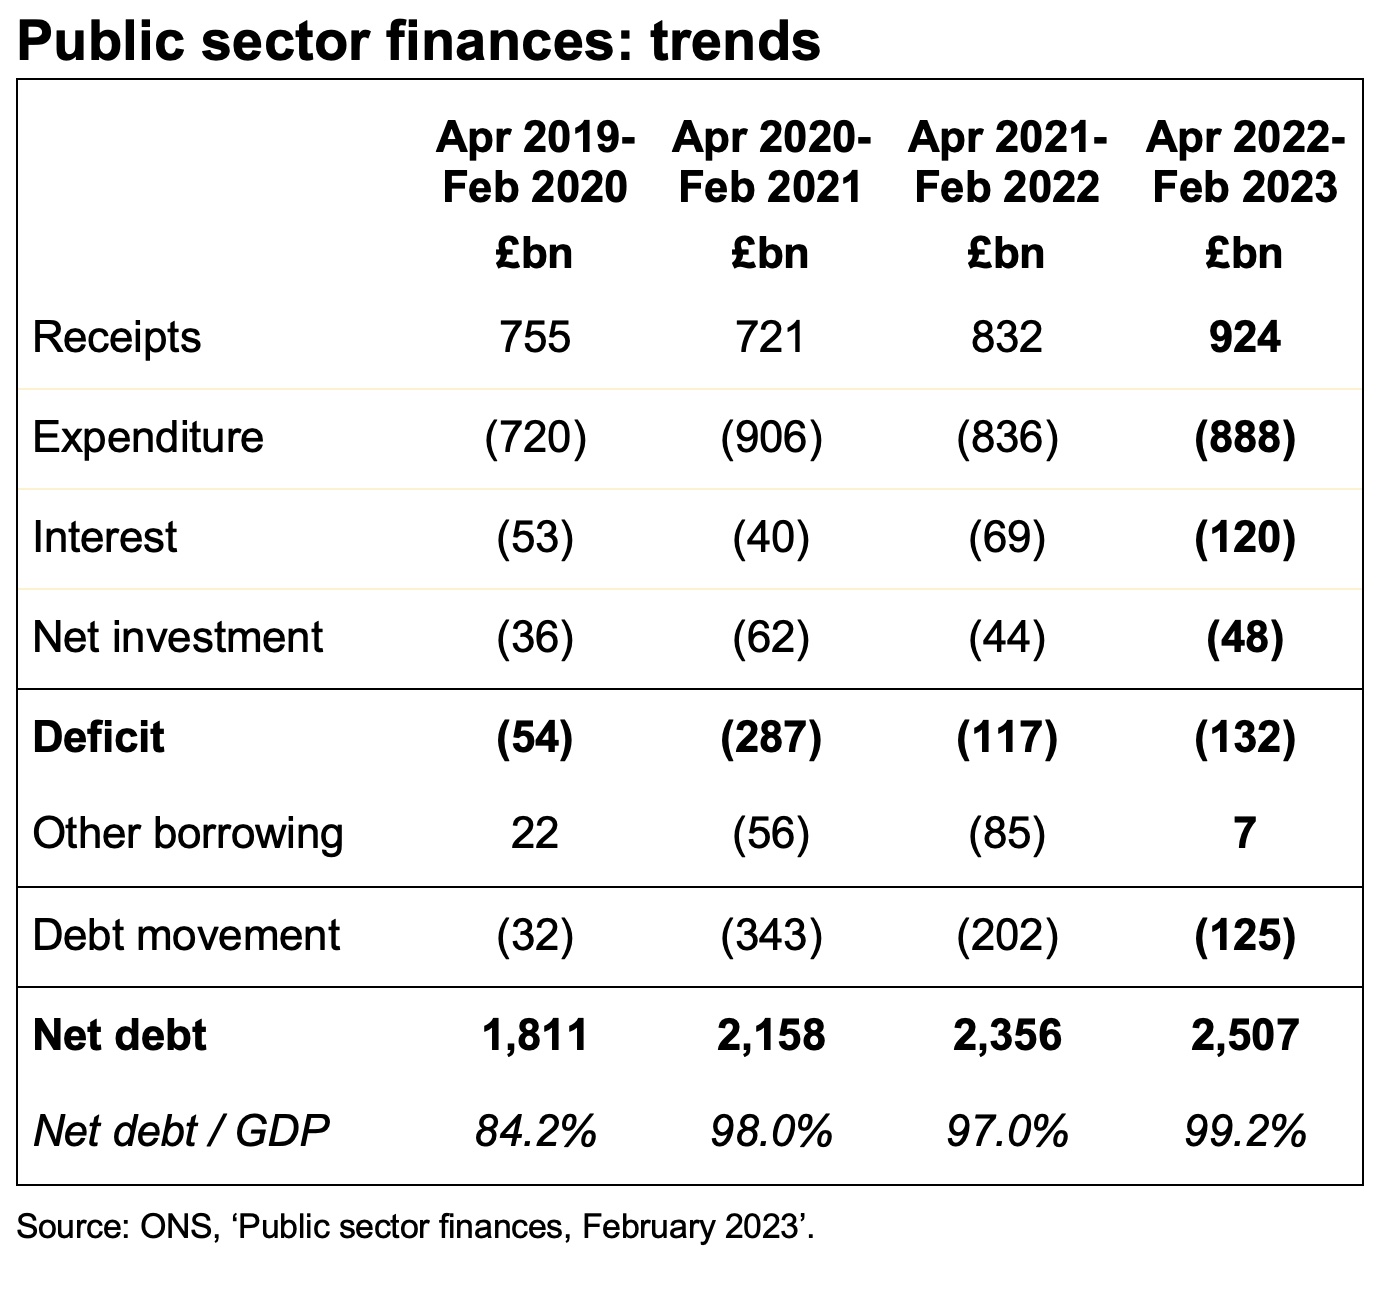
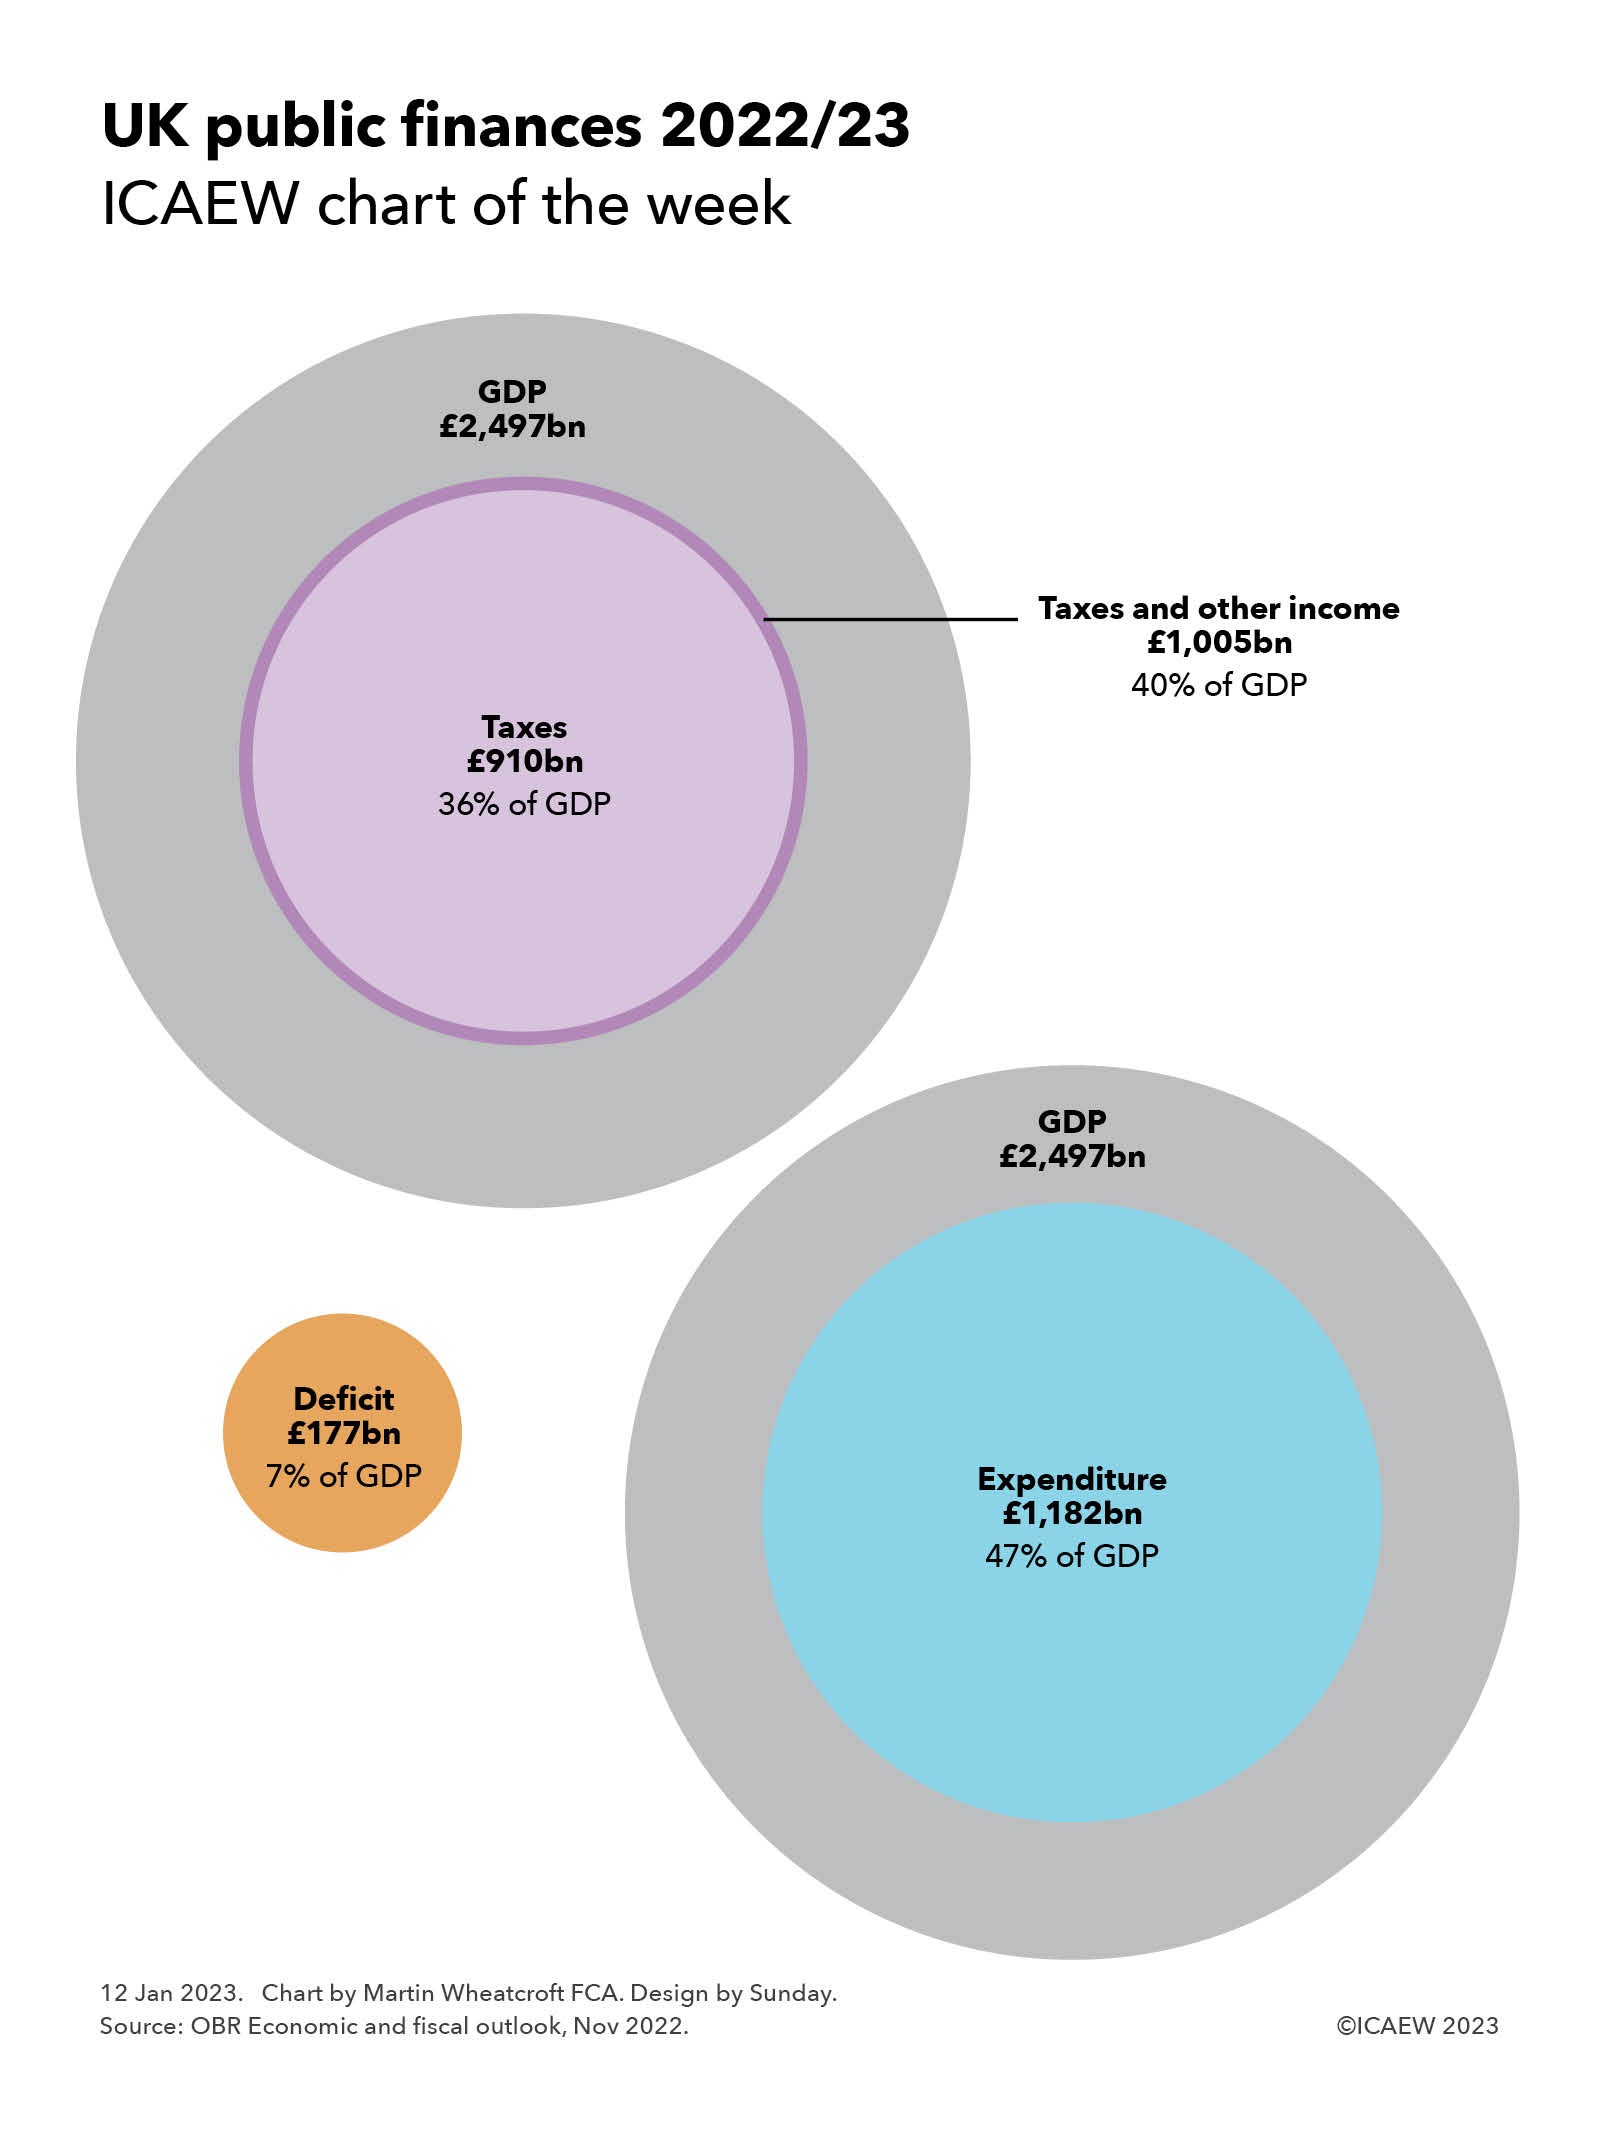
Total managed expenditure is budgeted to amount to £1,087bn in the current financial year ending 31 March 2023 (2022/23), equivalent to approximately £1,340 per month for each of the 67.5m people who live in the UK, or £3,220 per month for each of the 28.1m UK households.
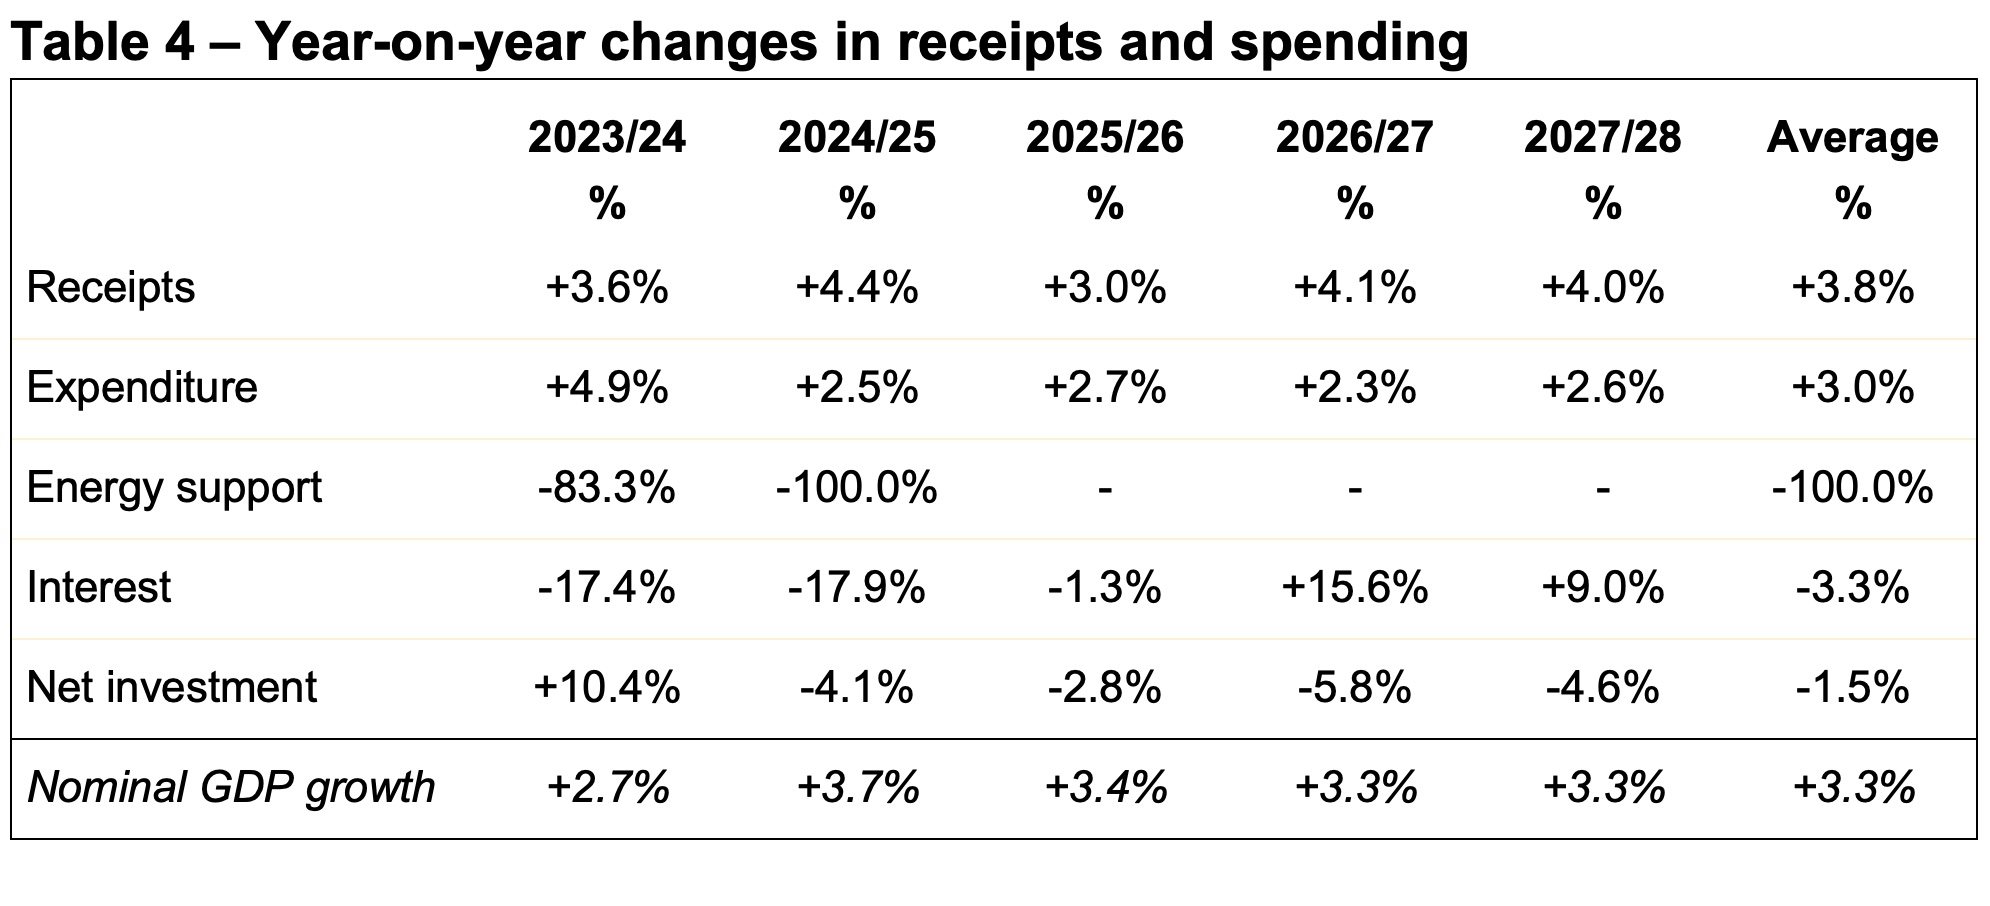
Based on inflation assumptions decided on back in March, the Office for Budget Responsibility (OBR) projected that total spending would experience a real-terms cut of 1.2% to £1,100bn in 2023/24, and then real-terms increases of 0.5% to £1,127bn in 2024/25, 1.4% to £1,166bn in 2025/26 and 1.4% to £1,206bn in 2026/27.
Forecasts for total spending are expected to be revised upwards by the OBR when it reports on 17 November. They will need to reflect higher rates of inflation, significantly higher interest rates, and the cost of the energy support packages announced in May and September 2022 (amended in October). The Institute for Fiscal Studies’ high-level forecast following the mini-Budget suggested that these factors could increase total spending to £1,185bn in 2022/23, £1,201bn in 2023/24, £1,165bn in 2024/25m £1,192bn in 2025/26 and £1,233bn in 2026/27, up £98bn, £101bn, £38bn, £26bn and £27bn respectively from the OBR March forecast.
Fiscal targets
When former Chancellor Kwasi Kwarteng announced on 23 September that he was scrapping the fiscal targets approved by the House of Commons in January this year, he was continuing a pattern of abandoning a succession of fiscal targets as it becomes clear that they have not been, or cannot be, met. Abandoning the existing targets without announcing new ones to take their place is likely to have been one of several contributory factors to the adverse reaction by markets to his proposals.
The latest set of abandoned fiscal targets required each five-year fiscal plan to aim for both a current budget surplus and for a falling debt to GDP ratio by the third year of each forecast period. Kwarteng had been under pressure to replace these with a more realistic fiscal target based on the debt to GDP ratio starting to fall by the fifth year of each forecast period. It is likely that the new Chancellor will adopt this or an even stricter set of targets in the hope of regaining credibility lost by the UK Government over the past few weeks.
Assuming that £43bn of the £45bn annual tax cuts announced in the mini-Budget were implemented, the Institute for Fiscal Studies (IFS) estimated that achieving a falling debt to GDP ratio after 2026/27 would require annual tax rises or public spending cuts of £62bn by 2026/27, equivalent to 5% of total spending that year. On 17 October, the Chancellor brought this estimate down by £27bn, reversing a further £21bn of the mini-Budget tax measures and adding back £6bn a year by cancelling the previously planned one percentage point cut in the rate of basic income tax from April 2024.
This would suggest that the gap remaining to be filled with other tax and spending measures could be in the order of £35bn a year, equivalent to around 3% of total public spending in 2026/27. Adding in a further £10bn to £15bn of tax rises to provide headroom brings this to around £50bn in total.
The IFS highlighted significant risks in its forecast, which assumes that inflation does not persist in the medium term and that economic growth remains below 2%, consistent with the post-financial crisis trend. The IFS also based its forecast on a relatively shallow recession and highlighted how dependent it was on the level of interest rates, which at that point had spiked in response to the mini-Budget. These risks could easily increase the size of the gap between forecast receipts and spending that the Chancellor needs to fill. The Chancellor will be hoping that government borrowing costs continue to moderate following the appointment of Rishi Sunak as Prime Minister, providing the Government with some headroom in the official fiscal forecast.
What makes up public spending?
Budgeted public spending of £1,087bn in the current financial year ending 31 March 2023 can be broadly split between £295bn (27%) on pensions and welfare, £252bn (23%) on health and social care, £436bn (40%) on public services, and £104bn (10%) on debt and other interest.
Spending on public services other than health and social care is budgeted to comprise £126bn (12% of total spending) on education, £59bn (5%) on defence and security, £47bn (4%) on transport, £43bn (4%) on public order and safety and £161bn (15%) on all the other services that central and local government provide.
These numbers are on a fiscal basis as presented in the National Accounts, in accordance with statistical standards that include capital expenditure net of depreciation. They exclude long-term expenditures such as accrued public sector pension obligations that are reported in the IFRS-based Whole of Government Accounts. They are also net of approximately £55bn in fees and charges and £5bn from the proceeds of asset sales.
Hands tied on spending
As the Prime Minister and Chancellor look for potential savings, they are finding that their hands are tied by the financial commitments made by successive governments, especially since the second world war. These commitments created the welfare state we know today, with pensions, welfare benefits, health and social care together now making up half of total public spending. Since the last general election this government has added to these commitments, including a significant expansion in eligibility for adult social care and increasing the value of state pensions through the triple lock mechanism.
Under the long-standing ‘pay-as-you-go’ approach to funding government activities, no money is set aside to meet financial commitments made. Instead, tax receipts, cost savings or additional borrowing are used to pay for financial commitments as they fall due each year. There is no sovereign wealth fund to cushion the blow or to dip into.
The principal challenge for the Chancellor in looking for savings is that more people are living longer. The number of pensioners is expected to increase by 3.3m or 27% from 12.2m to 15.5m over the next 20 years, despite an increase in the state pension age from 66 to 67 over that time. This is driving up the cost of the largest line items within the overall budget: the state pension, the NHS, and social care budgets, over a period when the working age population, the group that pays the most in taxes, is projected to increase by just 4%.
The impact of a growing number of pensioners makes the job of finding savings that much harder, as the savings need to be proportionately larger from other parts of the budget.
Any savings are also on top of hoped-for efficiency savings that have already been incorporated into departmental budgets to stay within the existing spending envelope, as well as dealing with rising procurement costs, higher energy bills and pressure to increase public sector salaries.
Pensions and welfare – £295bn or 27% of budgeted spending
Pensions and welfare spending can be broken down between £121bn for the state pension and pensioner benefits, £48bn in incapacity and disability benefits, and £126bn in working age, child and other welfare benefits and social protection.
Pensions spending is expected to increase over the next five years from a combination of a 1.1m or 9% increase in the number of pensioners and the ratchet effect of the Government’s triple-lock manifesto commitment to raise the state pension in line with whichever is higher: earnings, inflation or 2.5% .
One option to save money compared with existing forecasts would be to restrict the increase in state pensions to below inflation, either by abandoning the triple lock in this Parliament or not re-committing to it beyond the next general election. However, while Rishi Sunak was able to suspend the triple lock in April 2022 on a one-off basis, it is likely to be extremely difficult to find the political support needed to cut the state’s contribution to pensioner incomes in real terms sufficiently to offset a 9% increase in pensioner numbers over the next five years, or a 27% increase over 20 years.
The government could accelerate planned increases in the state pension age, currently set to go from 66 to 67 by 2028 and to 68 by 2046, although to do so might break a promise to give at least 10 years’ notice to those affected. Another option might be to reformulate the triple-lock mechanism, removing the ratchet effect by making it cumulative. This would see above-earnings rises in one year offset by below-earnings rises in subsequent years, subject to not falling below inflation or 2.5% in any particular year.
Real-term cuts in incapacity and disability benefits would also be politically unpalatable, as would further restricting eligibility criteria, even if pencilled in for subsequent years. Several commentators have suggested that the recent rise in the number of people suffering from health conditions and withdrawing from the workforce is because of NHS treatment backlogs that have been exacerbated by the pandemic. One way of cutting the cost of these benefits would be to provide additional funding to the NHS in the short to medium term, which would add rather than subtract from spending in the next few years, even if there is a positive financial benefit in the longer term.
That leaves welfare benefits for those of working age and children, where the IFS has suggested that indexing the uprating of working-age benefits in April 2023 and April 2024 to earnings rather than inflation could reduce the annual welfare bill by £13bn by 2026/27 when compared with existing forecasts. The risk here is that a recession could see the number of claimants rise significantly even if it were possible to cut the amount paid out to each claimant in real terms. Again, proposing real-terms cuts in the financial support offered to the poorest households of this scale during a cost-of-living crisis is likely to be politically challenging.
Another option would be to increase the minimum wage given that more than half of any wage increase would be recovered from claimants on universal credit. This is likely to be difficult to implement in the next couple of years given the current cost-of-doing-business crisis, but it might be possible to pencil in a rise in the second half of the fiscal period.
One area where money could be saved is in tackling fraud and error, with the Department for Work and Pensions estimating that overpayments amounted to £8.6bn in 2021/22, partly offset by underpayments of £2.6bn. However, to do so effectively would likely require a significant simplification of the welfare system, a politically challenging task given this would involve both winners and losers.
Health and social care – £252bn or 23% of total spending
The budget for health and social care this year comprises £211bn for the NHS and other health care, and £41bn for social care, which are both driven by the number of pensioners and the level of long-term health conditions in the adult population in particular.
The focus in recent years has been to constrain the rise in spending on health care on a per patient basis through a combination of greater efficiency and constraining staff pay, while social care funding has been restricted to constrain supply. This has seen a decline in service standards in both health and social care, exacerbated by the pandemic. While there are opportunities to find savings by tackling waste and improving efficiency further, this will be difficult without greater capital investment in hospitals, primary care facilities and digital technology.
In practice, staff shortages, rising drug prices, and a weak pound are likely to add to cost pressures on the health budget, at the same time as calls grow to address poor performance across all areas of service delivery, including ambulance waiting times, long waiting lists for treatment and inadequate cancer outcomes, as well as expanding coverage in areas such as mental health.
Social care spending is also under pressure, not only because of rising pensioner numbers but also because of an expansion of eligibility for adult social care announced by former Prime Minister Boris Johnson. His successor, Prime Minister Liz Truss, made a commitment to retain this expansion despite abolishing the health and social care levy that was going to fund it, adding to size of the problem. There are strong arguments for increasing spending on social care in the near-term to relieve pressure on the NHS.
Potential savings in the short-term are likely to be through pay restraint, and in the medium-term through greater use of technology and consolidation of services. Deferring the introduction of the social care cap could ease funding pressures for a time but would not help the Chancellor achieve his targets in the longer-term. He could save some money compared with existing plans by indexing or otherwise increasing eligibility thresholds for social care over time.
Risks include a further worsening of health outcomes and service standards, a potential collapse in services over this and subsequent winters, and industrial action.
Education – £126bn or 12% of budgeted spending
Education spending this year is estimated to comprise £53bn on secondary education, £34bn or so on primary and pre-school, £27bn on universities and higher education, and £12bn on training, further education, and other education services.
While the falling birth rate is expected to reduce the numbers attending primary schools by around 10% or so over the next five years, the numbers going through (more expensive) secondary schooling are still increasing. In the near term, primary and secondary schools are already struggling to cope with a national pay settlement this year that was higher than allowed for in their existing budgets.
Restraining staff pay and constraining staff numbers are likely to be the main focuses of any cost savings that might be achievable from the schools’ budget, for example by increasing class sizes or merging schools – particularly at primary level. However, teacher shortages, particularly in science, technology, engineering, and mathematics, may make cutting pay in real terms difficult to achieve.
University student numbers are expected to grow by around 6% over the next five years, although the per head cost should come down as inflation increases the numbers who earn over student loan repayment thresholds. The changes in student loan terms that extend the period over which repayments are made should also reduce the cost per student, although these are already built into the existing forecasts.
Capping student numbers and reducing the eligibility of some courses for student loans are being explored as one way of cutting the cost of higher education. However, higher inflation also makes the cash freeze in the cap on university student tuition fees increasingly unsustainable, especially as there are limits on how much further universities can continue to recruit sufficient numbers of international students to make up for real-term cuts in funding for UK students.
The challenge for a government looking for economic growth is that the general consensus is that more not less investment in skills is needed. Investment is especially required in technical education at secondary level and in further education and training for adults. There is also a strong case for extending pre-school provision to support parents back into the workforce (in addition to its educational benefits).
Potential savings in the short term are through pay restraint, in the medium term through school consolidation, and in the longer term as a function of a lower birth rate. Risks and challenges include the competitiveness of the UK economy.
Defence and security – £59bn or 5% of total spending
Defence and security spending in 2022/23 comprises £52bn on defence and armed forces, £5bn on the security services and counter-terrorism policing, and £2bn on war and armed forces pensions.
Over the last fifty years, successive governments have been able to ‘raid’ the defence budget to find money for the rising costs of pensions, health and social care. This is no longer possible given the UK’s commitment to NATO since 2006 to spend a minimum of 2% of national income on defence and security.
In practice, defence spending is expected to increase in the near-term to cover the effect of higher-than-forecast inflation and a weaker pound on the procurement budget, in addition to the costs of providing military aid to Ukraine. These cost pressures are likely to absorb the first stages of the commitment made by former Prime Minister Liz Truss to increase spending on defence and security to 3.0% of national income by 2030.
Pay restraint could help offset some of the rise in spending a little in the short-term but would be politically difficult to sustain over the medium- to long-term, especially if the armed forces continue to struggle to recruit the new soldiers, sailors and aircrew they need. Theoretical savings from better procurement are always discussed, but rarely achieved – at least not in aggregate as cost overruns tend to outweigh any cost savings realised.
There are unlikely to be any potential savings in defence spending. In an increasingly unstable global security situation, most risks primarily relate to not spending enough.
Transport – £47bn or 4% of total spending
Transport spending in 2022/23 is budgeted to comprise £25bn on the railways, £13bn on roads, £6bn on local transport and £3bn in other transport-related expenditures. This includes significant amounts of capital expenditure and is net of passenger fares.
Capital investment in transport infrastructure was a big component of the levelling-up agenda, with a 10% uplift in capital budgets in the 2021 Spending Review. Unfortunately, inflation in construction costs has more than offset this boost in spending, imposing a scaling back of levelling-up ambitions and the potential returns from economic growth unless the government decides to increase the budget to compensate.
Governments looking for spending cuts have often looked at the transport budget as it is relatively easy to defer or cancel capital programmes or cut back on road maintenance in order to achieve a particular financial outcome. With the train companies back in public ownership, cutting back on train services is also an option, as would raising fares on public transport by more than inflation later in the forecast period.
Further reductions in the scope of HS2 and other rail investment programmes have been mooted as options to save money, or at the very least restrict the level of budget overruns that would otherwise require additional funding.
The problem with cutting back on investment in transport is that it is one of the key levers available to government to unlock private sector investment and drive economic growth. There is also a risk to business confidence (and hence business investment) if the UK is not able to deliver major infrastructure programmes it has previously committed to.
Potential savings include pay restraint, cutting back on road maintenance, fewer train services, cutting back on road and rail investment programmes, and potentially cutting back or means testing free public transport provided to pensioners. Road charging and higher train fares are also options. Risks are the economic damage of continued industrial action and weaker economic growth, particularly in regional economies outside London and the South East.
Public order and safety – £43bn or 4% of total spending
Spending on public order and safety in 2022/23 is budgeted to comprise £23bn on policing, £8bn on the court system, £7bn on prisons, £3bn on fire and rescue services, and £2bn on border control.
Cuts in spending on police, courts, prisons and fire services delivered over the past decade were in the context of falling crime and a preceding decade of rising pay and investment. The current context is very different, with crime rising, significant delays in the courts, severe prison overcrowding, and heightened concerns about fire safety since the Grenfell fire.
The existing budget includes funding for reversing cuts in police numbers since 2010 but significant problems in the court system is likely to need additional funding. Police and prison staff recruitment challenges mean it will be difficult to restrain pay rises into the medium term.
Potential savings include pay restraint, cuts in planned police numbers, and greater use of technology. Risks include rising crime, failed prosecutions, issues with prison safety and the quality of rehabilitation, and underperforming emergency services.
Other public services – £161bn or 15% of total spending
Spending on ‘everything else’ goes across a large number of budget headings, including £30bn on industry and agriculture, £19bn on research and development, £12bn on international development and aid, £11bn on housing, £10bn on waste management, £9bn on the EU exit settlement (which will reduce significantly in future years), £8bn on culture, recreation and sport, £5bn on the BBC and Channel 4, and £2bn on foreign affairs among numerous other public services. These budget headings include most local public services outside of social care and transport, in addition to central government departments, the devolved administrations and around 500 other public bodies.
Despite a decade or so of ‘austerity’ spending restraint, there should be plenty of opportunity to find savings in many public services. Better use of technology could help improve services as well as enable them to be delivered at lower cost. However, delivering services at significantly lower cost typically requires the successful delivery of technology and restructuring programmes that carry significant financial and political risks, as well as requiring additional investment in the short-term. The more that is attempted, the higher the risk of overruns or failed attempts.
There are also significant opportunities to reduce losses incurred from fraud or waste, although this also requires investment in improving governance, processes, and financial controls at all levels of government.
Even where savings are achieved, the impact on overall government spending is limited – even if you could cut every single budget in this category by 5%, this would only reduce total spending by 0.75%.
Some budget headings are discretionary and so could in theory be reduced by much greater amounts, for example spending on research and development or funding for the arts. However, these types of spending tend to be important to delivering on other government objectives, such as fostering economic development, regenerating deprived communities, or supporting key industries such as tourism – in addition to being considered important activities in their own right.
There has been some discussion about cutting the size of the civil service, which at 510,000 is about 9% of the overall public sector workforce. Bringing total numbers down by 91,000 or 18% to the pre-Brexit position as mooted by some in government is likely to be extremely challenging to deliver in practice. Not only does the government need to deliver additional requirements such as for customs and border control, international trade negotiation, and other previously shared responsibilities that have reverted to the UK, but the events of the past few years have highlighted how government has struggled to deliver on its policy priorities.
The three largest departmental workforces are the Department for Work & Pensions (DWP) at 94,000, the Ministry of Justice (MoJ) at 87,000 and HM Revenue & Customs (HMRC) at 71,000. In theory, the automation of manual processes and the replacement of systems that currently require extensive manual intervention could enable cuts to be made in staff at all three departments, especially the DWP. However, the risks of making major systems changes, a court system under extreme pressure, and the risks to tax revenue of cutting staff significantly in the near-term, as well increased risks of fraud and error, makes this far from a cost-free choice.
There are also political difficulties in cutting non-staff areas of these budgets, such as agricultural subsidies where there are vocal constituencies likely to object to significant reductions in the amounts paid.
One budget heading that has already been cut is spending on international development, which is now set at 0.5% of national income, with a plan to return to the previous level of 0.7% of national income once the public finances are in better shape. Some members of the governing party have suggested reducing this below 0.5%, despite a manifesto commitment to keep to the 0.7% target. There have also been suggestions that the accounting goalposts could be moved to include existing domestic spending in the UK to be classified as international development, enabling the government to reduce the amount spent outside the UK.
Another area where costs are rising are public sector pensions, as former public servants are also living longer, with pensions-in-payment contractually linked to rises in the consumer prices index. Ironically, the switch in the last decade from final salary to average salary calculations reduces the effect that constraining public sector pay has on the eventual bill. Public sector pensions are relatively generous compared with the private sector and cutting the accrual rate for pension entitlements could save substantial amounts in the longer-term, assuming this could be successfully negotiated with the unions. This would allow for higher base salaries, which might help with recruitment given pensions benefits are often undervalued by recipients.
Potential savings again include pay restraint, cutting staff numbers, cutting public sector pension benefits, procurement savings, property consolidation (already underway), technology, cutting discretionary spending, greater use of outsourcing, cutting capital programmes including infrastructure. Risks include a further deterioration in the quality of public services, problems in delivering technology and transformation programmes, failure to achieve key government objectives that depend on effective public services, poor morale affecting the effective delivery of services, and the potential that any cuts in staff numbers will be reversed as governments make new commitments.
Interest – £104bn or 10%
The interest budget in 2022/23 comprises £83bn of debt interest and £21bn of other interest, principally on local authority and other funded public sector pensions. (No interest is recorded in the fiscal numbers on the much larger amount of unfunded pension obligations).
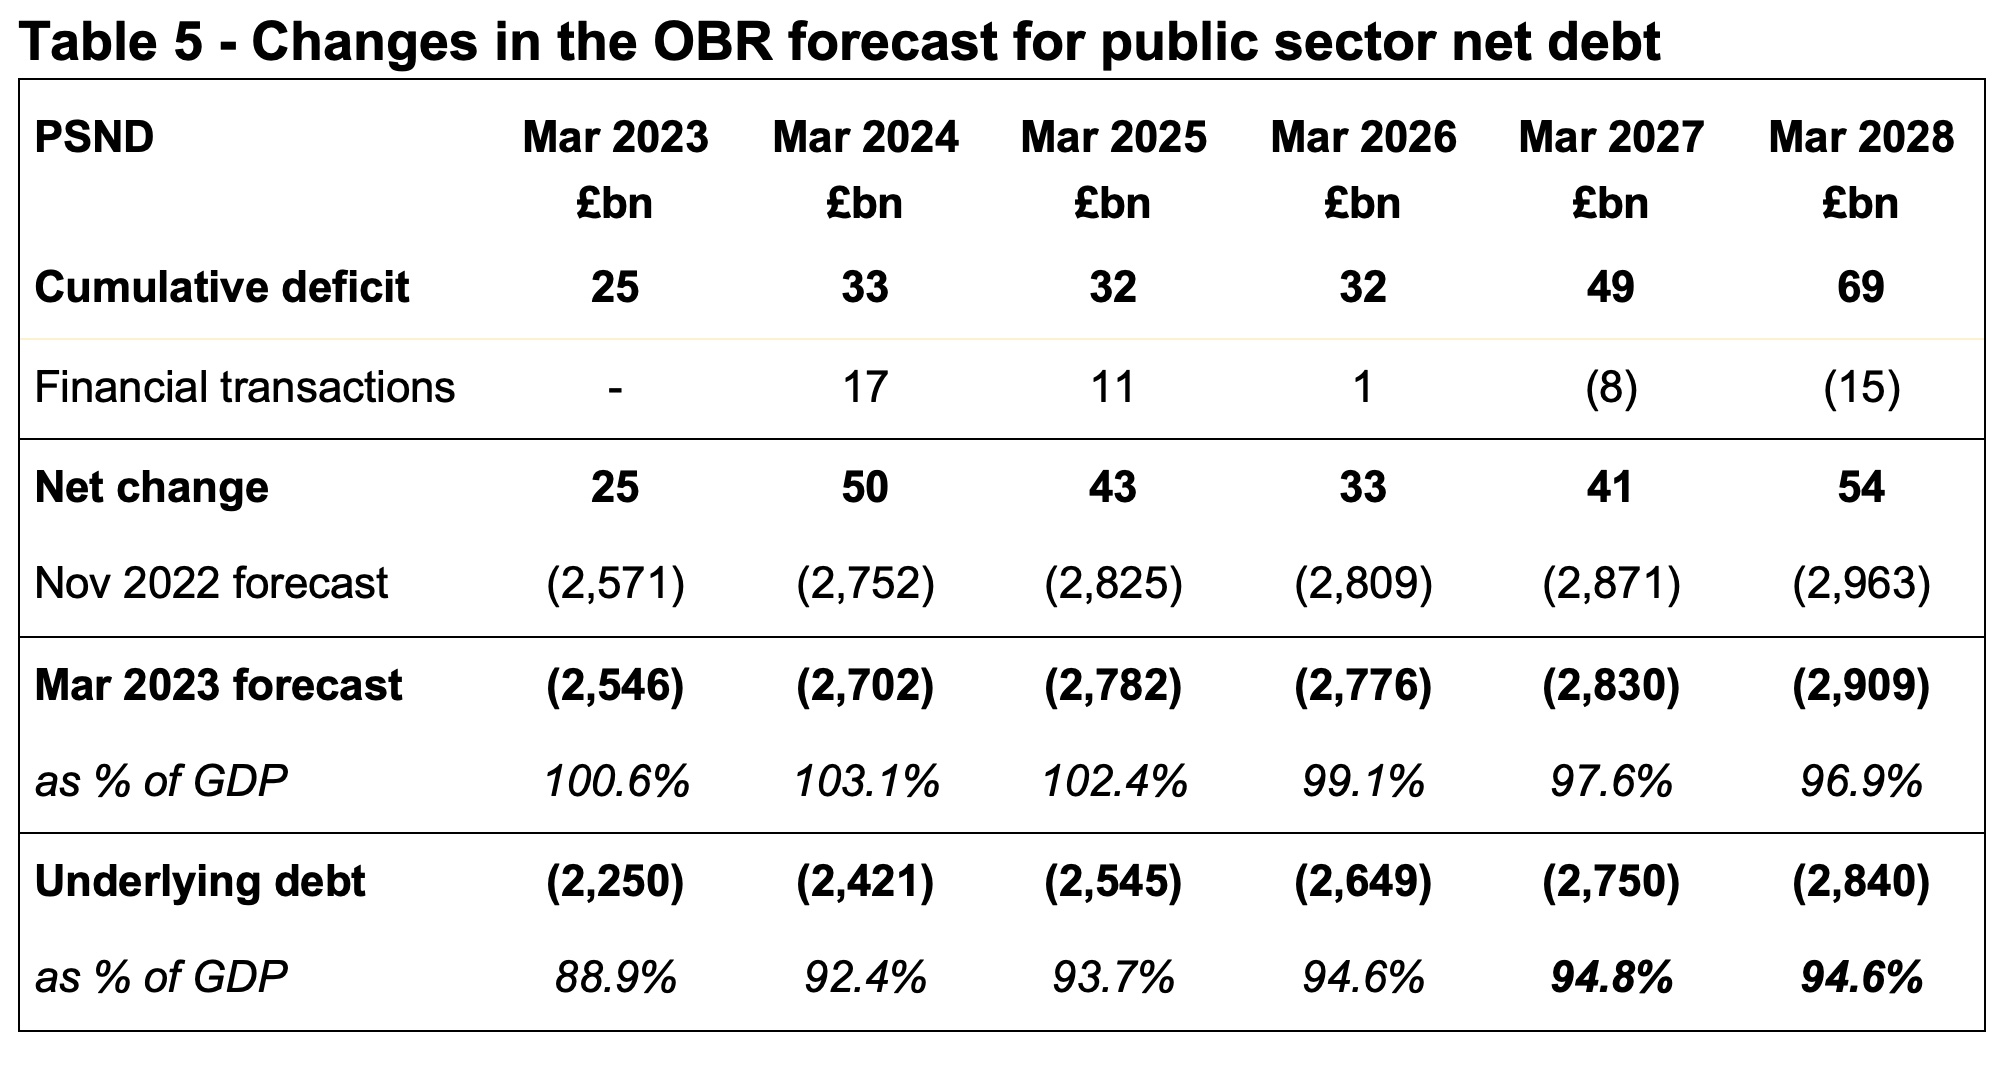
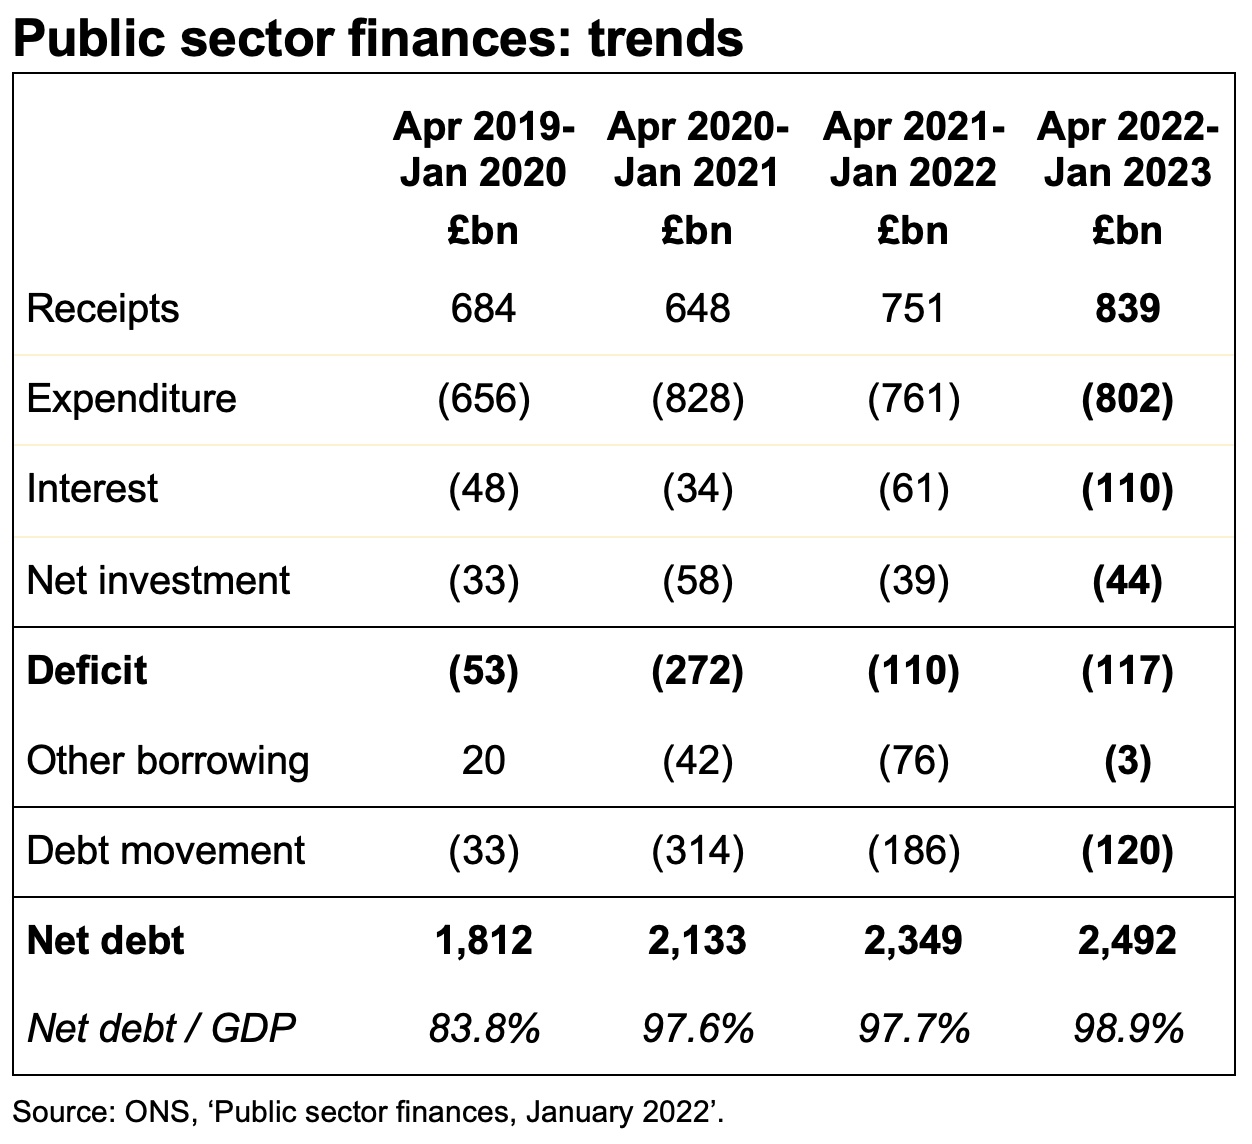
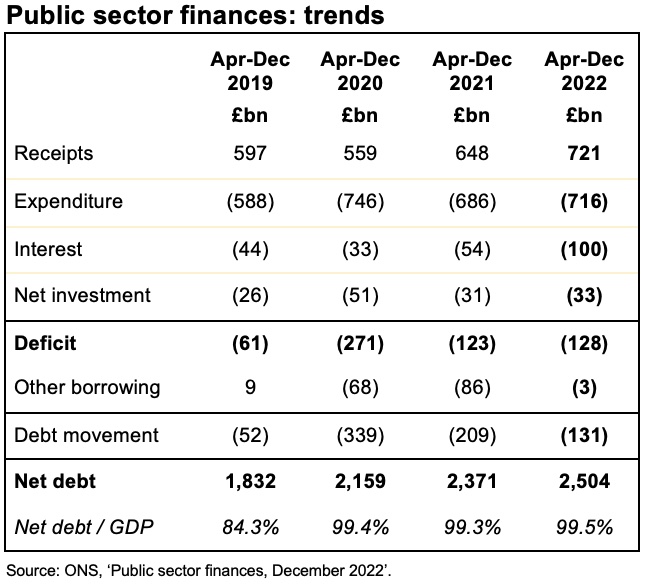
Public sector net debt has more than quadrupled over the last fifteen years from £0.5tn in 2008 to £2.4tn today, but ultra-low borrowing costs over that time has kept the cost of servicing that debt down to historically low levels.
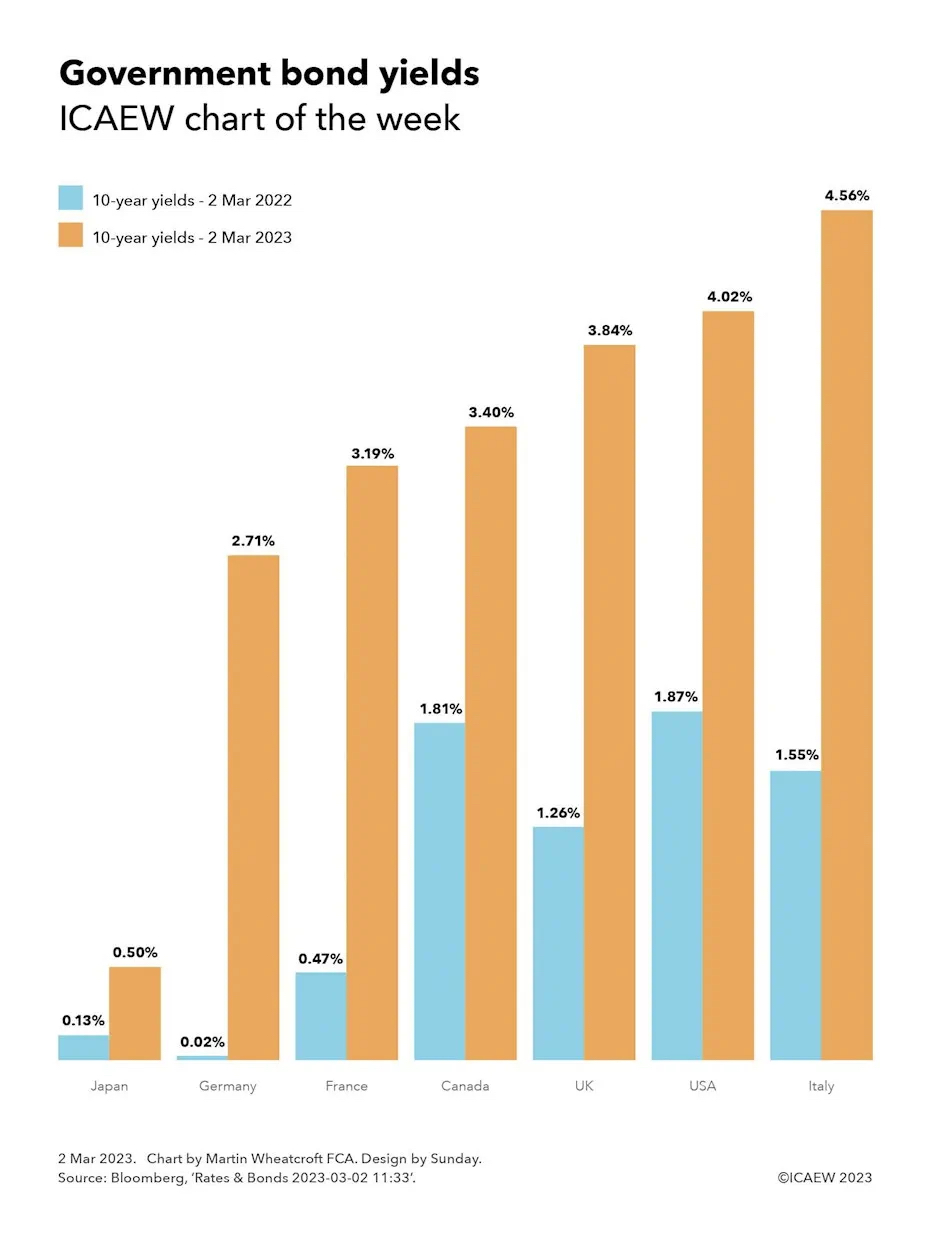
The Debt Management Office within HM Treasury has been able to extend maturities to an average of around 15 years, locking in very low interest rates as it has raised or refinanced debt over the last decade. However, the Bank of England’s quantitative easing programme of gilt purchases has in effect swapped a substantial proportion of this fixed rate debt into variable rate central bank deposits, making the public finances much more sensitive to increases in official interest rates. The Debt Management Office has also been successful in hedging the low levels of inflation we have experienced over the last decade through the issue of bonds that rise in line with the retail prices index. However, this goes the other way in periods of higher inflation, with increasing liabilities on index-linked gilts offsetting the inflationary benefit of a faster growing denominator on the debt to GDP ratio.
The IFS expects debt interest to increase by £23bn to £106bn in the current financial year, primarily as a consequence of higher interest rates and higher inflation on index-linked debt. Even with inflation coming down in the next year or two, it still expects debt interest in 2026/67 to be £106bn, more than double the £51bn forecast by the OBR in March.
The two main levers for restricting rises in the debt interest bill are to keep borrowing down, which implies higher taxes or lower spending compared with the current path and to keep interest rates at the lowest level possible by regaining credibility with the markets, which also implies higher taxes or lower spending. Some commentators have estimated the benefit of the change in Prime Minister as being between £6bn and £12bn in lower annual interest charges than they might otherwise have been the case.
Some commentators have suggested that the Bank of England could implement non-interest paying tiered reserves, in effect arbitrarily ceasing or reducing the base rate payable on a proportion of deposits held by (mostly UK) banks and financial institutions. This would reduce the cost of borrowing on that element of the public debt, but one risk is that the overall interest bill might end up being higher depending on how banks and debt markets responded to such a significant change in monetary policy.
One ‘creative accounting’ approach would be to change the debt measure in the debt to GDP ratio used in fiscal targets. This was amended a few years ago to exclude the rising amounts of debt being taken on by the Bank of England to fund quantitative easing and Term Funding Scheme low-cost loans for high-street banks. Reverting to the headline measure for public sector net debt would contribute to the debt to GDP ratio falling as quantitative easing is unwound and Term Funding Scheme loans are repaid.
Potential savings – none compared with current plans, absent the more radical suggestion of tiered reserves. However, the extent of the cost increase can be limited through improved fiscal credibility and constraining the amount of borrowing.
Other options
More radical options are possible, but these are likely to be extremely difficult without substantial political support from the public, such as that provided by a general election mandate.
For example, privatisation could move responsibility for some taxpayer funded services that are currently provided by public bodies to the private sector. The challenge here is that some public subsidy may still be needed even after privatisation, reducing the amount of any saving to the taxpayer. This would likely increase the burden on those of working age who would have to pay to use any service that was privatised, while still paying through their taxes for pensioners, children and the less well-off to use that service. There is also a risk that the overall cost to the public is higher, given that the bulk purchasing effect of procuring services collectively could be lost depending on the business model chosen.
Historical precedence is not helpful here, in particular the privatisation of the railways in Great Britain in 1996. This ended up being renationalised unintentionally following track-owner Railtrack’s collapse in 2002 and the failure of the train operating company franchise system in 2020. Trying again would be a ‘brave’ choice politically even if it might be possible to reduce the level of public subsidy required with a different financial model.
Other radical options include ending the provision of some public services or scaling them back significantly, but in most cases the political backlash could be significant in comparison with the level of savings that might be possible.
Long-term reform
One of the reasons the UK is in a difficult fiscal situation is the short-term focus of successive governments that have continued to add to the nation’s financial commitments without setting aside funding to pay for them. This has made the public finances increasingly less resilient to face economic shocks such as that seen in the financial crisis a decade and a half ago, the pandemic over the past two and a half years, and the cost-of-living crisis that we are currently going through.
While finding savings in the short-term is likely to be extremely difficult, over a long period there are more options to reduce the cost of the state. A good example is social care, where it might be possible to establish long-term insurance arrangements for those currently in their 20s and 30s that would eventually – in 40 to 50 years’ time – significantly reduce the level of public funding required. Similarly, the state pension could be replaced for those now entering the workforce by collective defined contribution pension funds such as those seen in other countries.
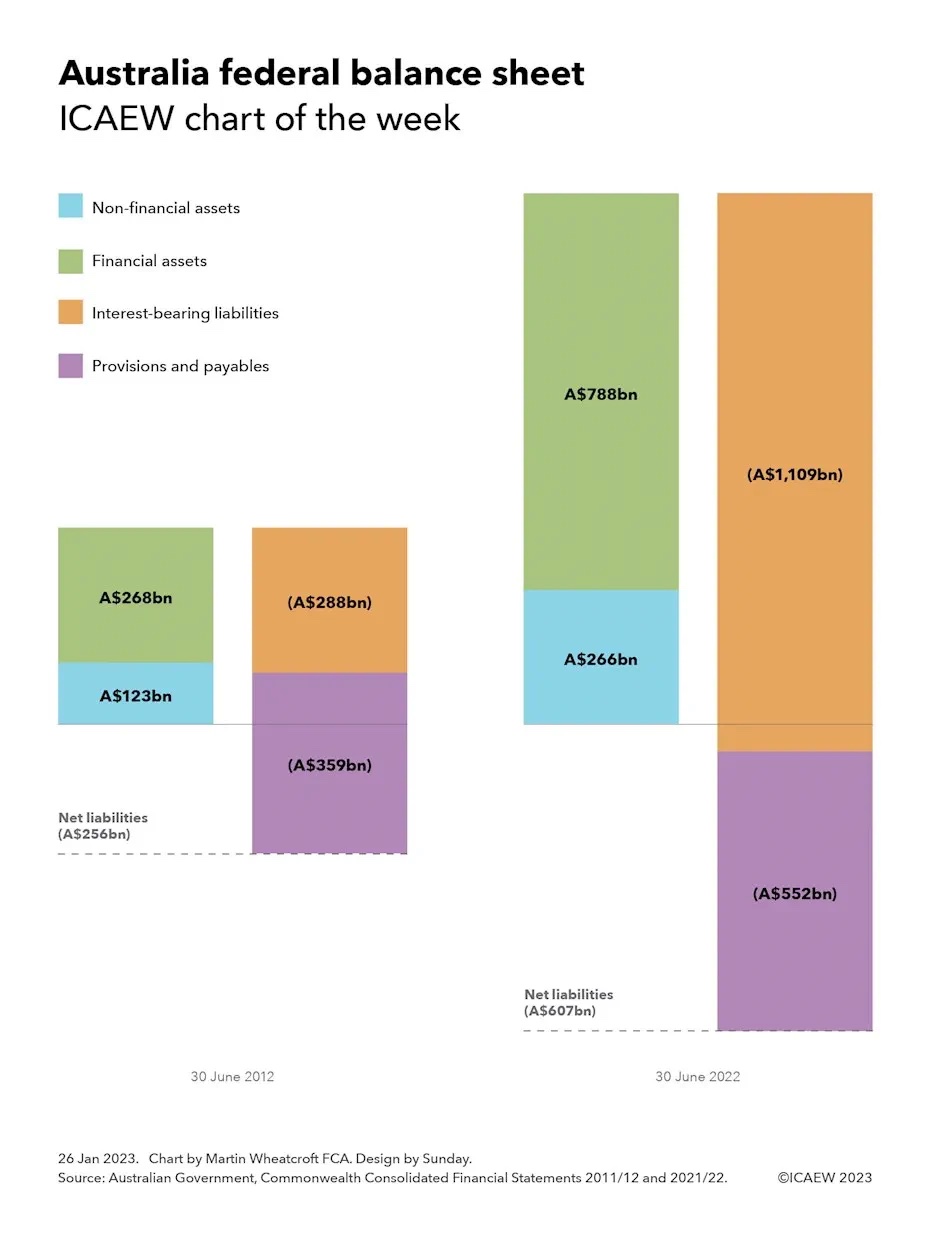
For example, Australia has strengthened its public finances significantly with reforms such as replacing unfunded defined benefit pension schemes for federal employees with defined contribution pension funds, and the establishment of a sovereign wealth fund to support the payment of pensions and welfare benefits.
Conclusion
Prime Minister Rishi Sunak and Chancellor of the Exchequer Jeremy Hunt have a difficult task in trying to reduce the gap between receipts and expenditure. Politically it will be difficult to raise taxes, but there will also be political, financial and operational consequences and risks in how they choose to cut spending. And with an increased focus by the markets on the credibility of their plans, there will be less room to pencil in optimistic ‘anticipated’ savings into the later years of the five-year forecast period.
The first challenge they face will be in how to reengineer the energy support schemes for both households and businesses from April 2023 onwards. As these are time limited, this won’t help bridge the gap in later years, but it will enable them to be more targeted in how support is provided over the next couple of years, as well as potentially reducing the overall cost that needs to be funded by long-term borrowing.
Each of the main options for cutting spending in the medium-term are unpalatable and politically challenging:
- Real-terms cuts in pensions and welfare are possible but difficult to deliver politically during a cost-of-living crisis, as previous Prime Minister Liz Truss discovered when she was forced to deny she was planning to abandon the triple-lock mechanism.
- Real-terms cuts in public sector pay are likely but come with the prospect of much greater disruption from industrial action and increasing difficulties in recruiting and retaining staff.
- Cutting investment in infrastructure and capital programmes is the easiest option to achieve but comes with risks to future economic growth and business investment.
- Greater efficiency is possible but practically difficult to deliver, with significant project delivery risks and the need for sufficient capital investment to be successful.
- Higher fees and charges are possible but risk a political backlash.
- Lowering public service outputs or quality is possible but there are practical limits to how far you can continue to cut funding for many public services without adverse effects.
Over the last fifteen years, successive governments have been able to borrow their way out of trouble even as debt has mounted, and the resilience of the public finances has weakened. That era is no more, with providers of finance to the UK Government now asking much more challenging questions about how the government can pay its way.
Tough choices will need to be made.
Martin Wheatcroft FCA is a strategy consultant, adviser on public finances, and the author of Simply UK Government Finances 2022/23.
This article was originally published by ICAEW.