Year-to-date deficit of £119bn is £5bn lower than latest Office for Budget Responsibility forecast – but is still £11bn worse than this time last year.
Public sector finances for December 2023, released by the Office for National Statistics (ONS) on Tuesday, reported a provisional deficit of £8bn – less than expected – while at the same time revising the year-to-date deficit down by £5bn. This brought the cumulative deficit for the first three-quarters of the financial year to £119bn, £11bn more than in the same nine-month period last year.
Alison Ring OBE FCA, ICAEW Director for Public Sector and Taxation, comments: “Today’s numbers show a cumulative deficit of £119bn for the first three-quarters of the financial year, the fourth highest on record. This should be close to the total at the end of the tax year, as income from self-assessment tax receipts in January is likely to offset deficits in February and March. At £5bn less than the Office for Budget Responsibility’s latest forecast, the Chancellor will be pleased by this marginal improvement in fiscal headroom just when he needs it most.
“However, the Chancellor will still be concerned by the tough economic landscape, with disappointing retail sales data for the final quarter of 2023 and an unexpected rise in inflation last month, and what that might mean for the fiscal forecasts. He is under significant pressure to cut taxes ahead of the general election, but will be all too aware of the need for greater investment in public services and infrastructure if he is to be able to lay the foundations for economic growth in the next Parliament. The risk of local authorities going bust will also be on his mind as he seeks to generate positive economic vibes going into the general election campaign.”
Month of December 2023
The provisional shortfall in taxes and other receipts compared with total managed expenditure for the month of December 2023 was £8bn, made up of tax and other receipts of £89bn less total managed expenditure of £97bn, up 6% and down 3% respectively compared with December 2022.
This was the lowest December deficit since 2019, principally because interest on Retail Prices Index-linked debt fell from £14bn in December 2022 to close to zero in December 2023.
Public sector net debt as at 31 December 2023 was £2,686bn or 97.7% of GDP, up £15bn during the month and £146bn higher than at the start of the financial year.
Nine months to December 2023
The provisional shortfall in taxes and other receipts compared with total managed expenditure for the first three quarters of the financial year to December 2023 was £119bn, £11bn more than the £108bn deficit reported for the first nine months of 2022/23.
This reflected a year-to-date shortfall between tax and other receipts of £776bn and total managed expenditure of £895bn, both up 6% compared with April to December 2022.
Inflation benefitted tax receipts for the first nine months compared with the same period in the previous year, with income tax up 10% to £178bn and VAT up 7% to £150bn. Corporation tax receipts were up 18% to £76bn, partly reflecting the increase in the corporation tax rate from 19% to 25% from 1 April 2023, while national insurance receipts were up by just 1% to £132bn as the abolition of the short-lived health and social care levy in 2022/23 offset the effect of wage increases in the current financial year.
Council tax receipts were up 6% to £33bn, but stamp duty on properties was down by 27% to £10bn and the total for all other taxes was down by 3% to £112bn as economic activity slowed. Non-tax receipts were up 11% to £84bn, primarily driven by higher investment income and higher interest receivable on student loans.
Total managed expenditure of £895bn in the nine months to December 2023 can be analysed between current expenditure excluding interest of £761bn, interest of £97bn and net investment of £37bn, compared with £841bn in the same period in the previous year, comprising £722bn, £103bn and £16bn respectively.
The increase of £39bn or 5% in current expenditure excluding interest was driven by a £24bn increase in pension and other welfare benefits (including cost-of-living payments), £15bn in higher central government pay and £8bn in additional central government procurement spending, less £6bn in lower subsidy payments (principally relating to energy support schemes) and £2bn in net other changes.
The fall in interest costs for the nine months of £6bn to £97bn comprises an £18bn or 39% fall to £28bn for interest accrued on index-linked debt from a lower rate of inflation, partially offset by a £12bn or 21% increase to £69bn for interest not linked to inflation from higher interest rates.
The £21bn increase in net investment spending to £37bn in the first nine months of the current year is distorted by a one-off credit of £10bn arising from changes in interest rates and repayment terms of student loans recorded in December 2022. Adjusting for that credit, the increase of £11bn or 42% reflects high construction cost inflation, among other factors, which saw a £14bn or 20% increase in gross investment to £85bn, less a £3bn or 7% increase in depreciation to £48bn.
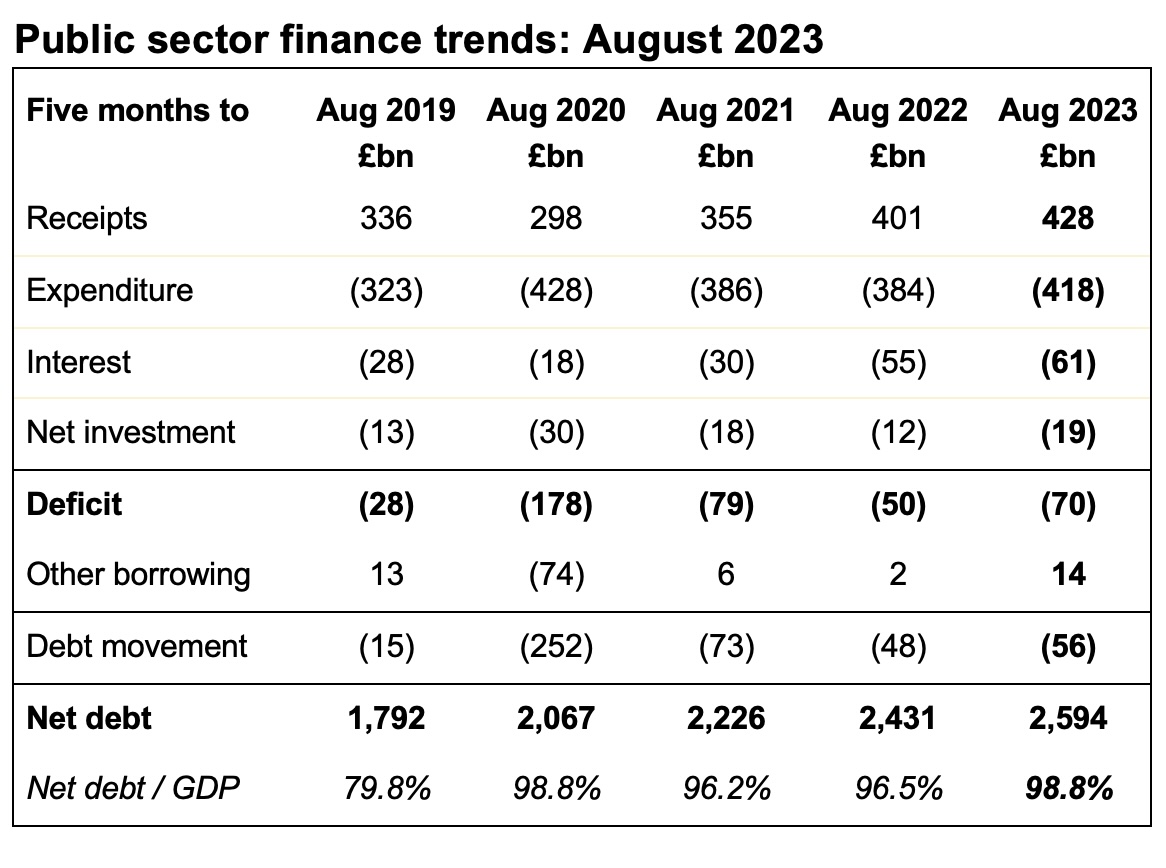
Public sector finance trends: December 2023
![Table showing fiscal numbers for the nine months to Dec 2019, 2020, 2021, 2022 and 2023.
Receipts: 597 | 560 | 653 | 733 | 776
Expenditure: (588) | (746) | (686) | (722) | (761)
Interest: (44) | (33) | (55) | (103) | (97)
Net investment: (26) | (51) | (35) | (16) | (37)
[subtotal] Deficit: (61) | (270) | (123) | (108) | (119)
Other borrowing: 3 | (67) | (85) | (8) | (27)
[total] Debt movement: (58) | (337) | (208) | (116) | (146)
Net debt: 1,835 | 2,152 | 2,360 | 2,497 | 2,686
Net debt / GDP: 84.8% | 98.7% | 97.9% | 95.8% | 97.7%](https://martinwheatcroft.com/wp-content/uploads/2024/02/Public-sector-finance-trends-2023-12.jpg)
The cumulative deficit of £119bn for the first three-quarters of the financial year is £5bn below the Office for Budget Responsibility (OBR)’s November 2023 forecast of £124bn for the nine months to December 2023. The OBR is also forecasting a full year forecast of £124bn as it expects self-assessment tax receipts in January to offset projected deficits in February and March 2024.
Balance sheet metrics
Public sector net debt was £2,686bn at the end of December 2023, equivalent to 97.7% of GDP.
The debt movement since the start of the financial year is £146bn, comprising borrowing to fund the deficit for the nine months of £119bn plus £27bn in net cash outflows to fund lending to students, businesses and others, net of loan repayments and working capital movements.
Public sector net debt is £871bn more than the £1,815bn reported for 31 March 2020 at the start of the pandemic and £2,330bn more than the £538bn number as of 31 March 2007 before the financial crisis, reflecting the huge sums borrowed over the last couple of decades.
Public sector net worth, the new balance sheet metric launched by the ONS this year, was -£715bn on 31 December 2023, comprising £1,584bn in non-financial assets and £1,049bn in non-liquid financial assets minus £2,686bn of net debt (£296bn liquid financial assets – £2,982bn public sector gross debt) and other liabilities of £662bn. This is a £100bn deterioration from the -£615bn reported for 31 March 2023.
Revisions
Caution is needed with respect to the numbers published by the ONS, which are expected to be repeatedly revised as estimates are refined and gaps in the underlying data are filled.
The latest release saw the ONS revise the reported deficit for the eight months to November 2023 down by £5bn from £116bn to £111bn as estimates of tax receipts and expenditure were updated for better data, while the debt to GDP ratio at the end of November 2023 was revised down by 0.1 percentage points from 97.5% to 97.4%.
The ONS also revised its estimate for the deficit for the financial year to March 2023, down by £1bn to £130bn for 2022/23.

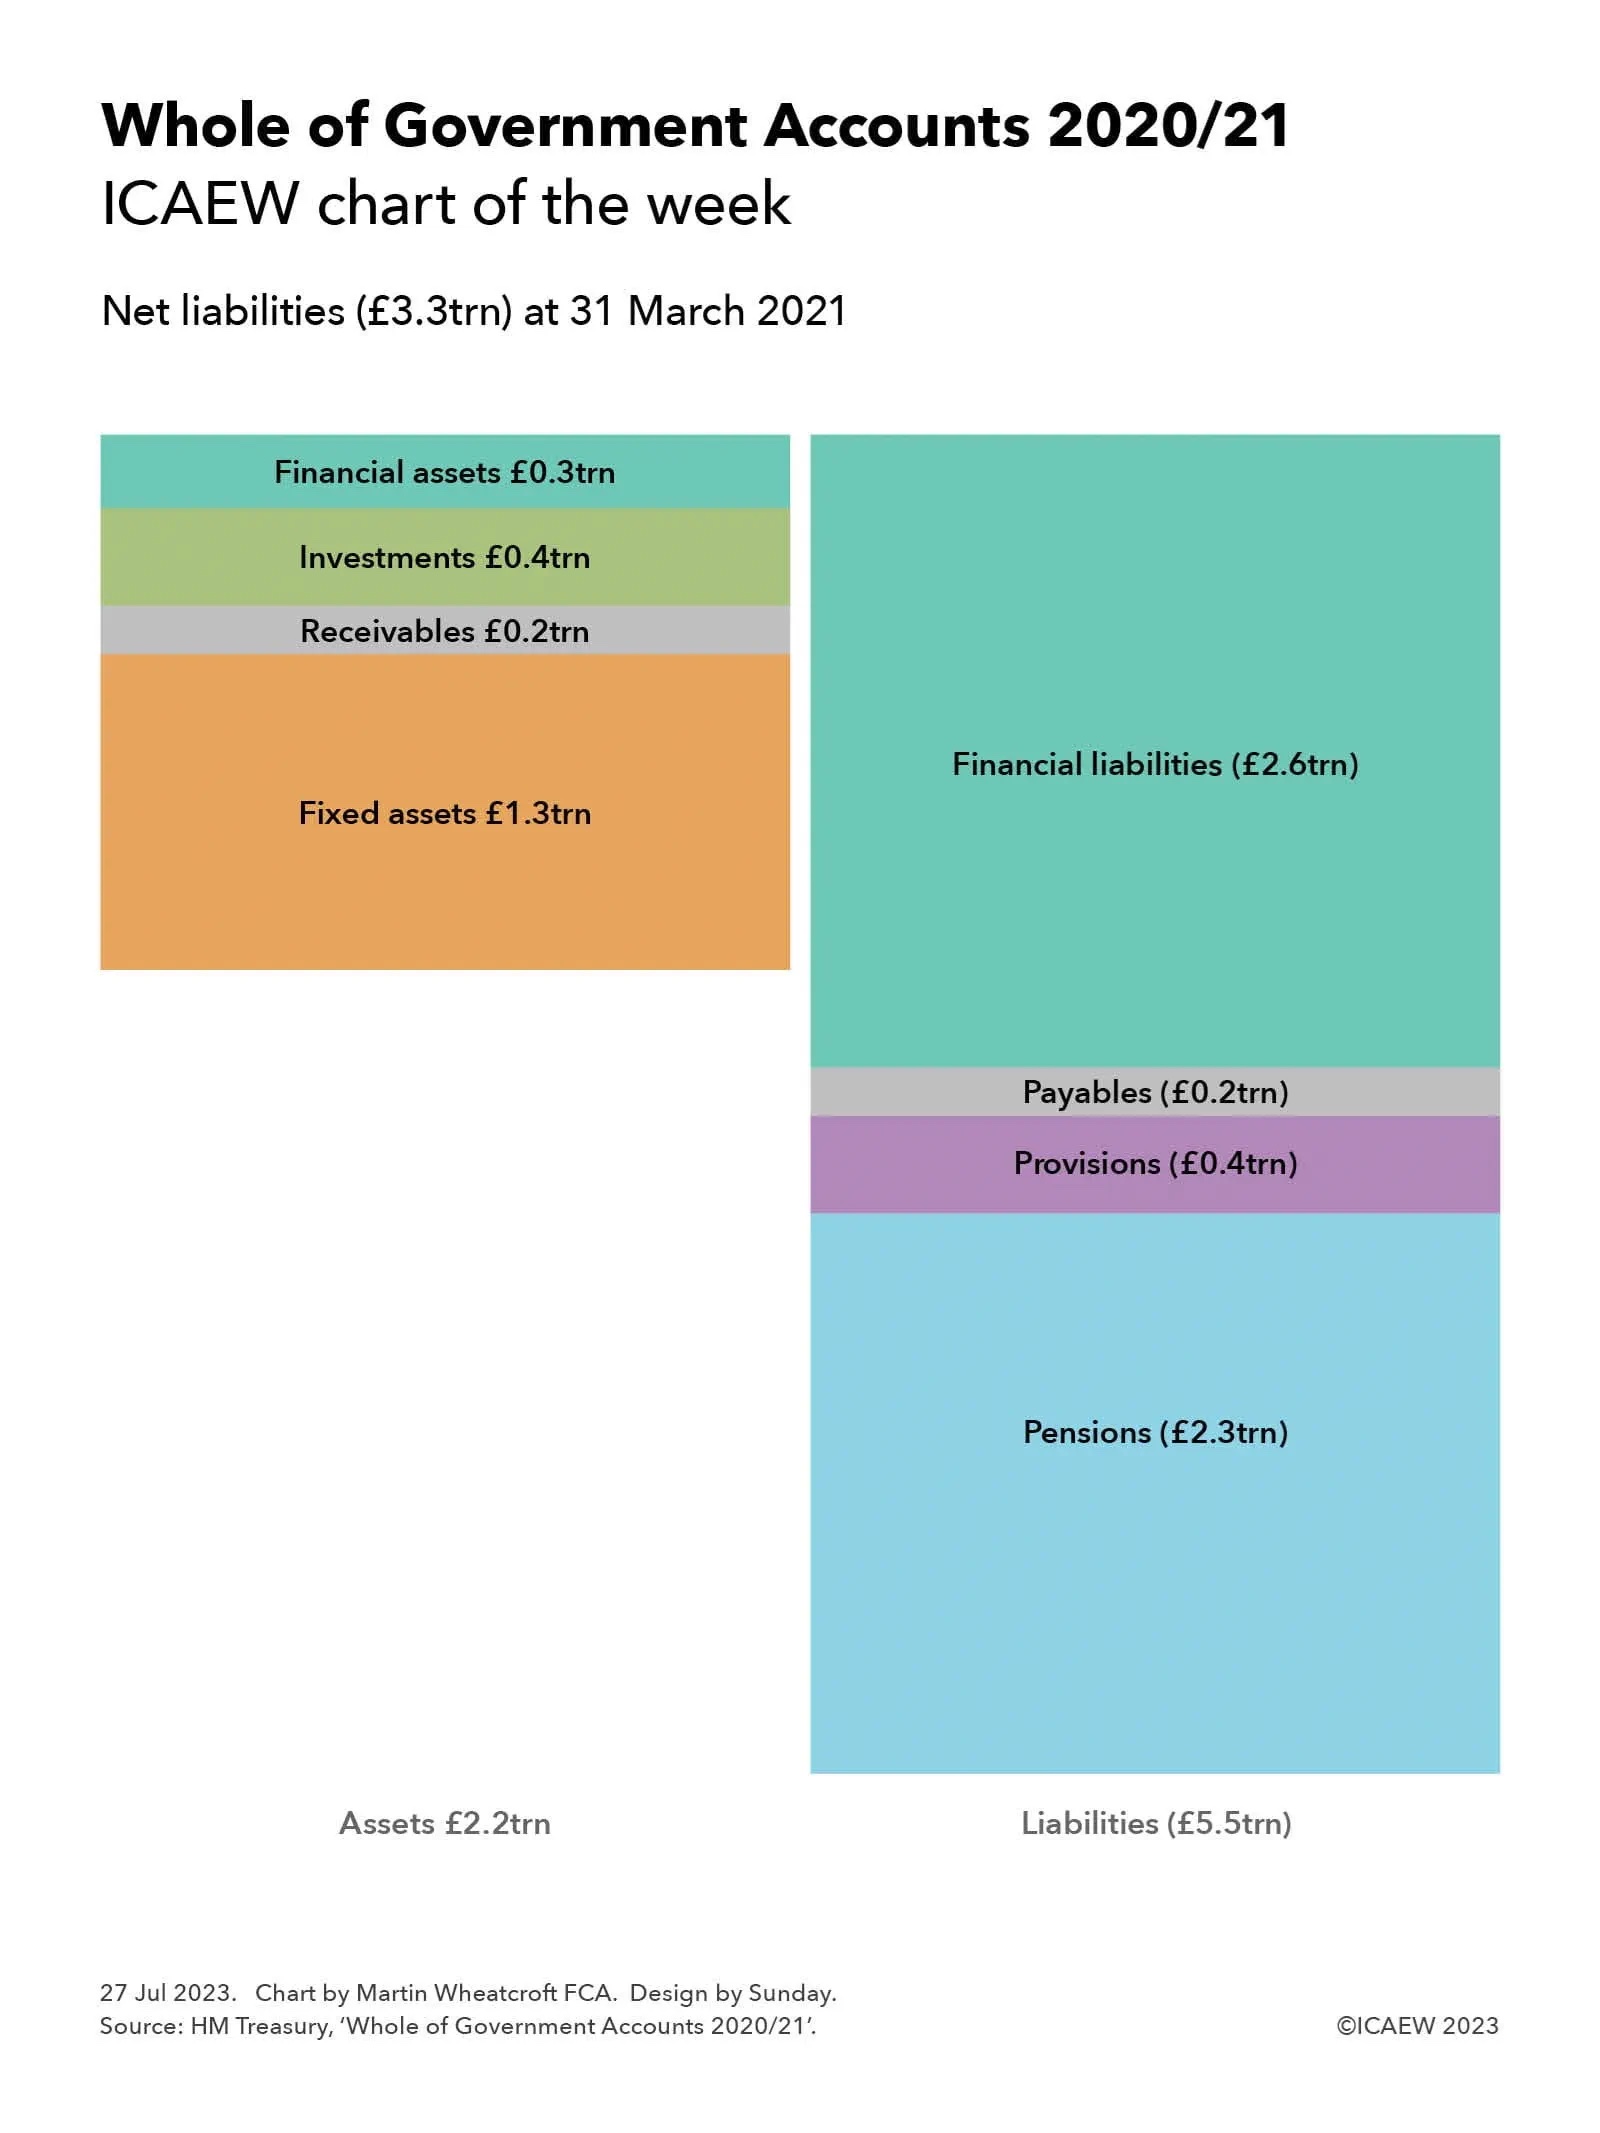
![Exploding debt
Step chart showing how UK public sector net has changed between March 2008 and the projected position in March 2029.
[debt bars shaded orange, changes shaded in purple]
March 2008: £0.6trn
Financial crisis: +£0.7trn
March 2012: £1.3trn
Austerity years: +£0.5trn
March 2020: £1.8trn
Pandemic / energy crisis: +£0.9trn
March 2024: £2.7trn
[bar colours shaded by 50% to indicate the following are projected numbers]
Latest plan: +£0.4trn
March 2029: £3.1trn
30 Nov 2023.
Chart by Martin Wheatcroft FCA. Design by Sunday.
Source: OBR, 'Public finances databank - Nov 2023'.](https://martinwheatcroft.com/wp-content/uploads/2023/11/icaewchart286debt.jpg)
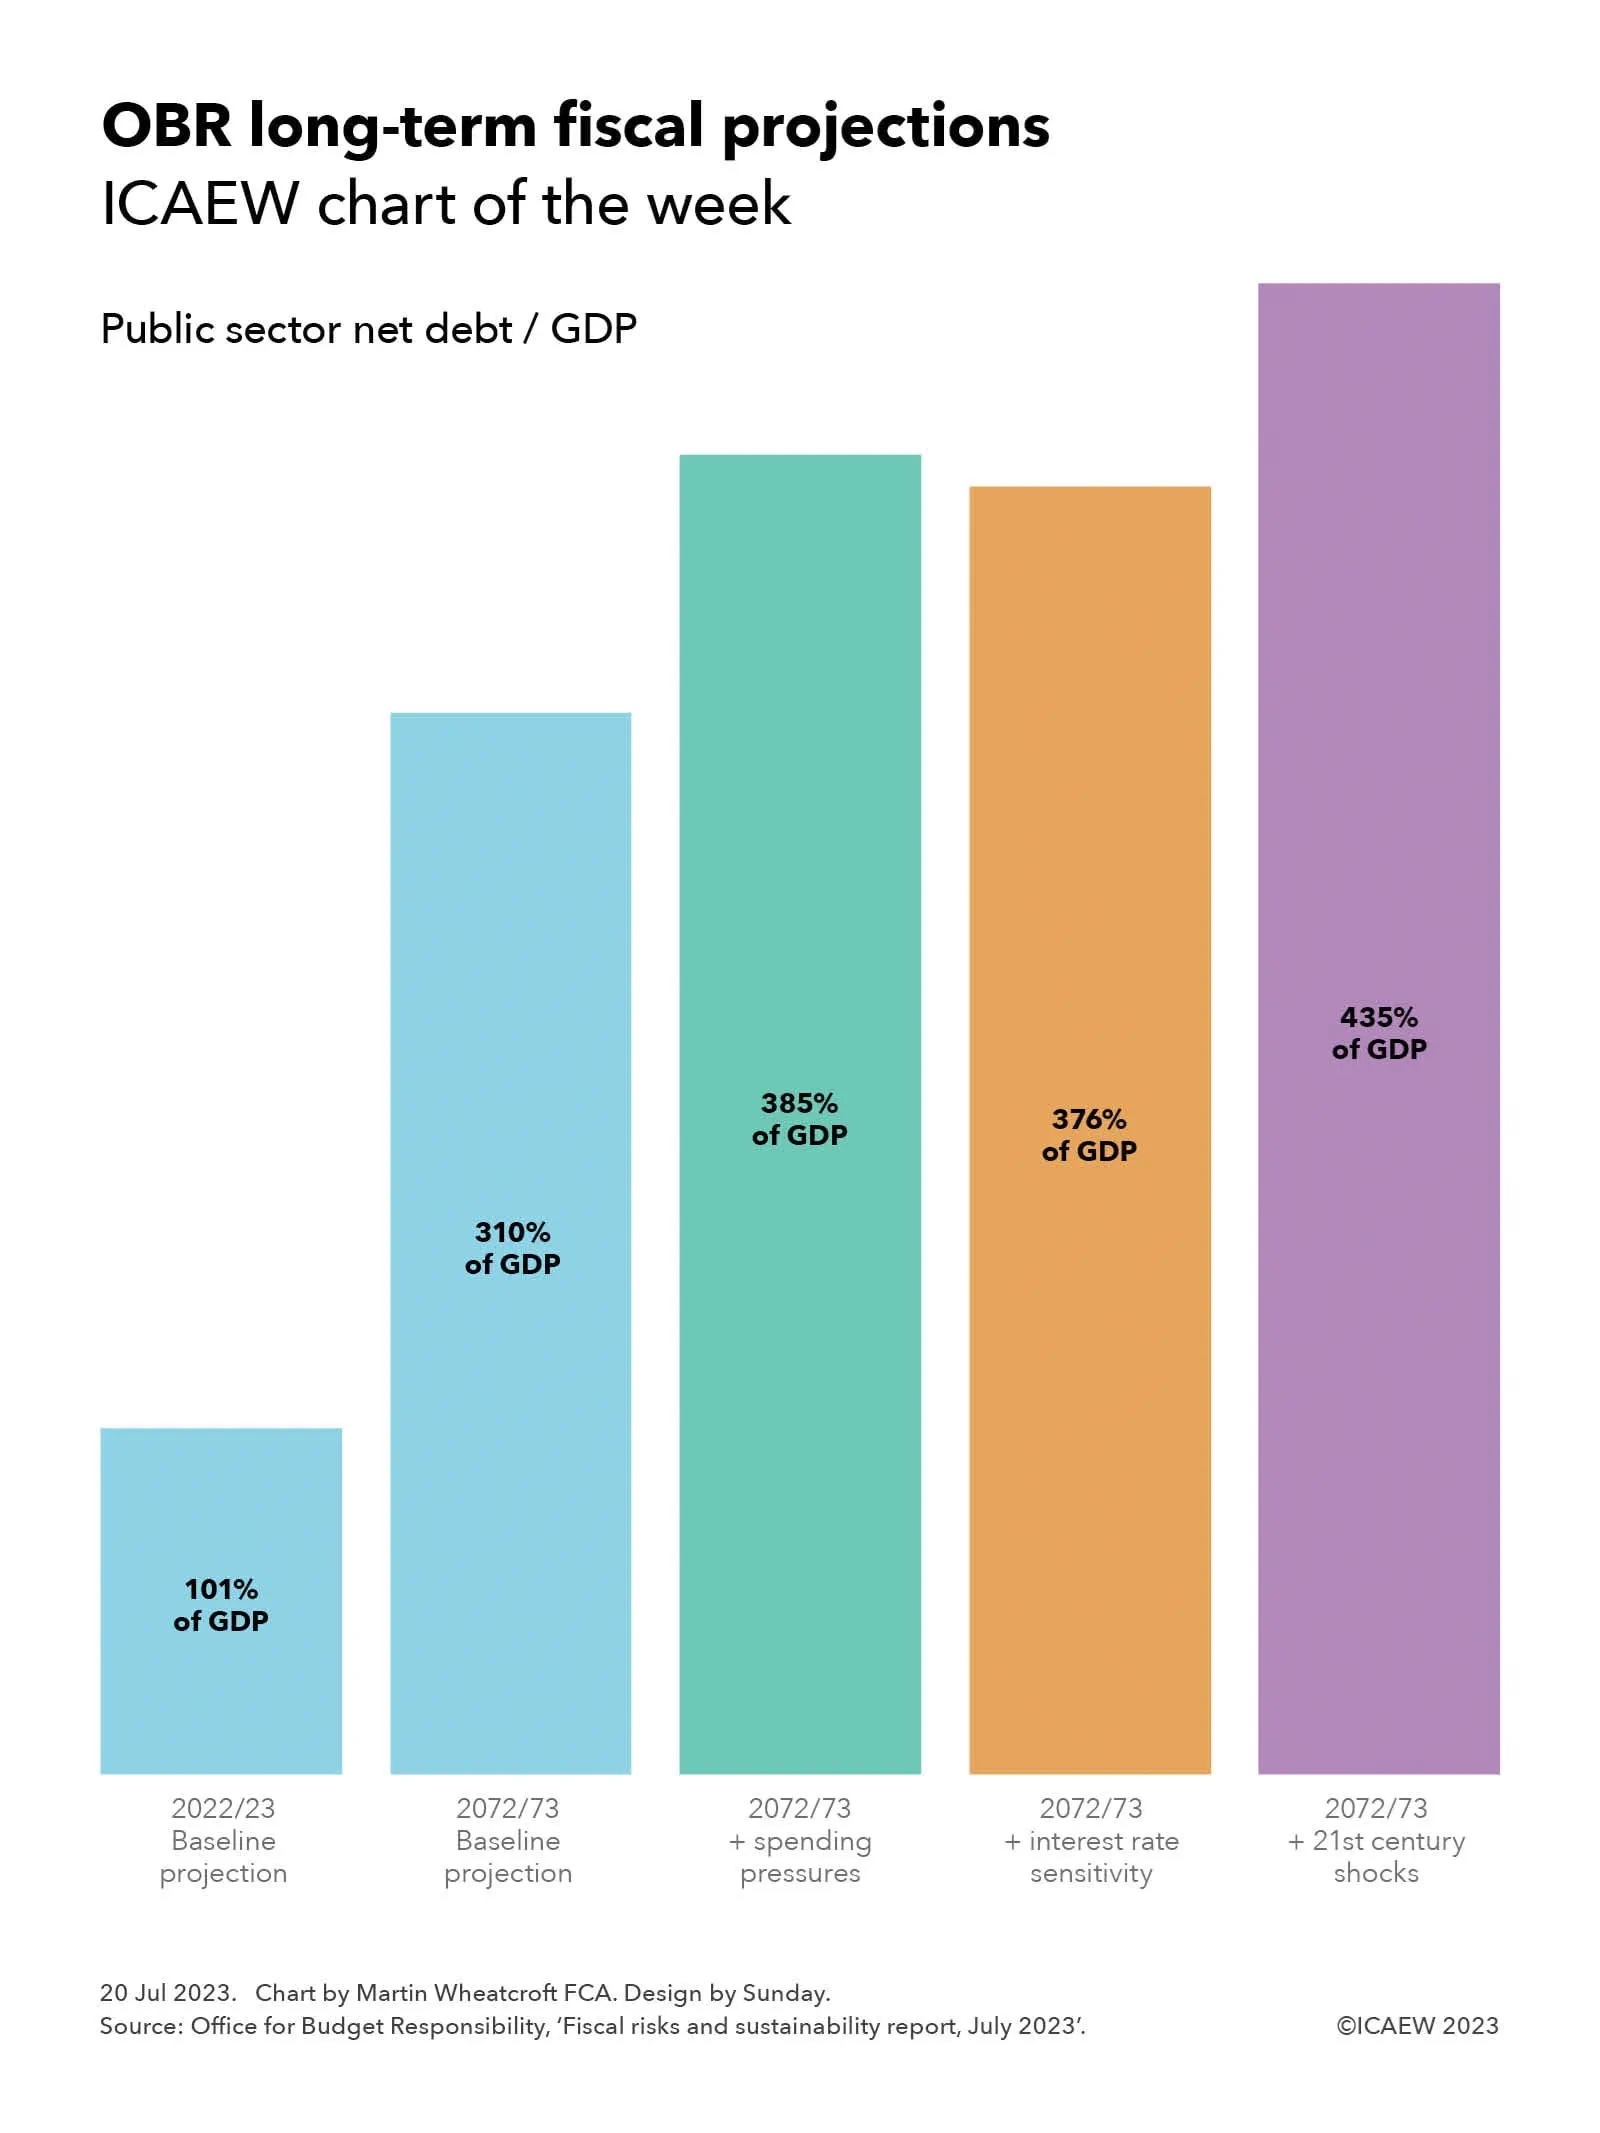
![Public sector finance trends: October 2023
Table showing receipts, expenditure, interest, net investment, deficit, other borrowing and debt movement for the seven months to October 2023 plus net debt and net debt / GDP at 31 October 2023.
Receipts: £466bn (Oct 2019), £425bn (Oct 2020), £500bn (Oct 2021), £565bn (Oct 2022), £595bn (Oct 2023)
Expenditure: (£457bn), (£582bn), (£536bn), (£548bn), (£587bn)
Interest: (£38bn), (£26bn), (£41bn), (£72bn), (£76bn)
Net investment: (£20bn), (£42bn), (£28bn), (£21bn), (£30bn)
[line above subtotal]
Deficit: (£49bn), (£225bn), (£105bn), (£76bn), (£98bn)
Other borrowing: £5bn, (£61bn), (£61bn), £5bn, (£7bn)
[line above total]
Debt movement: (£44bn), (£286bn), (£166bn), (£71bn), (£105bn)
[line below total]
Net debt: £1,821bn, £2,101bn, £2,319bn, £2,454bn, £2,644bn.
Net debt / GDP: 82.1%, 99.3%, 97.5%, 95.5%, 97.8%](https://martinwheatcroft.com/wp-content/uploads/2023/11/2023-10-Trends.jpg)