Our chart this week takes a look at the UK’s balance of payments in the year to 31 March 2025 and wonders what the future has in store.
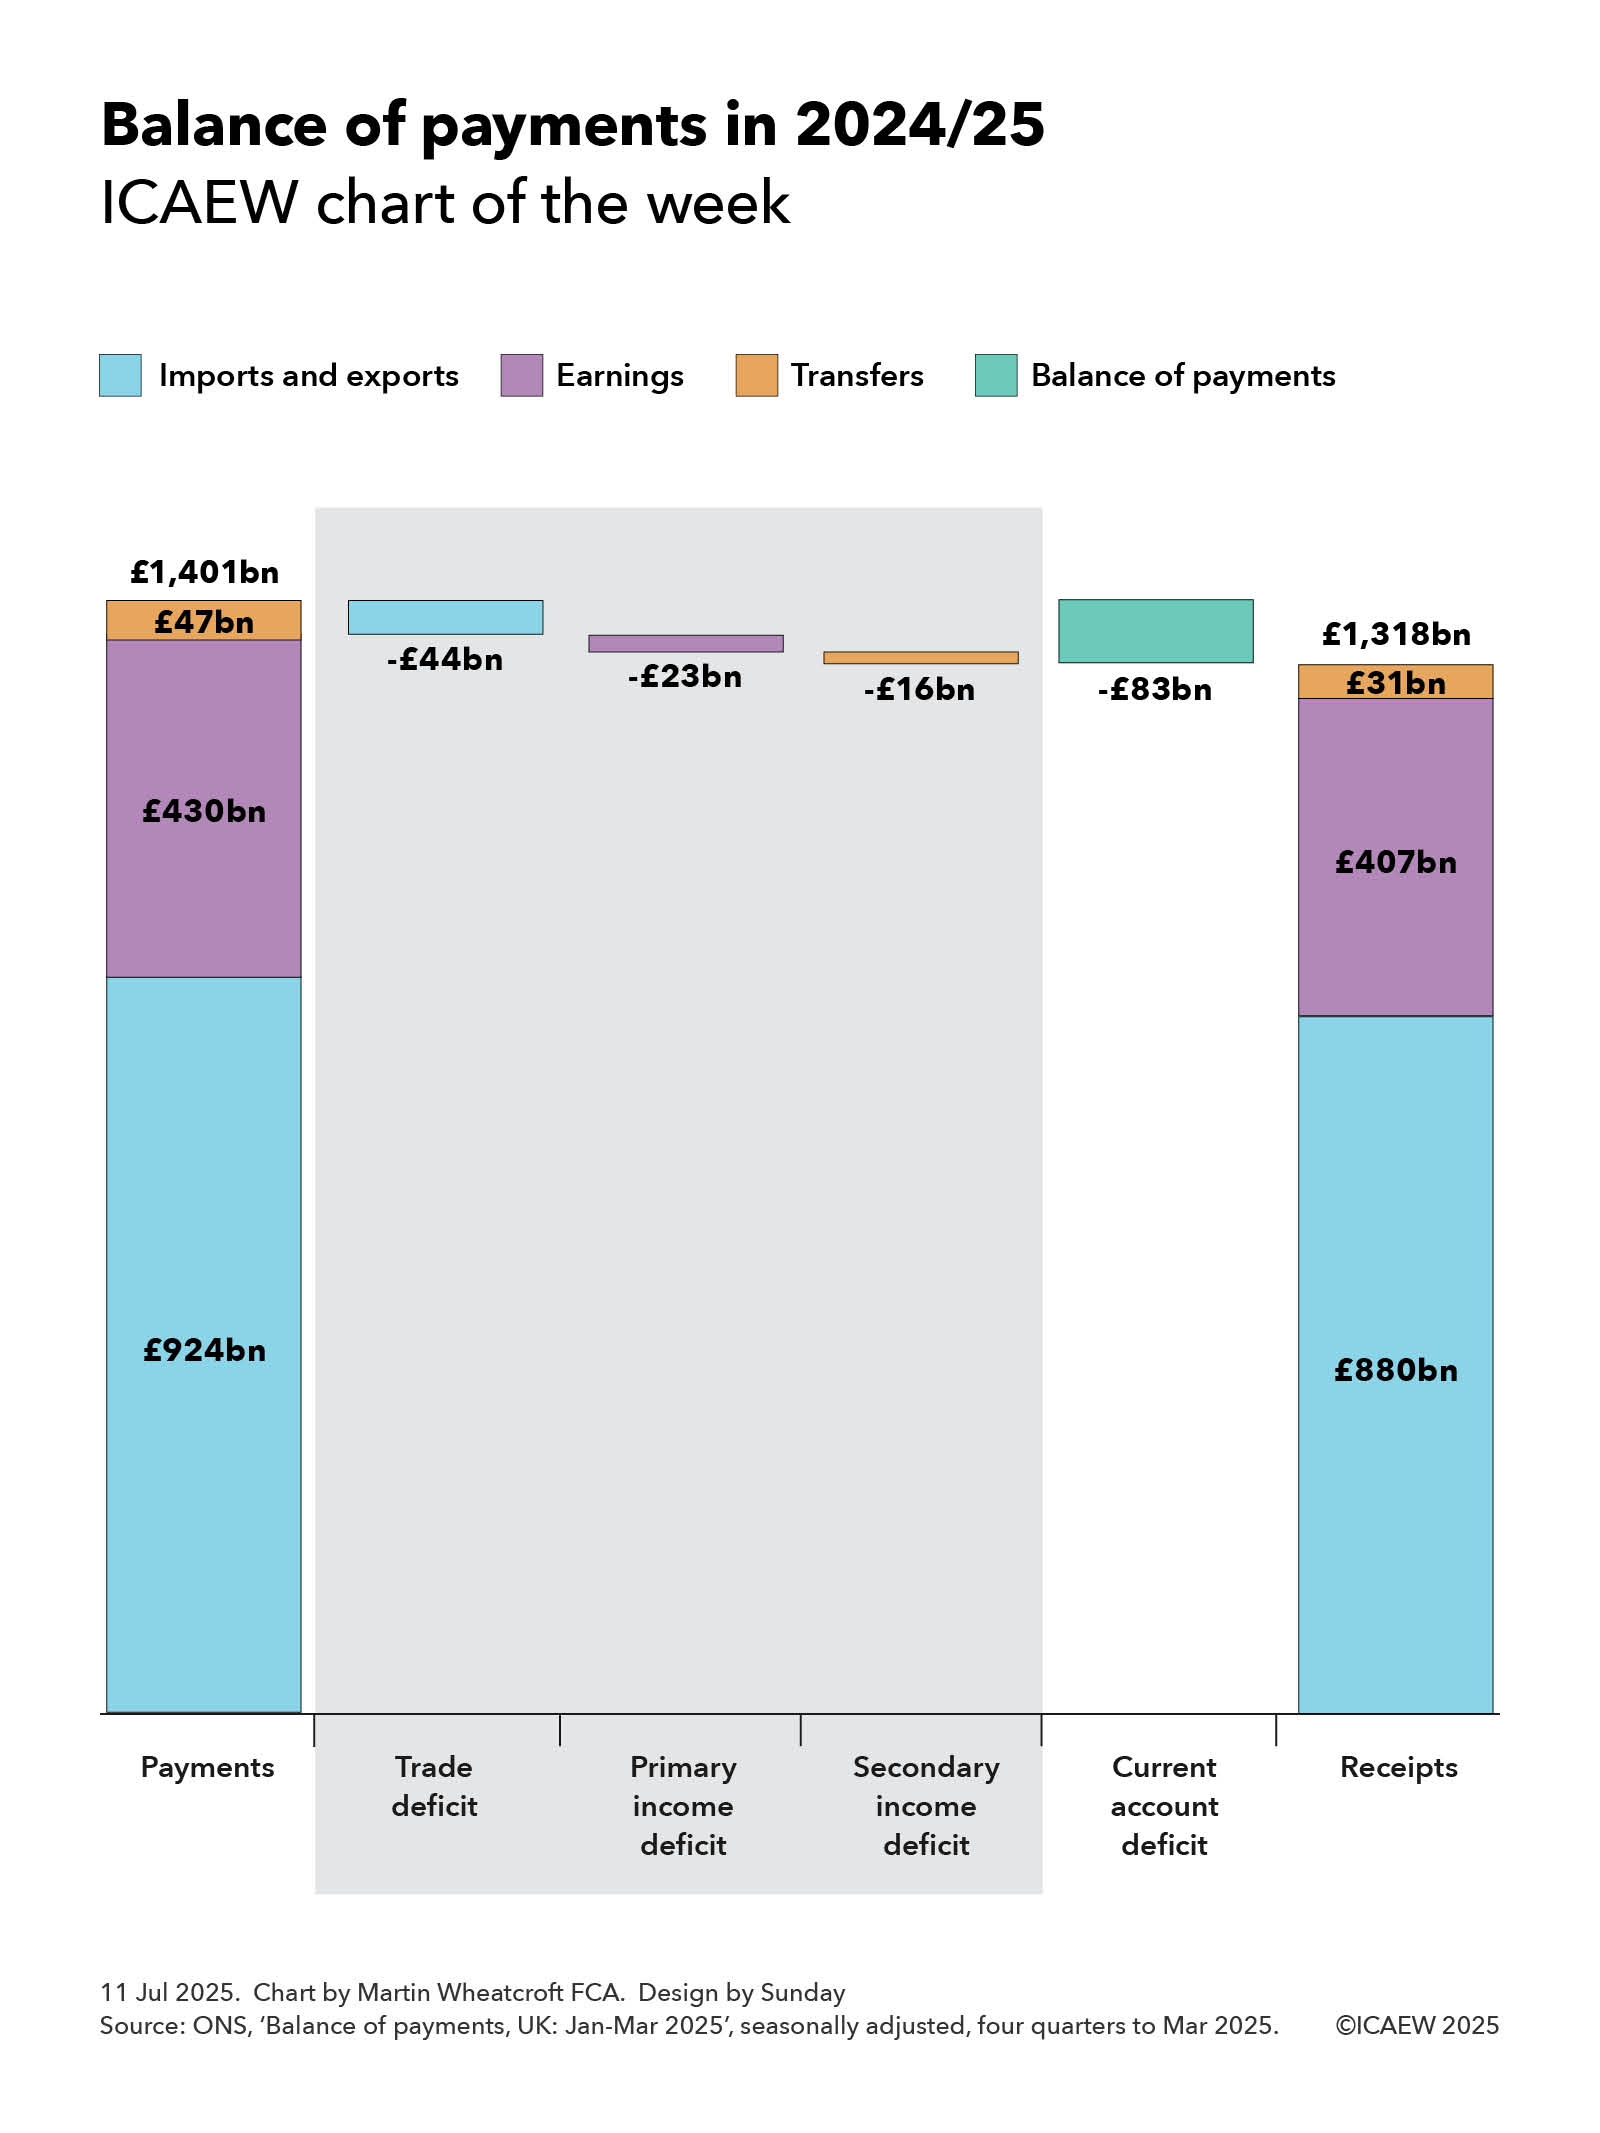
The UK is a trading nation as demonstrated by its balance of payments, the topic of our chart this week.
According to the Office for National Statistics (ONS), the UK made external payments of £1,401bn in 2024/25, comprising £924bn in exchange for imported goods and services, £430bn in investment and other earnings paid to foreign investors and workers, and £47bn in remittances, international development aid and other transfers.
On the other side of the ledger, the UK received £1,318bn from external sources in 2024/25 comprising £880bn in exchange for exported goods and services, £407bn from foreign investment and other earnings, and £31bn in remittances and other transfers.
As our chart illustrates, this resulted in a current account deficit of £83bn in 2024/25, comprising a trade deficit of £44bn, a primary income deficit on earnings of £23bn, and a secondary income deficit on transfers of £16bn.
The trade deficit of £44bn can be analysed between a deficit on goods of £239bn (being payments for goods imports of £602bn net of receipts from goods exports of £363bn) and a surplus on services of £195bn (with payments for services imports of £322bn being exceeded by receipts from services exports of £517bn).
The primary income deficit of £23bn principally relates to the £22bn difference between £427bn in investment income and profits generated in the UK paid to foreign owners in 2024/25 and the £407bn received by UK investors from their investments overseas, plus £1bn from the net of £3bn paid in compensation to foreign workers less £2bn earnt by UK workers from foreign sources.
The secondary income deficit of £16bn comprises a net £10bn in government-related transfers, being £11bn in payments made by the UK government (primarily for international development and humanitarian aid) less £1bn received from the EU and others, and a net £6bn from the differences between remittances and other transfers sent abroad of £36bn less remittances and other transfers received into the UK of £30bn.
The chart does not show the other side of the balance of payments, which is a £77bn non-seasonally adjusted surplus on the investment account less a £4bn deficit on the seasonally adjusted capital account, a net cash inflow of approximately £73bn.
The £77bn surplus on the investment account reflected net investment into the UK of £370bn over the course of the four quarters to March 2025, less £293bn net investment abroad. The £4bn deficit on the capital account primarily relates to international development capital grants, with £1bn from the disposal of non-financial assets to foreign owners offset by £1bn in UK purchases of foreign non-financial assets.
While some of the difference of £10bn between the current account deficit of £83bn and the net surplus on the investment and capital accounts of £73bn is because of timing differences from seasonal adjustments, most of it arises because the ONS is not able to gather data on all international payments and receipts. In theory the balance of payments should balance exactly.
The current account deficit of £83bn in 2024/25 was equivalent to 2.9% of the UK’s GDP of £2,891bn for the same period, being the net of total payments and total receipts of 48.5% and 46.6% of GDP respectively.
Being the difference between two very big numbers, the current account deficit is the net effect of billions of transactions every year as goods and services are bought and sold internationally, earnings are paid and received, and money is transferred at exchange rates that change on a minute-by-minute basis. Despite this the current account deficit in 2024/25 was only 0.1 percentage points higher than the average 2.8% of GDP since 1997, even if it has gone as high as 6.9% in an individual quarter.
While the global trade war was initiated by the US is likely to have a major impact on how money flows around the world, it is much harder to guess how significant that effect will be, either on the overall global economy or on any individual country, in particular the UK.
Either way, the balance of payments is likely to become a more prominent statistic in the coming months and years.