ICAEW chart of the week: Quarterly GDP

2 October 2020: The latest statistics for the UK economy generate a grim graphic for the #icaewchartoftheweek.

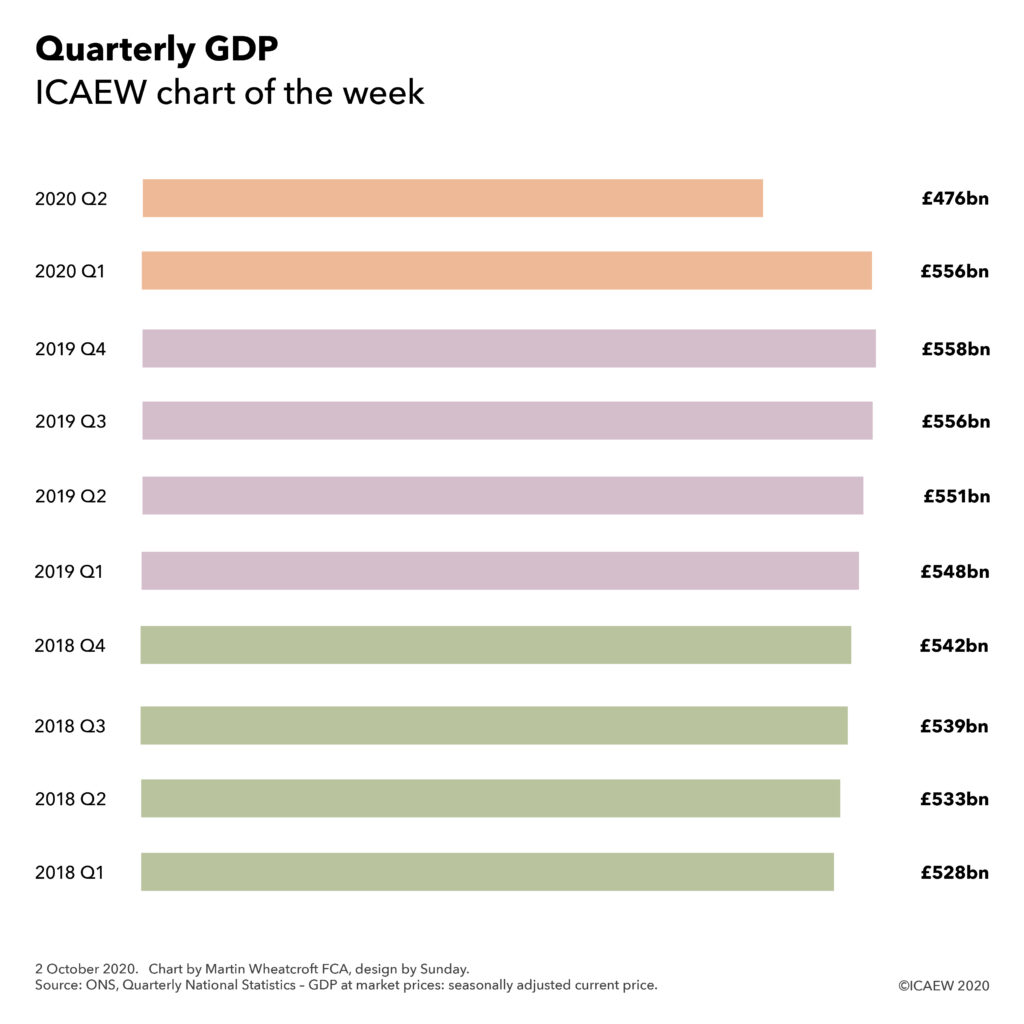
Chart showing GDP by quarter from 2018 Q1 to 2020 Q2: £528bn, £533bn, £539bn, £542bn, £548bn, £551bn, £556bn, £558bn, £556bn, £476bn.

According to latest numbers from the Office for National Statistics (ONS) released on 30 September 2020, GDP for the second quarter to June 2020 fell to £476bn, a 14.5% fall in economic activity compared with the previous quarter, which in turn was 0.5% lower than the last quarter of 2019.

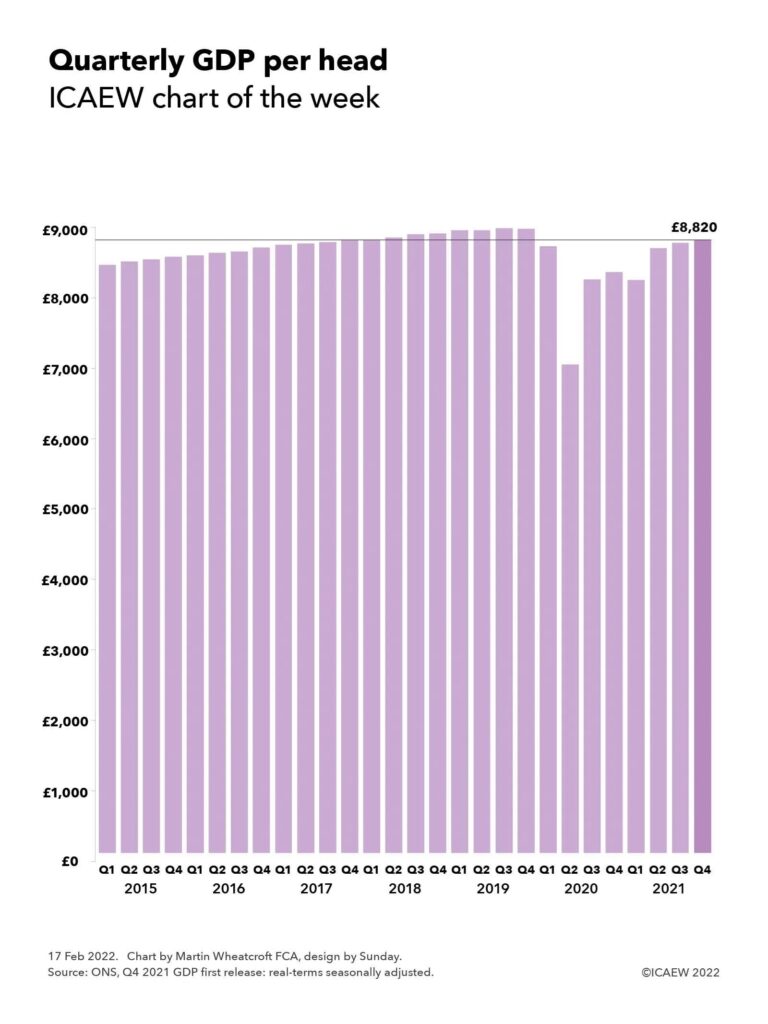
This week’s chart not only illustrates the damage done by the coronavirus pandemic to the economy in the first half of 2020, but also highlights how poorly the economy was performing in past couple of years, with seasonally-adjusted GDP increasing by an average of 0.8% a quarter from £528bn in the first quarter of 2018 to £558bn in the fourth quarter of 2019.

These percentage changes do not take account of the effect of inflation, with the ONS reporting a headline fall of 19.8% in real GDP in the second quarter and a 2.5% drop in the first quarter on a chained volume basis (the method used by the statisticians at the ONS to adjust for the effects of changing prices and output levels across the economy). Average quarterly real economic growth in the seven quarters to Q4 2019 was just 0.3% and around half that on a per capita basis.

The two pieces of good news are that the decline in GDP in the second quarter was less steep than originally feared, while we also know that the economy has recovered to a significant extent in the third quarter to 30 September, although we won’t know by how much until the statistics are published in November. Unfortunately, with local lockdowns across the country, the likelihood is that it will be sometime before our lives return to normal.

This chart was originally published on the ICAEW website.

ICAEW chart of the week: A square root-based recovery?

17 July 2020: Debate rages about which symbol to attribute to the shape of the economic recovery.

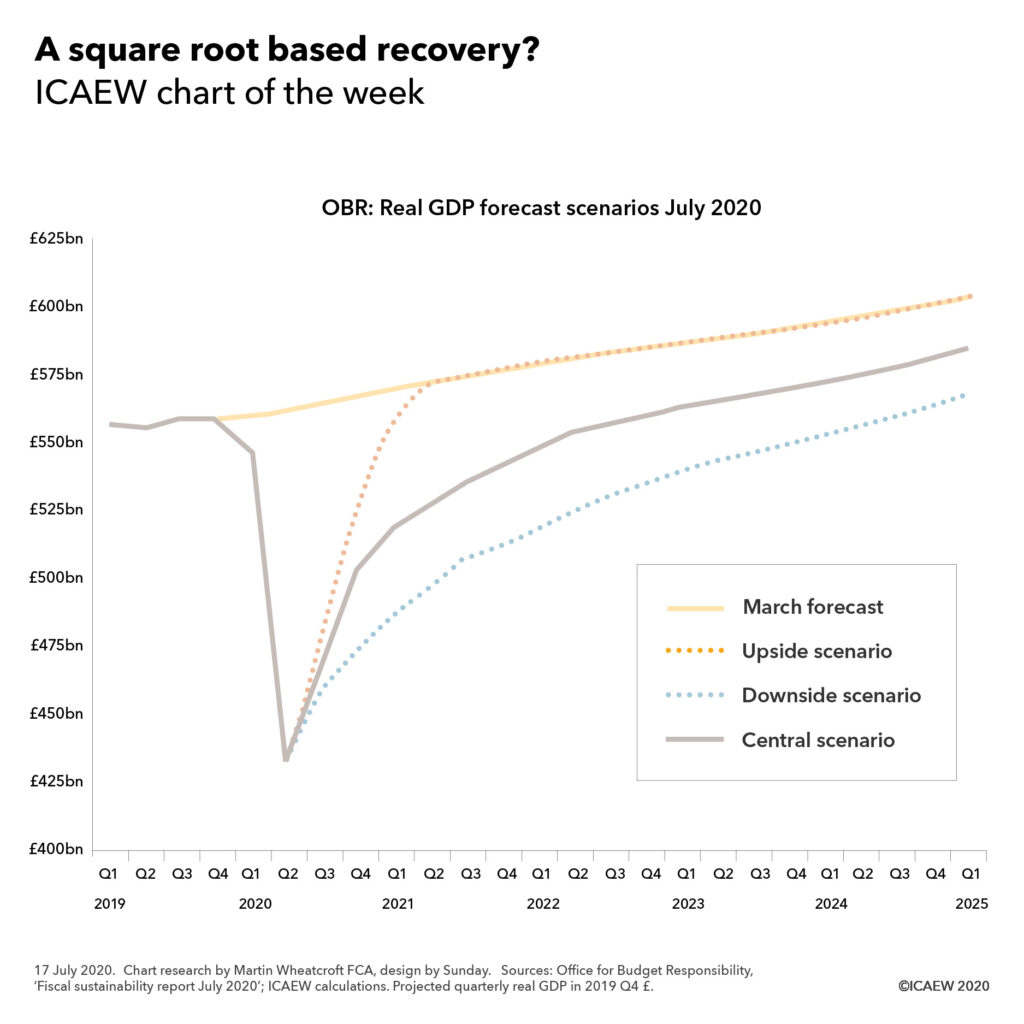
Chart on OBR Real GDP growth forecast. Shows huge economic hit in the first half of 2020 with potential recovery paths to Q1 2025. Upside scenario returns to previous trend by 2021, central scenario recovers but not fully, and downside is even worse.

The #icaewchartoftheweek is on the economy this week, with the Office for Budget Responsibility indicating that hopes of a sharp V-shaped recovery have receded. Instead, their central scenario is for a square root-based recovery – with economic activity recovering less quickly than originally hoped and not to the same level predicted before the pandemic took hold in the UK.

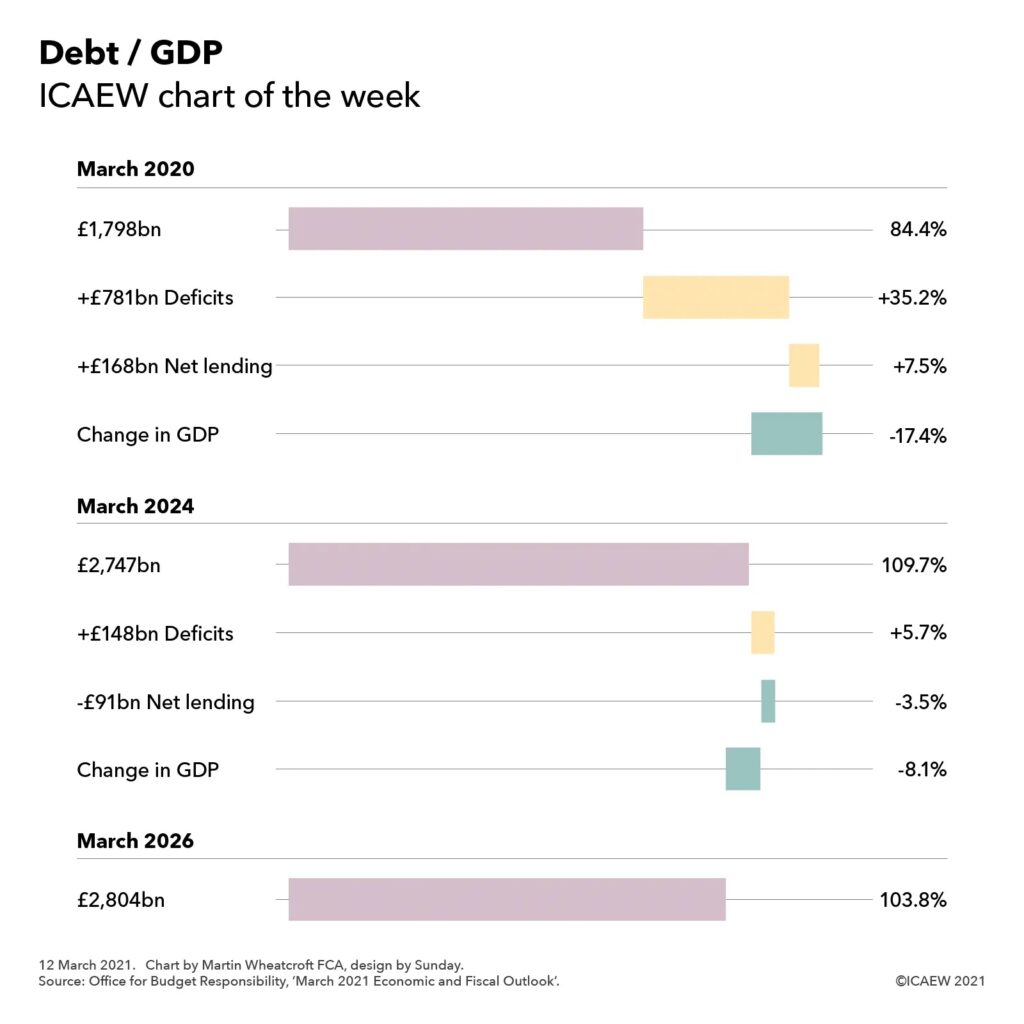
According to the OBR, quarterly GDP fell from £558bn in the fourth quarter of 2019 to £432bn before inflation in the second quarter of this year, a drop of almost 23% in the level of economic activity. Under the OBR’s central scenario GDP in real-terms is not expected to get back to where it was until the fourth quarter of 2022. At a predicted £584bn (excluding inflation) in the first quarter of 2025, GDP would be 3% lower than where it was predicted to be prior to the pandemic.

The OBR hasn’t completely ruled out a V-shaped recovery as a possibility and their upside scenario would see the economy returning to the previous trend by the second quarter of 2021. However, with job losses starting to accelerate, such a speedy return to trend seems increasingly unlikely.

The good news is that the OBR’s downside scenario, for which no symbol has yet been assigned, is not as shallow as the dreaded U-shaped recovery that some economists are worried about. In the downside scenario, economic activity recovers by the middle of 2024, unlike a U-shaped recovery that might extend into the second half of the 2020s.

In practice, the fortunes of different sectors of the economy are likely to vary, with some suggesting the recovery is more likely to be K-shaped, with some sectors stalling just as others emerge to grow back strongly following the end of the lockdown. The Government will be hoping that the fiscal interventions it has announced to support the hospitality, leisure and housing sectors in particular will help prevent the ‘full K’.

This chart of was originally published by ICAEW.

ICAEW chart of the week: Economic lockdown

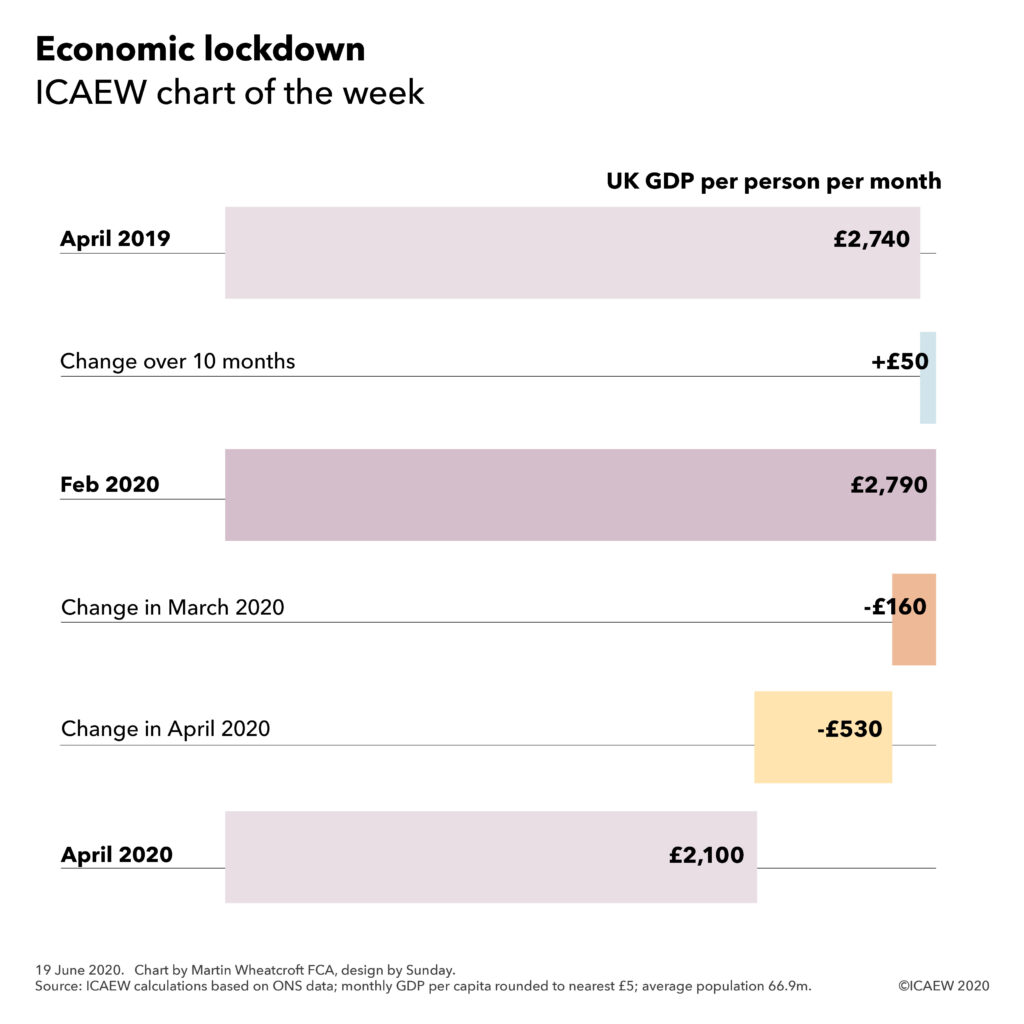
19 June 2020: Economic contraction sees monthly GDP per capita decline from £2,790 in February 2020 to £2,100 in April 2020.

UK GDP per person per month - April 2019: £2,740 +£50 = Feb 2020: £2,790 - Mar £160 - Apr £530 = April 2020: £2,100.

The #icaewchartoftheweek is on the economy this week, illustrating how average GDP per person per month increased from £2,740 in April 2019 to £2,790 in February 2020, before contracting sharply in March and April.

The increase of £50 per person in economic activity between April 2019 and February 2020 was predominately driven by inflation, with per capita economic growth of less than 0.4% over the 10 month period. This reflects just how weak the UK economy was immediately before the pandemic.

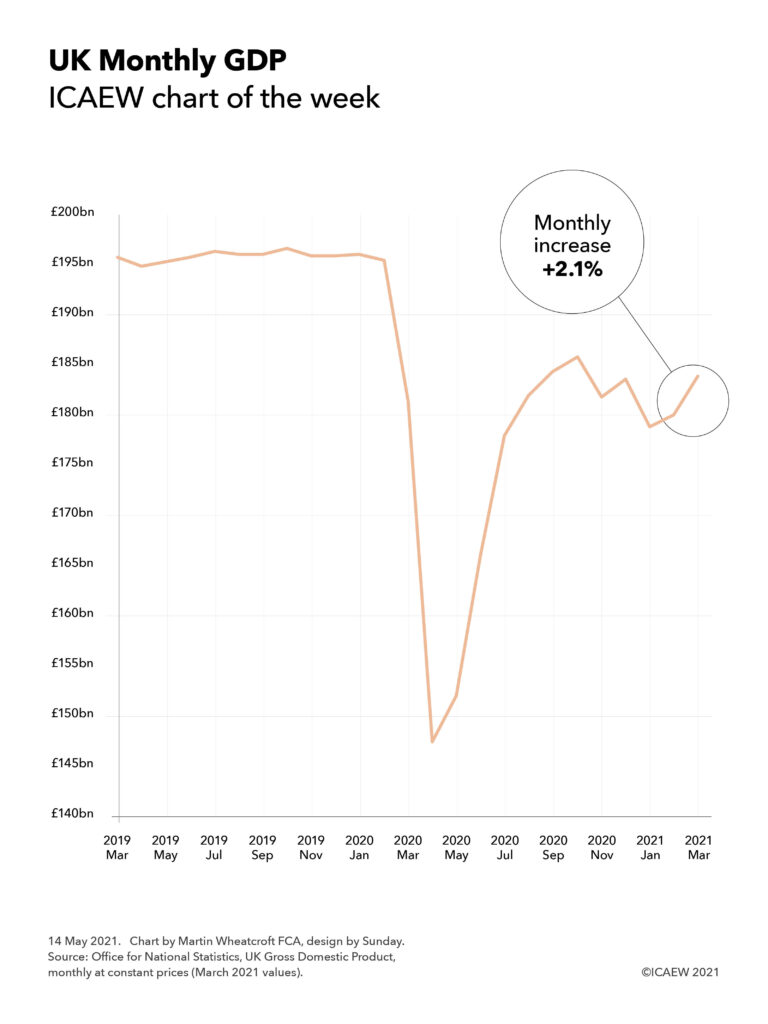
The modest increase up to February 2020 is dwarfed by the dramatic changes seen as a consequence of the pandemic, with severe curtailments in many parts of the economy leading to a 5.8% fall in economic activity in March and a further 20.4% in April according to provisional numbers from the Office for National Statistics.

Monthly GDP was estimated to be £183bn in April 2019, £187bn in February 2020 and £141bn in April 2020. The population was projected to be just over 66.7m in April 2019, rising to 67.0m by February 2020, before increasing very slightly in March prior to the lockdown and then falling a little in April.

The dramatic transformation in the UK economy wrought by the lockdown is now extremely visible in the statistics, but it will take some time for the post-lockdown economic position to emerge in order to be able to see how much permanent damage has been done.

This article was originally published by ICAEW.