ICAEW chart of the week: Energy price cap

My chart for ICAEW this week looks at the domestic energy price cap since its peak in the first quarter of 2023.
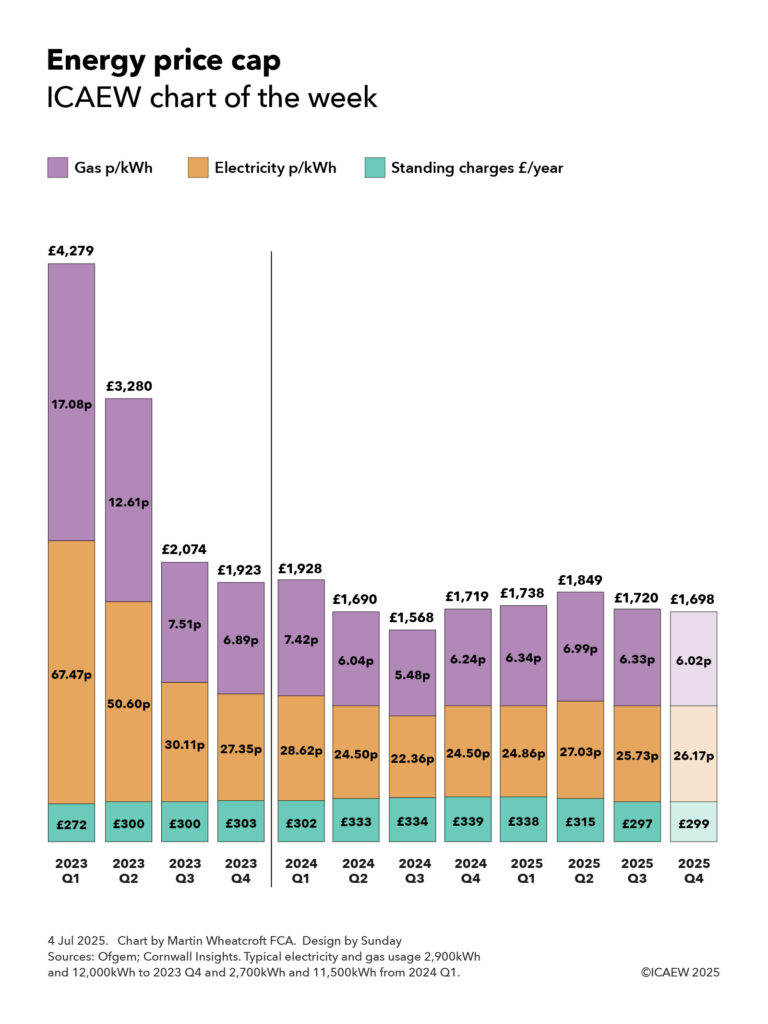
Column chart on the energy price cap by quarter since 2023. There is a vertical line between 2023 Q4 and 2024 Q1 to show the point when typical energy usage changed. 

Price cap 2023 Q1 £4,279, Q2 £3,280, Q3 £2,074 and Q4 £1,923; 2024 Q1 £1,928, Q2 £1,690, Q3 £1,568 and Q4 £1,179; 2025 Q1 £1,738, Q2 £1,849, Q3 £1,720 and Q4 £1,698 (pale colours as a forecast). 

Bars show annual standing charges and per kWh electricity and gas prices for each quarter as set out in the accompanying article. 

4 Jul 2025. Chart by Martin Wheatcroft FCA. Design by Sunday. Sources: Ofgem, Cornwall Insight. Typical electricity and gas usage 2,900kWh and 12,000KWh to 2023 Q4 and 2,700kWh and 11,500kWh from 2024 Q1.

According to Ofgem, the domestic energy price cap in Great Britain for the third quarter of 2025 commencing on 1 July is £1,720 per year. This is a 7% reduction from the £1,849 per year price cap in the previous quarter, based on typical energy usage of 2,700kWh of electricity per year and 11,500kWh of gas per year.

The above statement may be confusing because the amounts quoted are not what is capped and the price cap only lasts for a quarter rather than a year. 

There is, however, a method to Ofgem’s madness. There are actually 252 price caps set by Ofgem each quarter that it distils into one headline number, being the average of fourteen regional prices for a dual-fuel standard credit user multiplied by typical annual usage plus the 5% VAT that is payable on domestic energy supplies. 

This single annualised number makes it much easier to communicate what is happening to energy prices and also avoids getting into the complications of seasonal variations in energy usage during the course of each year.

The 252 price caps comprise two caps – a maximum per kWh price and a maximum daily standard charge – for each of three different types of users (single-rate users of electricity, multi-rate ‘Economy 7’ users of electricity and users of gas), multiplied by three different categories of customers (standard credit, direct debit and prepayment meters), and then multiplied by 14 regional variations

The headline price cap is not the maximum that households will pay in a year, nor should you divide by four to guess at the amount payable for that individual quarter. Those paying by direct debit or using prepayment meters (since July 2023, previously prepayment customers paid more) are capped at 7% and 10% on average less than standard credit users based on typical usage, while maximum prices and standing charges also vary by region. Larger homes are likely to use much more energy and so pay a lot more, while smaller homes are likely to pay less. 

Meanwhile, energy suppliers have started to offer annual or longer fixed-rate deals again, typically at a discount to the current maximum prices but with the price protection that such deals offer offset by the risk that the fixed-rate in the deal could exceed the price cap in subsequent quarters if prices go down.

As my chart this week illustrates, the annual price cap peaked at £4,279 in the first quarter of 2023, based on average maximum standing charges of £272 per year for both electricity and gas meters, plus 2,900kWh of electricity at 67.47p and 12,000kWh of gas at 17.08p. The price cap fell to £3,280 in the second quarter (£300 standing charges, 50.60p/kWh for electricity and 12.61p/kWh for gas), £2,074 in the third quarter (£300, 30.11p/kWh and 7.51p/kWh) and £1,923 in the fourth quarter of 2023 (£303, 27.35p/kWh and 6.89p/kWh).

Ofgem changed its estimate of typical annual usage to 2,700kWh in electricity and 11,500kWh in gas from the first quarter of 2024, so the £1,928 headline price cap was actually a 3% increase compared with the previous quarter once the change is adjusted for. The price cap fell to £1,690 in the second quarter (£333 standing charges, 24.50p/kWh for electricity and 6.04p/kWh for gas) and £1,568 in the third quarter (£334, 22.36p/kWh and 5.48p/kWh) before rising to £1,179 in the fourth quarter of 2024 (£339, 24.50p/kWh and 6.24p/kWh).

Prices rose in the first quarter of 2025 to £1,738 (£338 standing charges, 24.86p/kWh for electricity and 6.34p/kWh for gas) and £1,849 in the second quarter (£315, 27.03p and 6.99p) before falling to £1,720 in the current quarter that commenced on 1 July and ends on 30 September 2025 (£297, 25.73p/kWh and 6.33p/kWh).

Cornwall Insight projects that the price cap could fall slightly to £1,698 in the fourth quarter (£299 standing charges, 26.17p/kWh and 6.02p/kWh) based on data up to 29 June 2025. However, this could easily change depending on what happens to wholesale prices over the next month and a half before Ofgem sets the next quarterly price cap on 27 August 2025.

Despite the significant fall in energy prices from their peak in the first quarter of 2023, the cap continues to be much higher than it was before the pandemic and the cost-of living crisis. After adjusting for consumer price inflation and changes in estimated typical usage, the £1,720 per year price cap in the current quarter is approximately 26% higher than the original price cap of £1,137 in the first quarter of 2019 (not shown in the chart, based on £177 a year in standing charges, 16.52p/kWh x 3,100kWh typical annual usage of electricity and 3.73p/kWh x 12,000kWh of gas).

While it is positive that energy prices appear to have stabilised at around the current level over the past couple of years, there continue to be significant geopolitical risks that mean that prices could rise significantly in some specific scenarios.

Time to keep our fingers crossed and hope those risks don’t materialise
This chart was originally published by ICAEW.

ICAEW chart of the week: Inflation (again)

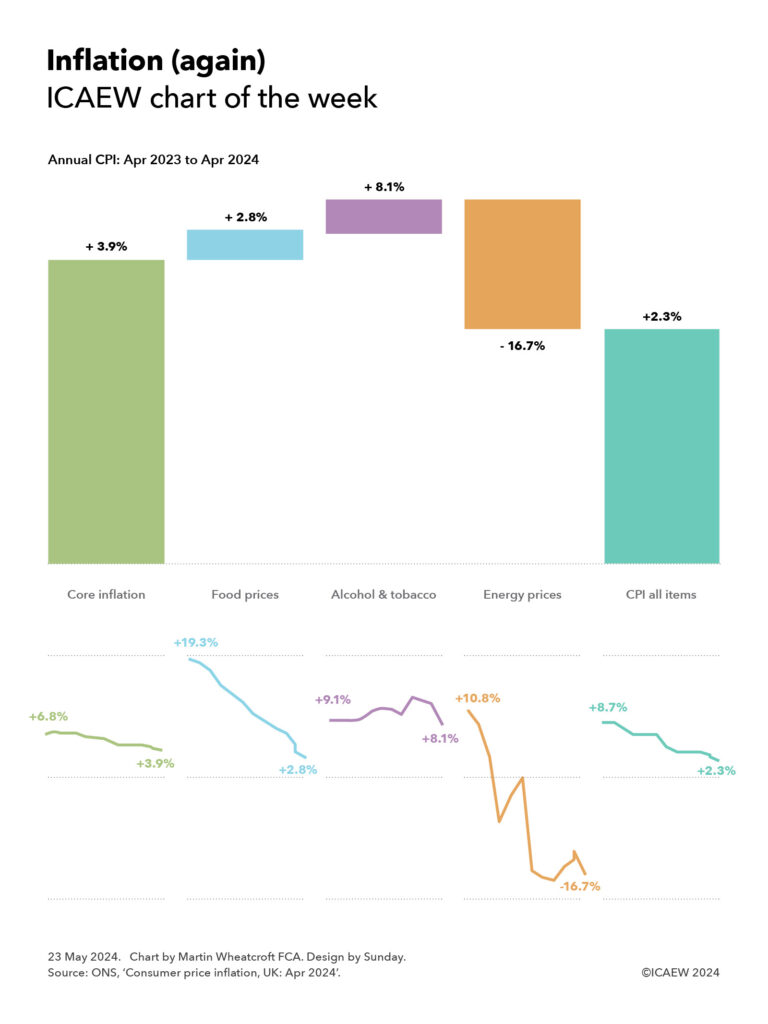
My chart for ICAEW this week shows that while headline inflation slowed to 2.3% in April, a core inflation figure of 3.9% means the fight against inflation is far from over.

Inflation (again)
ICAEW chart of the week

Step chart combined with five individual line graphs under each step.

Annual CPI: Apr 2023 to Apr 2024

Core inflation +3.9% (height = 3.0%) 
Food prices +2.8% (height = 0.3%)
Alcohol & tobacco +8.1% (height = 0.3%)
Energy -16.7% (height = -1.3%)
=CPI all items +2.3% (height 2.3%)

Core inflation line graph: gradual slope downwards from +6.8% to +3.9%.

Food prices line graph: steep slope downwards from +19.3% to +2.8%.

Alcohol & tobacco line graph: flattish line from +9.1% which then rises, falls and rises before falling to +8.1%.

Energy prices line graph: sharply falling line with a couple of zig zags upwards and then a final fall - from +10.8% to -16.7%.

CPI all times - a gradual fall (with bumps) from +8.7% tp +2.3%.23 May 2024.


Chart by Martin Wheatcroft FCA. Design by Sunday.

Source: ONS, 'Consumer price inflation, UK: Apr 2024'.


© 2024.

We return to the topic of consumer price inflation (CPI) this week following the news that it has returned to within its target range of 2% plus or minus 1% for the first time since July 2021. 

Our chart illustrates how a 16.7% fall in energy prices between April 2023 and April 2024, have partially offset core inflation of 3.9%, food price rises of 2.8% and alcohol and tobacco prices rises of 8.1%, to result in annual CPI of 2.3%.

It also shows how each of these components of inflation have changed over the last 12 months. Core inflation has slowed from an annual rate of 6.8% in April 2023 to 3.9% in April 2024, food price inflation from 19.3% to 2.8%, and alcohol and tobacco price inflation from 9.1% to 8.1%. Meanwhile, energy prices have fallen over the last year with the annual rate of change going from +10.8% in April 2023 to -16.7% in April 2024.

These components of the inflation index combine to see CPI slow from an annual rate of 8.7% in April 2023 to 2.3% for the 12 months to April 2024, positive news for the Bank of England. It has spent the last few years writing letters to the Chancellor, explaining why inflation is off target and the actions the Bank is taking to bring inflation back on target.

The challenge for the Bank of England’s Monetary Policy Committee is when to take the foot off the brake and start cutting interest rates. The indications are that this won’t be in June as some had hoped, with policymakers concerned about the persistence of services inflation (5.9% in the year to April 2024, a component of core inflation not shown in the chart) and the level of wage rises (5.7% in the year to March 2024), neither of which are consistent with inflation staying within its target range. 

This chart was originally published by ICAEW.

ICAEW chart of the week: Inflation

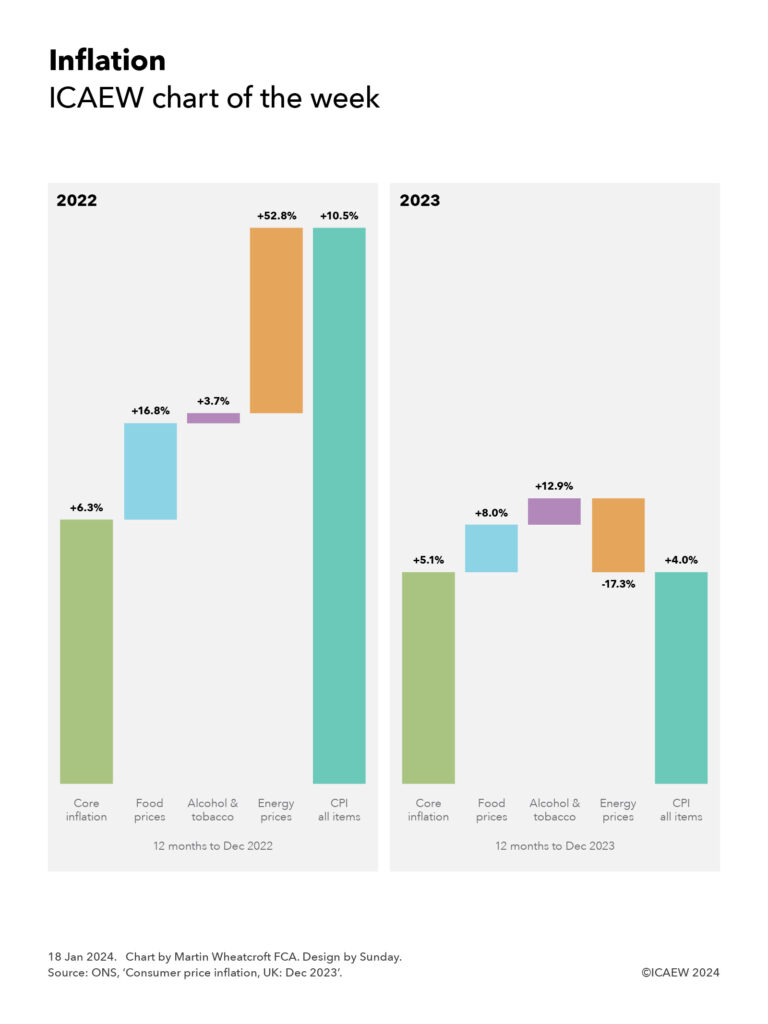
My chart for ICAEW this week illustrates how core inflation has only dropped from 6.3% in December 2022 to 5.1% in December 2023, even as the headline rate has come down from 10.5% to 4.0%.

Two step charts under the title 'Inflation'.

Step chart 1: 2022
(12 months to Dec 2022)

Core inflation +6.3% (corresponding to 5.0% in height)
+ Food prices +16.8% (height 1.8%)
+ Alcohol & tobacco +3.7% (height 0.2%)
+ Energy prices +52.8% (height 3.5%)

= CPI all items +10.5% (height 10.5%)

Step chart 2: 2023
(12 months to Dec 2023)

Core inflation +5.51% (height 4.0%)
+ Food prices +8.0% (height 0.9%)
+ Alcohol & tobacco +12.9% (height 0.5%)
+ Energy prices -17.3% (height -1.4%)

= CPI all items +4.0% (height 4.0%)


18 Jan 2024.
Chart by Martin Wheatcroft FCA. Design by Sunday.
Source: ONS, 'Consumer price inflation, UK: Dec 2023'.

(c) ICAEW 2024

On 17 January 2023, the Office for National Statistics (ONS) published its latest consumer price inflation (CPI) statistics for the 12 months to December 2023, reporting that headline inflation has fallen to an annual rate of 4.0% compared with 10.5% a year earlier – a more than halving of the annual rate of price growth.

This contrasts with CPI excluding energy, food, alcohol and tobacco (typically described as core inflation), which was 6.3% and 5.1% in the 12 months to December 2022 and 2023 respectively.

The left-hand side of my chart this week illustrates how core inflation in the 12 months to December 2022 of 6.3% contributed just under 5.0% to the weighted average total inflation rate of 10.5%, with food prices up 16.8%, alcohol and tobacco up 3.7%, and energy prices up 52.8% contributing a further 1.8%, 0.2% and 3.5% respectively.

The right-hand side shows the 12 months to December 2023, where core inflation of 5.1%, food price inflation of 8.0%, alcohol and tobacco inflation of 12.9%, and a fall in energy prices of 17.3% contributed approximately 4.0%, 0.9%, 0.5% and -1.4% respectively to the weighted average total rate of consumer price inflation of 4.0%

The relative weightings may explain why many people feel that inflation is still running faster than the headline rate. Food prices, up 8.0% in the past 12 months, have increased twice as fast as CPI of 4.0%, while alcohol (up 9.6%) and tobacco (up 16.0%) have gone up by even more. These may have been offset by energy prices coming down by 17.3% over the past 12 months, but this may not be perceived as that beneficial given how energy is still significantly more expensive than it was before the cost-of-living crisis started.

For policymakers, the bigger concern will be the stickiness in core inflation, which remains stubbornly higher than the Bank of England’s target for overall CPI of 2.0%. While the expectation is that both core and headline rates will come down further during the course of 2024, the Bank is likely to remain cautious about declaring victory in the fight against inflation despite worries about the effects of high interest rates on the struggling economy.

This chart was originally published by ICAEW.