The #icaewchartoftheweek is on inflation this week, with the Office for National Statistics reporting that consumer price inflation fell to 1.3% in December 2019 – its lowest level for over three years and towards the lower end of the Bank of England’s target range of 1% to 3%.
Accompanied by very low levels of economic growth, this has prompted speculation that the Bank of England may cut interest rates at some point this year to try and stimulate the economy. They may also be hoping that plans to boost infrastructure spending will help kick-start the economy and encourage a tad more inflation at the same time.
The Chancellor is currently consulting on plans to converge the statistically flawed Retail Prices Index with CPIH (CPI including housing) over the coming decade. This will be good news for commuters and some students, given RPI’s use in calculating fare increases and interest payments. However, it will be less good for many pensioners and holders of government debt who currently benefit from higher rates.
With recent changes in ICAEW communications, the ICAEW Public Sector team has started an #icaewchartofthemonth to complement the #icaewchartoftheweek.
The first #icaewchartofthemonth was published on the ICAEW’s Insights Hub (icaew.com/insights) on Friday 31 January 2020 and is on the UK’s international trade. It highlights how important the £718bn in imports and £673bn in exports in the year to 30 September 2019 are to the economy of the UK.
As the UK Government starts to negotiate new trade arrangements with countries around the world, the EU will be the highest priority. Imports into the UK of £369bn represent 51% of total imports and exports to the 27 EU countries of £297bn are 44% of total exports. This is followed by the USA, where imports of £87bn and exports of £133bn represent 12% and 20% respectively.
Trade relationships with countries in the Asia-Pacific region will also be very important, in particular China (imports £60bn and exports £39bn), Japan (£17bn and £15bn) and the 10-country Association of South East Asian Nations (£22bn and £19bn).
Concerned about the state of the UK economy? Then the latest retail sales numbers will not have helped, with fourth quarter sales in the UK mainland just 0.9% higher after inflation over a year earlier, as illustrated by the #icaewchartoftheweek.
With population growth still estimated to be running at around 0.6% a year, this implies that retail sales per capita in Q4 (at around £635 per month) were just 0.3% higher after inflation than the same period in 2018.
Sales in Q4 of £124.1bn comprised £41.3bn on food, drink and tobacco, £21.3bn on clothing and footwear, £19.6bn on household goods, £11.5bn on automotive fuel and £30.4bn on other non-food purchases. On a per capita basis, this is equivalent to approximately £210 per person per month on food, drink and tobacco, £110 on clothing and footwear, £100 on household goods, £60 on automotive fuel and £155 on other non-food purchases.
This low level of growth on a year earlier reflects a slow-down in retail activity in the fourth quarter of 2019, with the Office for National Statistics reporting that Q4 sales were 0.9% lower than the third quarter on a seasonally-adjusted basis.
This will feed into fourth quarter GDP, which will not be good news for the Chancellor as he puts together what is being rumoured to be a radical first Budget in March – a weak economy will reduce his room for manoeuvre to reform the tax system while boosting public spending at the same time.
2020 is likely to be an interesting year for many reasons, but in Europe all eyes will be on UK and EU negotiators as they attempt to agree a new trading relationship following the ending of the UK’s membership of the European Union at the end of this month.
As illustrated by the #icaewchartoftheweek, the UK is currently the third largest of the 32 members of the ‘European Single Market’, a trade bloc that comprises the 28 European Union member states and the four European Free Trade Association (EFTA) members.
The UK appears be aiming for a more distant trading relationship than that it currently enjoys as a EU member or that enjoyed by the 4 EFTA nations (three of which are members of the European Economic Area and the fourth – Switzerland – which has a series of bilateral agreements to give it access to the Single Market). Despite that, there are still a wide range of potential outcomes ranging from no agreement through to a much closer set of trading arrangements across multiple industries.
From a trade perspective, nothing much will change on 31 January when the UK formally ends it membership of the EU as the UK will continue to participate fully in the Single Market (as well as the EU Customs Union) until the end of the year. It will only be on 1 January 2021 that any new trade arrangements will come into force, changing the way that people and businesses operate across borders.
For now, it is very difficult to predict what exiting the Single Market will mean for the 67m people in the UK or the 462m people remaining in the Single Market. However, one prediction that can be made is that there will be plenty of opportunities for wild – and no doubt contradictory – headlines as the negotiators set to work!
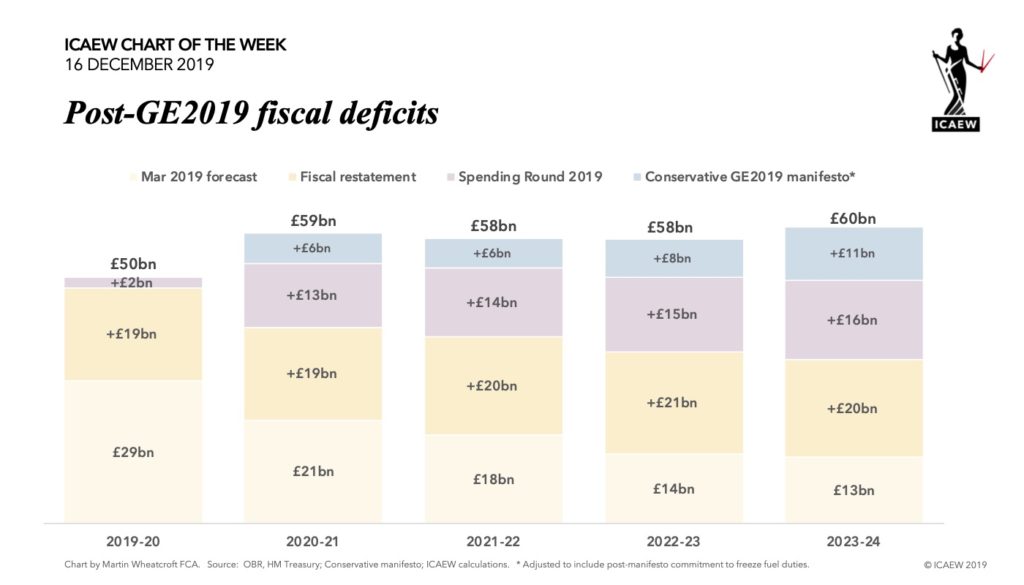
With the General Election now complete, the Office for Budget Responsibility (OBR) was able to release a restated version of its March 2019 fiscal forecasts this morning, reflecting technical revisions to the way the fiscal numbers are calculated, in particular that of student loans. This enables us to update the numbers set out our GE2019 Fiscal Insight on the party manifestos as best we can, given that the OBR has not deigned to include either the changes to public spending announced in the Spending Round 2019 nor the tax and spending changes in the Conservatives manifesto.
As illustrated by the #icaewchartoftheweek,the revised baseline forecast for the fiscal deficit is now £50bn for the current fiscal year, followed by £59bn next year in 2020-21, £58bn in 2021-22 and 2022-23 and £60bn in 2023-24.
It was frustrating that the OBR scheduled their publication of these revised numbers for the first day of the General Election purdah period making it vulnerable – as happened – to being pulled. A day earlier and that would not have happened! Ideally, these revisions would have been published as soon as practical after the publication by the ONS of their revisions to historical numbers in September.
It would have been even better if the OBR had been able to update their economic forecast too, given that the current baseline is still based on an economic and fiscal analysis from nine-months ago. With weak economic growth over the first half of the financial year, it is likely that the OBR will cut its forecasts for tax revenues over the forecast period when it does get round to updating them, resulting in higher deficits – even before taking account of suggestions that the Conservative GE2019 winners plan to announce a splurge of more capital expenditures in the Spring Budget in February.
Unfortunately, we won’t see an updated long-term forecast until at least July 2020, when the OBR is scheduled to publish its next fiscal sustainability report on the prospects for the public finances.
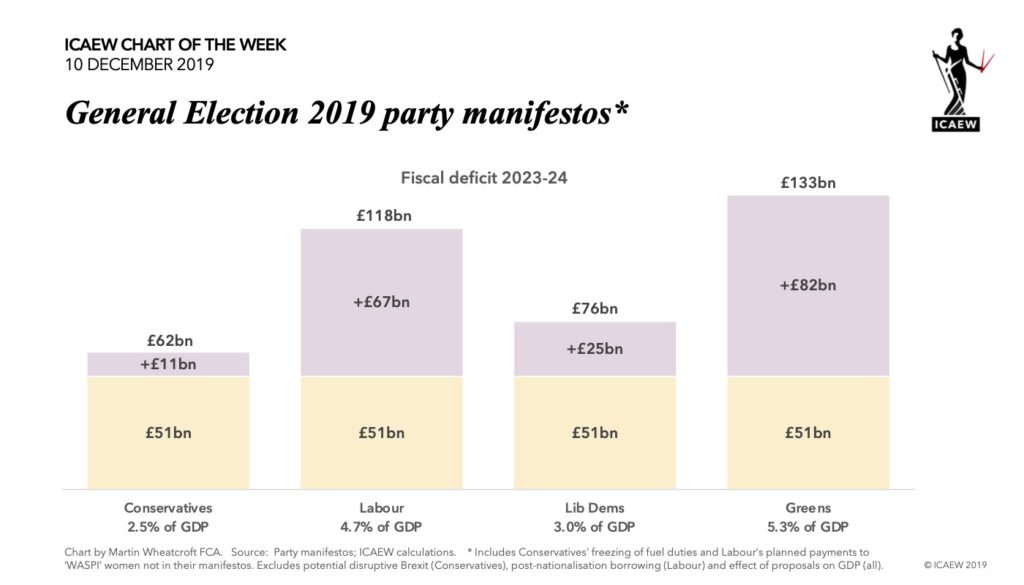
With voters in the UK going to the polls tomorrow, the #icaewchartoftheweek is on the political party’s plans for the public finances.
All the political parties are promising to increase taxes, public spending and investment, with the plan to eliminate the fiscal deficit now well and truly abandoned.
The Conservatives are promising the least in terms of additional spending and investment, with £3bn a year extra spending in 2023-24, £8bn in extra capital investment and tax rises broadly offsetting tax cuts. However, this is unlikely to be the final result as they have deferred significant financial decisions, such as the funding of adult social care, until after the election.
Labour is planning to spending much more with £83bn a year more spending by 2023-24, funded by £78bn tax increases and £5bn from higher economic growth. They plan capital investment of £55bn a year and £58bn in total over five years to compensate ‘WASPI’ women. This is pretty ambitious, leading the IFS and others to cast doubt on the achievability of their plans, while these numbers don’t include the additional borrowing from their plans to nationalise utilities, nor the borrowing of those businesses post-nationalisation.
The Lib Dem plans are also very ambitious, with £50bn extra a year public spending by 2024-25 funded by £37bn in higher taxes and £14bn in higher economic growth from cancelling Brexit. They plan to borrow an extra £25bn a year to fund new capital investment.
The Greens’ are planning to be even more ambitious, including completely reforming welfare provision with the introduction of a universal basic income, contributing to a £124bn increase in taxes and public spending (albeit some of this is a switch from tax deductions to cash payments). Their capital investment plans are the largest and likely to most difficult to deliver of all the major parties at £82bn a year on average over 10 years.
Unfortunately, none of the major political parties appear to have a fiscal strategy that extends beyond the next five years, with only limited measures to address the big financial challenges of more people living longer. This is disappointing given that relatively small actions taken now could make a big difference to the financial position of the nation in 25 years’ time.
With the General Election in full swing, the #icaewchartoftheweek is on one of the principal drivers of public spending: age.
As data from the Office for Budget Responsibility illustrates, public spending on the young increases as the population is educated, but then falls back to a low of around £600 per month at around age 28, after which spending per person starts to increase gradually over working lives until retirement age. From that point on, not only is there a significant increase in welfare spending as the state pension kicks in, but the costs of health care, and then adult social care start to increase dramatically.
With the number of people in the UK aged 70 or more expected to increase by 58% over the next 25 years, total public spending will increase accordingly, especially with all political parties promising to protect and improve the state pension, health provision and adult social care.
The number of people under the age of 70 projected by the ONS to increase by only around 2% over that same period, or potentially even fall by around 7% if net inward migration is lower than expected, while further cuts in public services are apparently off the table with the ‘end of austerity’. The implication is that taxes will need to rise, that social provision in retirement will need to be cut, or for there to be a resumption in austerity policies (or a combination of all three).
Unfortunately, none of the major political parties appear to have a fiscal strategy that extends beyond the next five years, with only limited measures to address the big financial challenges of more people living longer. This is disappointing given that relatively small actions taken now could make a big difference to the financial position of the nation in 25 years’ time.
This election, voters have the opportunity to focus on the big challenges of sustainability, technology and the public finances. To find out more, visit GE2019 – It’s More Than a Vote.
With apologies for the delay because of being away, this week’s #ICAEWchartoftheweek is on public sector capital expenditure (capex), something that all the political parties in the #GE2019 have promised to increase – in some cases by very significant amounts!
As part of ICAEW’s It’s More Than A Vote campaign, ICAEW will be analysing the political party manifestos over the next few weeks, including the potential implications for the public finances.
One area that all the major parties appear to agree on is the need to increase investment in infrastructure and other assets, which is why we thought we would look at the last nine years of capital expenditure reported in the Whole of Government Accounts (WGA), prepared under International Financial Reporting Standards. This differs from public sector investment in the National Accounts, with the latter including capital grants and other transactions that do not result in the creation of publicly-owned fixed assets.
As the chart illustrates, capital expenditure in 2017-18 of £60.0bn was lower than the £64.1bn incurred in 2011-12 after adjusting for inflation and to include Network Rail, the government owned railway infrastructure company prior to 2014-15 when it was incorporated into the WGA). As a proportion of the economy, capex in 2017-18 was 2.9% of GDP, a smaller ratio than the 3.5% calculated for 2011-12.
Only around £16bn (0.8% of GDP) of the amount spent in 2017-18 went into infrastructure assets (principally transport infrastructure such as roads and railways), with in the order of £24bn (1.2%) going into land & buildings, including hospitals and schools. Approximately £9bn (0.4%) was spent on military equipment, with the balance of £11bn (0.5%) invested in other public sector assets, ranging from tangible fixed assets such as plant & equipment, IT hardware, vehicles and furniture & fittings, as well as intangible fixed assets such as software.
Capex comprises a relatively small proportion of total expenditures (capital and non-capital) of £1.0tn reported in the WGA for 2017-18. As a consequence, even relatively small incremental amounts will constitute proportionately large increases in capital budgets in the next few years.
Whether these plans will be deliverable is another question, given that traditionally the government has struggled to spend all its capital budgets, not to mention the difficulties there will be in finding all the workers necessary for a major expansion in construction activity.
The ONS announced today that the real-terms change in quarterly GDP for Q3 (July to September 2019) was +0.3%, a turnaround from the contraction of -0.2% seen in Q2.
The #icaewchartoftheweek looks instead at the seasonally adjusted monthly changes in GDP over the last year. This is a view that the ONS tends not to highlight because it highlights one of the issues with GDP, which is the inherent difficultly in estimating it accurately. It prefers to remove the rockiness in the monthly numbers by averaging the results over longer periods, such as its headline three-month rolling estimates reported in the media today; a number that is still subject to revision, but to a lesser extent than that for individual months.
The monthly contraction of -0.07% in September may therefore not make the headlines, but it is the principal reason why expectations of 0.4% for quarterly growth were 0.1% too high. Most economists expected the economy to be flat this month, rather than the small contraction in the statistics released this morning.
Revisions may have a significant impact on the October monthly GDP estimates scheduled to be released two days before the general election on 10 December 2019. A flat October with no revisions would see the three-month rolling GDP number fall to 0.0%, while a further contraction could see quarterly growth turn negative, a potentially significant contributor to the public debate in the couple of days before the polling booths open.
Perhaps the main conclusion that can be drawn is not about the specific monthly changes themselves, but rather how the economy is so weak that a very small change either in actual economic activity, or in statistical data collection, can easily move the numbers from positive to negative or vice-versa.
A rather dismal perspective to hold onto as the debate rages and claim and counterclaim are made.
Although most of the focus on the balance of payments is on trade, i.e. imports and exports of goods and services, it is not the only element in the balance of payments equation, as the #icaewchartoftheweek illustrates.
Based on the 2019 Pink Book published by the Office for National Statistics last week, the balance of payments between the UK and the rest of the world in 2018 comprised a current account deficit of £93bn and a capital account deficit of £3bn, balanced by net inward investment of £77bn and errors and omissions of £19bn.
The current account deficit remains high by historical standards and was equivalent to 4.3% of GDP in 2018, up from 3.5% of GDP in 2017.
The current account deficit incorporates a trade deficit of £38bn, with imports of £680bn exceeding exports of £642bn. This reflects a surplus in services of £104bn that was more than outweighed by a deficit in goods of £142bn.
The primary income deficit of £29bn reflected £242bn in outflows – mainly investment income paid to foreign investors – less £213bn coming into the UK, while the secondary income deficit of £26bn reflects contributions to international institutions (including the EU), international development assistance, remittances and other net transfers.
Capital flows of £3bn reflect both sales of non-financial assets, and capital grants to other countries.
Inward investment of £178bn comprised direct investment in UK businesses of £28bn and £151bn of equity and debt investments, less a net £1bn movement in other forms of investment. Outward investments amounted to £101bn, with direct investments in foreign businesses of £29bn and £204bn in other movements (including currency changes), less net sales of £132bn of equity and debt investments.
Unfortunately, getting the balance of payments to actually balance is quite difficult and so the ONS has plugged the difference between the current, capital and financial accounts with £19bn in ‘errors and omissions’. The ONS will continue to revise the statistics over time, with the aim of improving the accuracy of the components reported.
Although the precise numbers will continue to be refined, the overall picture presented by the ONS is unlikely to change. The UK continues to buy more than it sells, pays out more to foreign investors than is earned from foreign investments, and transfers money to the rest of the world; with finance provided by foreign investors.