13 November 2020: The claimant count soared at the start of the pandemic but levelled off since then. Will a wave of redundancies see it climb again over the winter?
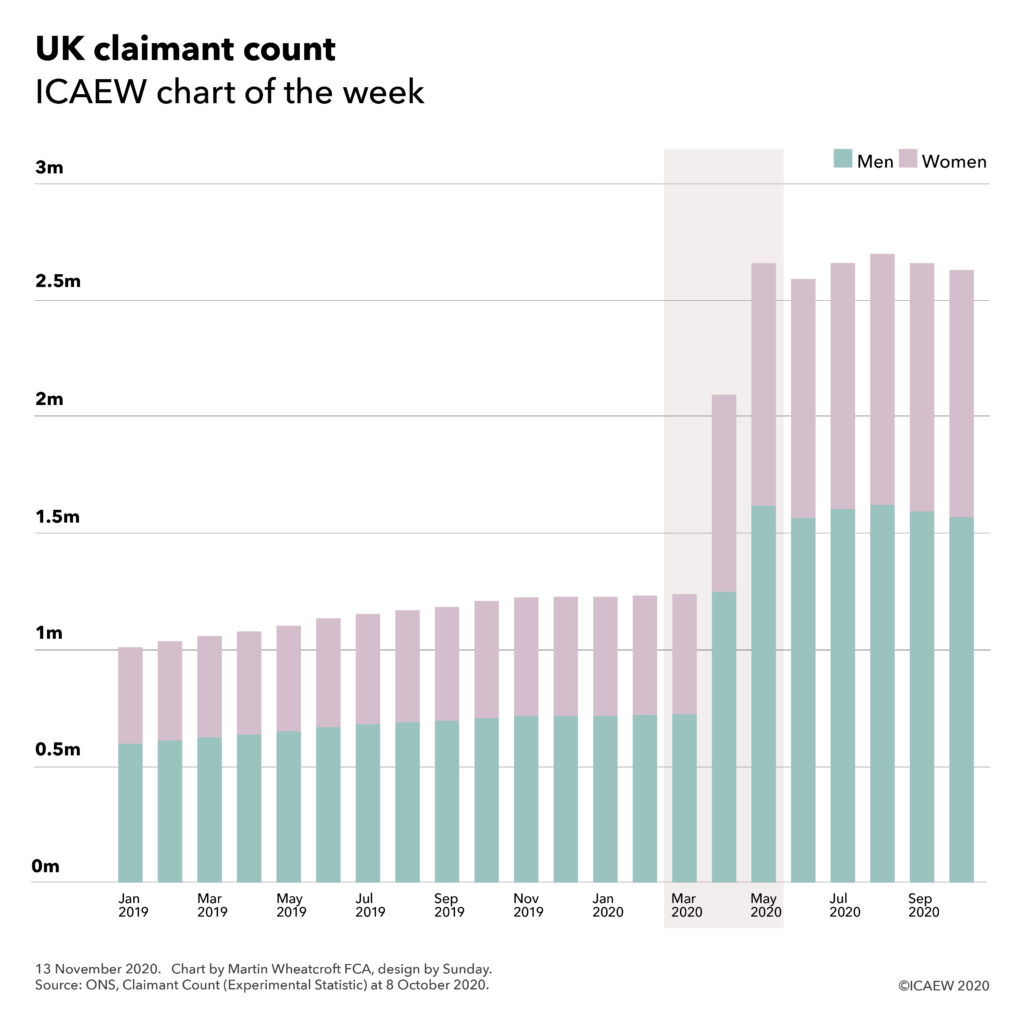
This week’s #icaewchartoftheweek looks at the claimant count, an experimental statistic compiled by the Office for National Statistics (ONS) that seeks to reflect those on Universal Credit who are not in employment or who are required to search for work, in addition to those receiving Jobseeker’s Allowance.
As the chart illustrates, the claimant count had already been on an upward path prior to the pandemic as Universal Credit rolled out across the country, reaching a total of 1,240,000 on 8 March before jumping to 2,663,000 a couple of months later in May during the first lockdown. The number has moved around a little since then, dropping slightly to stand at 2,634,000 on 8 October, comprising 1,571,000 men and 1,063,000 women.
The rapid rise in claimants has not been reflected in the same way in the unemployment statistics, which increased less dramatically, albeit still significantly, from 1,355,000 in March to 1,661,000 in September 2020. This suggests around 300,000 of the increase in the claimant count is down to greater unemployment, with the balance of approximately 1,150,000 arising from ‘underemployment’ as claimants have had their hours and/or pay levels cut taking them below the relevant Universal Credit thresholds.
The recent rise in redundancies – up to a record 314,000 in the quarter to September – is likely to add further to the claimant count over the winter, although the extension in furlough arrangements until next March may constrain that rise to a certain extent.
News that a vaccine is on its way may well be positive for the second half of 2021, but in the meantime it is going to be a hard winter for many.