ICAEW chart of the week: UK quarterly public finances

Our chart this week looks at the fiscal forecast for the final quarter of the government’s financial year ending in March 2022.

Column chart showing quarterly deficits:

2019/20 outturn £55bn deficit: Apr-Jun £23bn, Jul-Sep £12bn, Oct-Dec £23bn, Jan-Mar -£3bn

2020/21 outturn £322bn deficit: Apr-Jun £133bn, Jul-Sep £77bn, Oct-Dec £66bn, Jan-Mar £46bn

2021/22 forecast £183bn deficit: Apr-Jun £61bn, Jul-Sep £41bn, Oct-Dec £45bn, Jan-Mar £23bn, with £13bn headroom

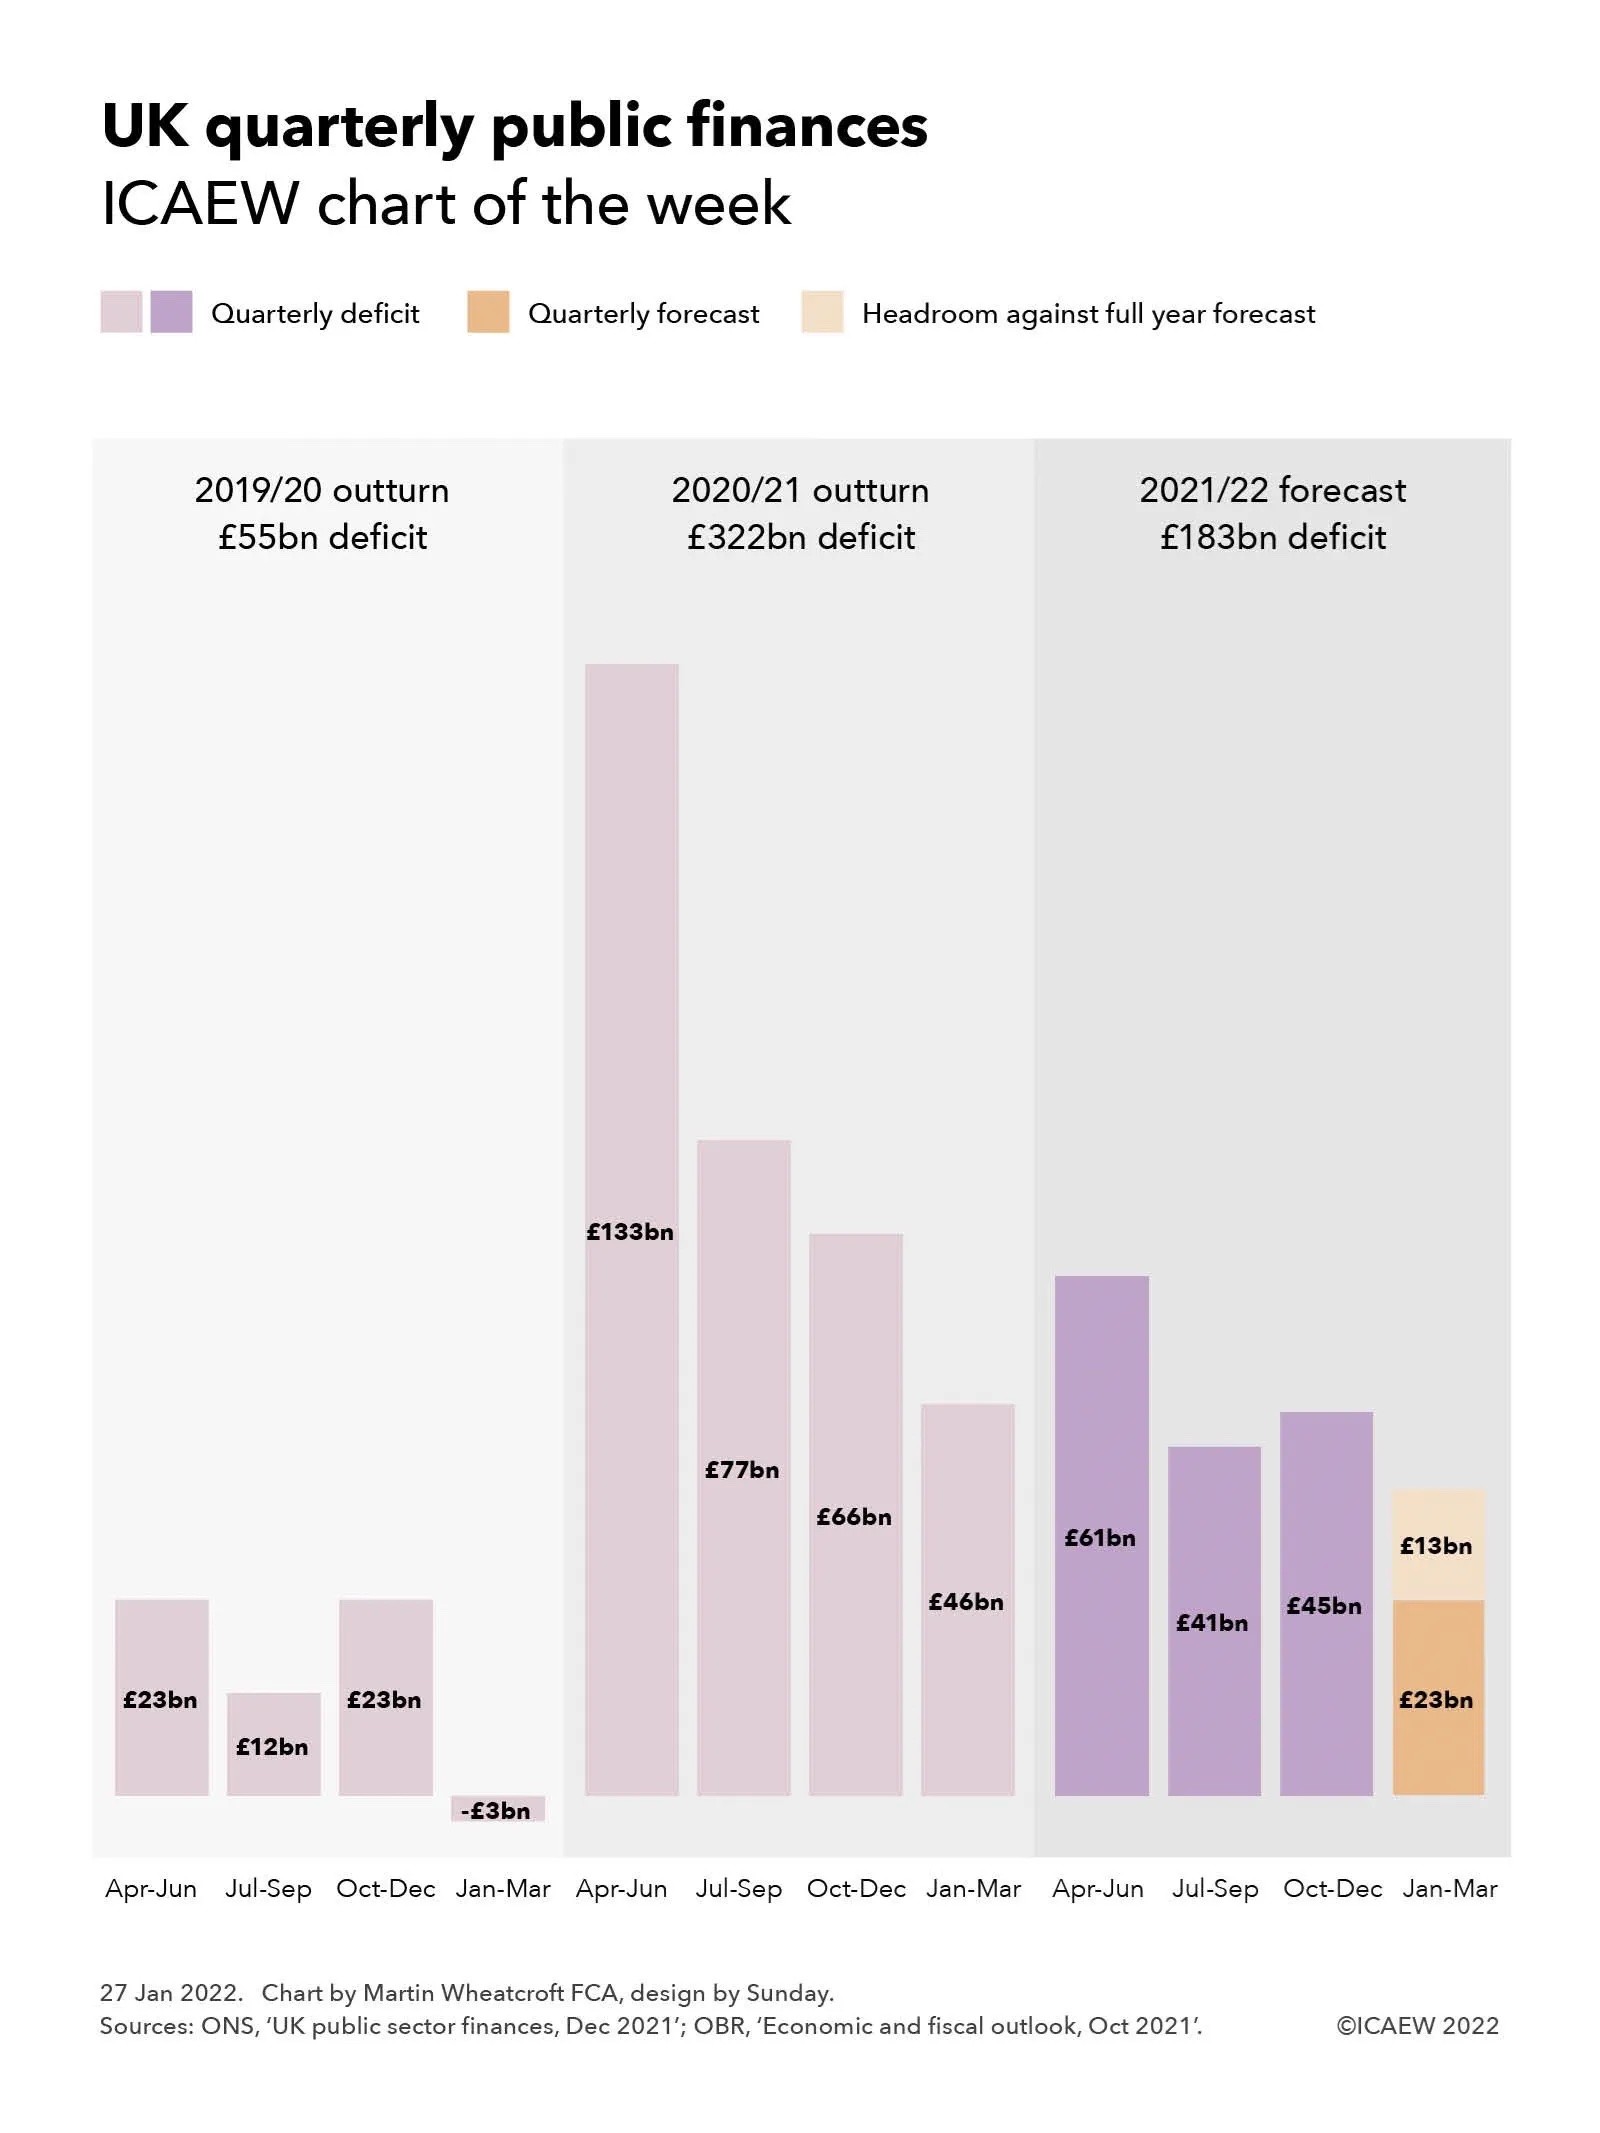
The December 2021 public sector finances published by the Office for National Statistics (ONS) on Tuesday 25 January provided numbers for the first three quarters of the current financial year. As our chart this week illustrates, this leaves the final quarter still to go, with £13bn of headroom against the official forecast prepared by the Office for Budget Responsibility (OBR) at the time of the Autumn Budget and Spending Review 2021 back in October.

To put the current fiscal year into context, our chart shows how the deficit of £55bn in 2019/20 comprised quarterly deficits of £23bn for April to June 2019, £12bn for July to September 2019 and £23bn for October to December 2019 less a surplus of £3bn for January to March 2020. Although there was some impact from the pandemic on the last month of that financial year, it broadly provides an indication of a ‘normal’ pattern of deficits across the year, with the second quarter and more especially the fourth quarter benefiting from self assessment tax receipts – the latter despite typically higher levels of capital expenditure in the run up to the end of the financial year.

This was followed by the first full year of the pandemic and associated lockdowns which saw tax receipts fall significantly and expenditures rise dramatically, resulting in an unprecedented peacetime deficit of £322bn in 2020/21, comprising £133bn, £77bn, £66bn and £46bn for the four quarters respectively.

The current forecast is also on course for a pretty eye-watering deficit, which despite being substantially below that seen last year is forecast to be as much as £183bn. The provisional numbers for the first three quarters of 2021/22 of £61bn, £41bn and £45bn respectively are currently £13bn below the October forecast, implying an equivalent amount of headroom for the final quarter, assuming the OBR’s forecast deficit of £23bn for the fourth quarter proves to be accurate.

In practice, it would be surprising if the fourth quarter did come in on target other than by coincidence. Better than expected tax revenues are expected to continue to reduce the deficit over the final quarter but this is likely to be offset to a greater or lesser extent by higher interest costs on index-linked debt driven by rising inflation. There are also significant uncertainties around expenditures given the continuation of pandemic restrictions into January and the potential for further interventions to support businesses and individuals struggling financially as a consequence.

There have been suggestions that this headroom of £13bn is a ‘windfall’ that the Chancellor should use to support households expected to be hit by a greater than 50% rise in energy prices from April 2022 as discussed in last week’s chart of the week.

However, this perspective has also been contradicted by Carl Emmerson, Deputy Director at the Institute for Fiscal Studies (IFS), who is reported to have commented: “While borrowing last month was in line with the Budget forecast, over the first nine months of 2021/22 it is now £13bn below that forecast for the same period in the October Budget – £147bn instead of the £160bn expected in October. The latest improvement to borrowing over this period has been driven by higher-than-expected corporation tax being paid by some very large companies.

“Some have suggested better borrowing figures provide the Chancellor room to act on the cost of living by, for example, delaying the rise in National Insurance contributions planned for April. The truth is these figures make no difference to that calculation. Mr Sunak certainly could find money to delay tax rises or find other one-off ways of supporting living standards such as uprating benefits in April with a more up-to-date measure of inflation. But the long-run pressures on public services, especially health and social care, remain just the same and tax rises are likely to be needed if these are to be met. If he acts now on the cost of living, Mr Sunak will also need to find a credible means of committing to taking tough action on the public finances in the not too distant future.”

Even if the deficit does come in below the official forecast of £183bn, it will still be at a much higher level than that expected before the pandemic, when the forecast deficits for 2019/20, 2020/21 and 2021/22 were £47bn, £55bn and £67bn respectively compared with the much larger numbers reported in our chart. A variance of £13bn is also relatively small in the context of the £547bn increase in public sector net debt between March 2020 and December 2021.

All this suggests that the next fiscal event scheduled for 23 March 2022 is likely to take on even more importance as the Chancellor seeks to navigate between the rock of fiscal responsibility and a hard place of a cost of living crisis.

This chart was originally published by ICAEW.

ICAEW chart of the week: UK international trade

As 2021 draws to a close, our chart this week looks back on a rocky couple of years for UK international trade which has endured Brexit complications and the global COVID-19 pandemic.

A column chart showing monthly exports (in orange) and imports (in purple) stacked on top of each other, going from October 2014 to October 2021. The y-axis goes from £0bn to just over £120bn.

Total exports + imports increased from £92bn  in October 2014 to a peak of £123bn in March 2019, fell £113bn the following month before peaking again at £122bn in October 2019. 

Trade fell to a low of £86bn in May 2020, recovered to £111bn in December 2020, fell to £93bn in January 2020 and grew to £104bn in July 2021 with similar monthly totals in September and October 2021.

Our chart of the week illustrates how Brexit and COVID-19 have combined to create a rocky couple of years for UK exports and imports of goods and services, reflecting the trials and tribulations of the Brexit process as well as the impact of the coronavirus pandemic on trade since the first lockdown last year.

The monthly trade total (exports + imports) increased from £92bn (£45bn + £47bn) in October 2014 to a peak of £123bn (£57bn + £65bn) in March 2019 at the height of Brexit ‘no deal’ preparations before falling back to £113bn (£54bn + £59bn) the following month before peaking again at £122bn (£61bn + £62bn) in October 2020 ahead of the end of the transition period. Following the introduction of new trading arrangements and the run-down of inventories, trade fell to a low of £86bn (£47bn + £39bn) in May 2020 during the first lockdown before recovering to £111bn (£52bn + £59bn) in December 2020. Trade fell back to £93bn (£45bn + £48bn) in January 2020 before growing back to £104bn (£51bn + £53bn) in July 2021 where it has appeared to stabilise with similar monthly totals in September and October 2021.

The chart provides only a hint of the challenges that have faced both importers and exporters over the past couple of years as they have had to navigate new trading arrangements with our European neighbours just as the pandemic has caused massive disruption across the planet. Imports and exports to EU countries have both fallen, but the EU still remains the UK’s principal trading partner, comprising almost half of the UK’s trade in goods for example.

The stabilisation in trade flows in the last few months for which statistics are available may be a hopeful sign, but with greater customs checks on the imports of goods from the UK coming into force in January, and the continuing evolution of the pandemic, the position is still very uncertain.

This is our last chart of the week for 2021 and so we would like to take this opportunity to wish you all the best for a safe and enjoyable Christmas break and for a healthy and prosperous 2022. We look forward to seeing you again in the new year.

This chart was originally published by ICAEW.

ICAEW chart of the week: Bounce Back Loans

My chart this week is on Bounce Back Loans, one of the principal sources of financial support for businesses during the first year of the pandemic and the subject of a recent investigation by the National Audit Office.

Chart analysing Bounce Back Loans of £47bn by region and by recoverability.

London £11bn, South £10bn, Midlands & East £11bn, North £9bn, Scotland, Wales & Northern Ireland £6bn.

Repaid £2bn, recoverable £28bn, bad debts £12bn, fraud £5bn.

The recent publication of the Department for Business, Energy & Industrial Strategy (BEIS) accounts for 2020-21 contained an assessment of the losses expected on the financial provided to businesses through the Bounce Back Loan Scheme (BBLS), the Coronavirus Business Interruption Loan Scheme (CBILS), the Coronavirus Large Business Interruption Loan Scheme (CLBILS) and the Future Fund. This was followed by an updated report from the National Audit Office (NAO) on the administration of the scheme and the potential losses to the taxpayers.

The largest of these schemes was BBLS, with Bounce Back Loans of up to £50,000 provided to eligible businesses to help them weather the first lockdown in the second quarter of 2020, before being extended to the whole of the 2020-21 financial year. In the end, around a quarter of businesses took out a Bounce Back Loan, comprising 1.5m loans for a total of £47bn at an interest rate of 2.5% repayable over six years. The interest in the first year was covered by the government, with no repayments due in that period. 

Businesses can extend the loans to ten years through the Pay As Your Grow option, as well as being allowed up to one six month payment holiday and three interest-only payments to provide flexibility without going into default.

The seven main UK banks provided around 90% of the loans by value, with the rest provided by other banks and non-bank lenders, such as peer-to-peer lenders. Each participating financial institution was provided with a 100% guarantee by the government to cover any amounts not repaid. Half a million or nearly 35% of the loans were for the maximum amount of £50,000 (adding up to £27bn) with £18bn lent out between £10,000 and £50,000 and £2bn lent for amounts between £2,000 (the minimum possible) and £10,000.

As the chart illustrates, the geographical distribution of loans was weighted towards the south and centre of England, with £11bn borrowed by businesses in London, £10bn in the South (£6.5bn South East and £3.6bn South West) and £11bn in the Midlands & East (£3.8bn West Midlands, £2.9bn East Midlands and £4.5bn East of England), a total of £32bn. The balance of £15bn was split between £9bn in the North (£3.2bn Yorkshire & the Humber, £4.8bn North West and £1.3bn North East) and £6bn in the other nations of the UK (£2.7bn Scotland, £1.6bn Wales and £1.3bn Northern Ireland).

More than 90% of the loans, amounting to £40bn, went to micro-businesses, ie businesses with turnover below £632,000.

BEIS have estimated in their 2020-21 financial statements that they do not expect 37% of the loans with a value of £17bn to be repaid, comprising £12bn in estimated bad debts and £5bn in estimated losses from fraud, although the NAO says that these numbers are highly uncertain at this stage. With £2bn already repaid, this leaves £28bn believed to be recoverable over the remainder of the six years of the loans (or 10 years for those that are extended).

The fraud estimate, for 11% of the loans with a value of £4.9bn, was based on a sample of 1,067 loans as at 31 March 2021, but a subsequent analysis in October 2021 suggests that the level of fraud may be lower at around 7.5% of loans and so there is some hope that BEIS and the British Business Bank will be able to reduce the amount they will have to reimburse to participating banks under the 100% guarantees.

However, as the NAO reports, these guarantees mean participating banks have no financial incentive to chase repayment and it has raised concerns that insufficient resources are being dedicated by BEIS and the British Business Bank to recovering outstanding amounts. 

The challenge for government is that many businesses have not been able to get back to their pre-pandemic level of operation and so there is a need to be sensitive, whilst at the same time seeking to protect public money and tackle those who made fraudulent claims.

This chart was originally published by ICAEW.

ICAEW chart of the week: Spending Review 2021

Chancellor of the Exchequer Rishi Sunak found some extra money to supplement the Spending Review 2021, turning a very tough settlement for government departments into a moderately tough one.

Departmental budgets chart.

2019-20: £416bn (£346bn resource, £70bn capital)
2020-21: £570bn (£355bn, £88bn, £127bn covid-19 supplementary budget)
2021-22: £554bn (£385bn, £99bn, £70bn)

Spending Review 2021

2022-23: £542bn (£435bn resource with +£15bn health & social care and +£27bn spending review, £107bn capital)
2023-24: £554bn (£443bn with +£12bn and +£21bn, £111bn)
2024-25: £566bn (£454bn with +£14bn and +£13bn, £112bn)

The Chancellor had already announced an increase in the health budget from the proceeds of the health and social care levy, but as highlighted by our chart last week, this implied a very tough budget settlement for most other departments, including cuts for some. Instead, Rishi Sunak was able to use some of the upward revisions in the economic forecasts from the Office for Budget Responsibility to add to departmental resource budgets, ensuring that each department receives a real term spending increase in their combined resource and capital budgets even with higher levels of inflation in the coming year.

However, there was a sting in the tail, as supplementary COVID-19 funding ceases at the end of this financial year, leaving departments to absorb further COVID-related expenditure within their budgets from next April onwards. This will include catching up on backlogs built up during the pandemic in addition to any incremental costs that may continue into the Spending Review period.

The chart starts by highlighting how departmental resource and capital budgets of £346bn and £70bn in 2019-20, increased to £355bn and £88bn in 2020-21 and to £385bn and £99bn in the current year. This is before £127bn in COVID-19 supplementary budgets last year and £70bn this year.

The Spending Review period itself covers the three financial years 2022-23, 2023-24 and 2024-25, with the combination of funding from the health and social care levy and the Spending Review seeing departmental resource budgets increase to £435bn, £443bn and £454bn respectively. This is more than the spending envelope originally set out by the Chancellor last month.

Capital investment budgets remained broadly unchanged at £107bn, £111bn and £112bn respectively, continuing the significant jump from the £70bn invested in 2019-20 in the coming financial year before flattening out in the following two years.

Over the three years, the resource budget settlement implies annualised average real terms growth in the health & social care budget of 4.1% and in the education budget of 2.2%, while the defence budget is broadly frozen in cash terms and cut by 1.4% in real terms. This assumes average inflation over the three years of 2.2%, with higher inflation in the coming financial year offset by much lower rates in the following two years.

Other departments are expected to grow by 3.1% on average over the period, with central funding for local government up 9.4%, transport up 6.8%, work & pensions up 4.6% and justice up 4.1%, each receiving larger relative settlements than other departments. International trade (+0.1%), HM Treasury (+0.9%), levelling up, housing & communities (+1.1%), HMRC (+1.2%), the Cabinet Office (+1.4%), business, energy & industrial strategy (+1.4%), and intelligence (+1.7%) are the departments receiving increases below 2% a year on average.


2021-22
£bn

2022-23
£bn

2023-24
£bn

2023-24
£bn
Average
real-terms
growth
Education147.1167.9173.4177.4+4.1%
Defence70.777.079.080.6+2.2%
Transport31.532.432.232.2-1.4%
Large departments249.3277.3284.6290.2+2.9%
Other departments70.783.982.782.7+3.1%
Devolved administrations56.863.064.365.3+2.5%
ODA to 0.7% of GDP5.2
Reserves8.111.010.910.3
Total excluding covid-19384.9435.2442.5453.7+3.3%
HM Treasury, ‘Autumn Budget and Spending Review 2021’

The above growth rates exclude capital budgets, expected to increase in real terms by 1.9% a year on average over the three years of the Spending Review. Departments benefiting from higher capital budgets include small and independent bodies (+16.8%), FCDO (+16.0%), digital, culture, media & sport (+11.8%), and intelligence (+9.1%), albeit mostly from relatively small bases in each case. The 3.8% average real terms increase in health & social care capital investment is much less proportionately, but much larger in cash terms.

Perhaps just as important as the monetary amounts provided to departments as the Chancellor opened his proverbial cheque book, is the certainty that a three-year budgetary settlement provides. This will help departments plan ahead with confidence and hopefully help them obtain better value for the money they spend on our behalf.

This chart was originally published by ICAEW.

ICAEW chart of the week: Pre-Spending Review departmental spending

The chart this week looks at the core departmental resource budgets that are central to next Wednesday’s long-awaited Spending Review.

The Spending Review and Autumn Budget on Wednesday 27 October will see the Chancellor set out departmental budgets for the next three financial years from 1 April 2022. The #icaewchartoftheweek shows the core departmental resource budgets for the current financial year, excluding COVID-19 related spending, capital investment, and annually managed expenditure such as the state pension and welfare provision.

With budget settlements for health, schools and defence already pencilled in, there may be a need for cuts in some departments if the Chancellor is to be able to free up cash to direct it where it is most needed. 

The Chancellor has already announced that the spending envelope will increase core departmental resource budgets of £385bn as shown in the chart to £408bn in 2022-23, £422bn in 2023-24 and £441bn in 2024-25. 

This might be seen as implying generous budget increases are on offer, but £18bn of the £23bn increase in the coming financial year has already been allocated to the Department for Health & Social Care (DHSC). This reflects £13bn of additional funding from the recently announced health and social care levy in addition to already planned increases in health spending, taking the DHSC budget to £164.8bn in 2022-23, rising to £171.4bn and £175.9bn in the following two years.

A further £2bn has been allocated to English schools next year (taking it from £49.8bn to £52.2bn within the Education’s overall £70.8bn budget) while the Ministry of Defence’s current budget of £31.6bn is expected to receive a flat budget settlement in 2022-23 before rising in subsequent years. With just under a billion in consequential increases to the devolved administrations under the Barnett formula, that leaves a mere £2bn available for non-schools education and all the other departments. 

With local government and departments such as Justice under severe financial pressure, the implication is that some departments may receive cuts in their core budgets to free up extra cash for those more in need.

Other departmental budgets of £70.5bn in 2021-22 include the Home Office £13.7bn, Local Government £8.5bn, Justice £8.4bn, the Foreign, Commonwealth & Development Office (FCDO) £7.4bn, the Department for Work & Pensions (DWP) £5.7bn, HMRC £4.9bn, the Department for Transport (DfT) £4.7bn, the Department of Environment, Food & Rural Affairs (DEFRA) £4.2bn, the Department for Business, Energy & Industrial Strategy (BEIS) £2.6bn, the Single Intelligence Account (SIA) £2.2bn, the Department for Levelling Up, Housing & Communities (DLUHC) and the Department for Digital, Culture, Media & Sports £1.7bn. This is followed by a series of smaller departments such as the Cabinet Office £0.7bn, Law Officers £0.7bn, the Department for International Trade (DIT) £0.5bn and HM Treasury £0.3bn as well as non-ministerial departments and other public bodies.

The chart does not include capital budgets, which are expected to rise from £99.8bn in the current year to £107.3bn, £109.1bn and £112.8bn in 2022-23, 2023-24 and 2024-25 respectively. Here, the Chancellor has greater room for manoeuvre and it would not be surprising for the Budget Statement next month to focus on capital investment programmes across the country rather than the more challenging budget settlements for current expenditure that most departments are likely to receive.

This chart was originally published by ICAEW.

ICAEW chart of the week: UK public debt profile

Our chart this week shines a spotlight on the UK’s public debt, focusing on the Government’s debt strategy ahead of the fast approaching Spending Review.

A big worry for the Chancellor of the Exchequer in putting together the Budget and Spending Review this month is the possibility that higher inflation and interest rate rises will hit the public finances, restricting the amounts he has available to meet his policy objectives. Our chart this week illustrates just how exposed the UK’s public debt is to changes in inflation and interest rates.

UK public debt profile - column chart

UK public sector net debt before QE: Index-linked £470bn + Variable-rate £490bn + Fixed-rate £1,580bn - Cash and liquid assets £340bn = £2,200bn

Quantitative easing: £980bn (£735bn overlaps with fixed-rate and £245bn overlaps with variable-rate.

UK public sector net debt after QE: Index-linked £470bn + Variable-rate £1,225bn + Fixed-rate £845bn - Cash and liquid assets £340bn = £2,200bn

Sources: Office for National Statistics, Debt Management Office, ICAEW calculations and estimates.

UK public sector net debt was marginally over £2.2tn at the end of August 2021, comprising in the order of £2,540bn in gross debt less £340bn in cash and liquid assets. As ICAEW’s chart of the week illustrates using approximate numbers, this can be broadly divided into fixed-rate, variable-rate and index-linked debt, reflecting the Government’s debt strategy as executed by the UK Debt Management Office and by National Savings & Investments.

What the chart highlights is how quantitative easing (QE) has changed the profile of UK public debt significantly. This tool has been used by the operationally independent Bank of England to ease monetary policy by pumping money into the economy in response to the financial crisis a decade ago and the coronavirus pandemic more recently, but has the effect of switching fixed-rate government securities into variable-rate central bank deposits, contributing to falling interest costs even as public sector net debt has risen from less than £0.5tn in 2007 before the financial crisis to £1.8tn in March 2020 before the pandemic and £2.2tn currently.

Fixed-rate debt of £1,580bn comprises approximately £1,490bn in government bonds or gilts repayable over periods generally ranging from five to 30 years, together with £75bn in other central and local government loans net of intra-government holdings (which we have assumed are mostly fixed-rate in nature) and up to £15bn in fixed-rate savings certificates sold to individual investors by National Savings & Investment.

Variable-rate debt of £490bn comprises around £185bn of variable-rate National Savings & Investments deposits and certificates, £60bn in short-term Treasury bills, and £245bn in Bank of England liabilities relating to QE (see below). The balance of £470bn is in the form of index-linked gilts, where the amounts owed increase in line with the retail prices index (RPI).

This is before deducting £340bn in cash and liquid assets, comprising around £150bn of official reserves (much of which is currency deposits with foreign central banks) and £115bn, £40bn and £35bn in bank, building society and other liquid financial asset holdings held by central government, local government and other parts of the public sector respectively.

In practice, the sterling work of the UK Debt Management Office (DMO) to create a balanced portfolio of public debt has been upended by the Bank of England’s Monetary Policy Committee, albeit with the agreement of successive Chancellors. The spread of inflation-, variable- and fixed-rate exposure combined with extended maturities to manage refinancing requirements over longer periods has been offset by £980bn of QE purchases and lending that has replaced £735bn (or around half) of the fixed-rate gilts in issue at nominal value with central bank deposits that pay interest at the Bank of England base rate – reducing the net fixed rate exposure to £845bn. This is in addition to the QE-related liabilities of £245bn already included in variable-rate debt, of which £110bn was used to finance Term Funding Scheme low-cost business loans, £20bn to fund corporate bond purchases, and £115bn to finance premiums on gilt purchases (in effect prepaying some of the interest that would have gone to external investors over time if the gilts had not been purchased by the Bank of England).

The consequence is a public debt portfolio that is currently being financed much more cheaply than anyone ever expected, but which is much more sensitive to changes in inflation and interest rates than was ever planned.

With inflation now expected to rise to in the order of 5% (or even higher) over the next few months, and suggestions that the Bank of England may start to increase the base rate in early 2022, the gains the public finances have experienced from ultra-low borrowing costs look as if they will start to go into reverse. This is likely to put additional pressure onto the public finances at a time of elevated economic uncertainty, making for even tougher choices for the Chancellor on both tax and spending in the Spending Review and Autumn Budget in a couple of weeks’ time.

This chart was originally published by ICAEW.

ICAEW chart of the week: UK public sector employment

Our chart this week is on public sector employment, the cost of which is one of the largest components of the Spending Review in a few weeks’ time.

Chart showing UK public sector employment between June 2001 and June 2021.

See text below for description of trends.

One of the key drivers for any budget or business plan is the number of full-time equivalent employees (FTEs) and it is no different in the public sector, where staff costs in the order of £150bn constitute just under 40% of departmental resource budgets of £385bn in 2021-22 (excluding depreciation and COVID-related spending).

The chart illustrates how public sector employment has grown, fallen and grown again over the last 20 years. It starts with the largest employer in the country – the NHS – where the workforce has increased from 1,025,000 FTEs in June 2001 to 1,626,000 FTEs in 2021. This 59% increase in staffing is substantially greater than the 14% increase in the size of the UK population from 59m to 67m over the same period, reflecting how the combination of more people living longer but less healthy lives and more successful treatments for cancer (for example) have resulted in substantially more for the NHS and its workforce to do.

Education FTEs are up 16% from 997,000 twenty years ago to 1,113,000 this year, is more in line with the growth in the size of the population, although most of the increase happened before the financial crisis, with FTEs working in education still below the peak of 1,210,000 in March 2012.

Public administration is down from 20 years ago, with 966,000 FTEs in June 2021 compared with 998,000 two decades previously. FTEs increased to a peak of 1,081,000 in June 2005 before falling gradually to 1,010,000 in June 2010, followed by more significant falls following the financial crisis. Most of the net fall represents fewer public servants in local government since the financial crisis , with civil servants in central government only slightly below where they were 20 years ago at 465,000 FTEs in June 2021 compared with 492,000 in June 2001. The total would have been much lower but for a post-Brexit surge in the size of the civil service, which has grown by 20% from its nadir of 384,000 FTEs in June 2016.

Police and armed forces FTEs have fallen from 436,000 in June 2001 to 417,000 in June 2021, mainly due to a steady decline in the armed forces from 219,000 to 159,000 FTEs over that period. Police numbers (including civilian support staff) increased from 222,000 FTEs 20 years ago to a peak of 284,000 in September 2009, fell to 235,000 FTEs in December 2016, and then started to increase again over the course of the last two years to reach 258,000.

Other public sector workers, including community health and social workers and employees of public corporations such as the BBC, Channel 4, Crossrail and Ordnance Survey have fallen from 973,000 to 655,000 FTEs, having reached a peak of 1,322,000 in March 2008 following the nationalisation of a number of banks. Most of the fall since then is a consequence of transfers to the public sector, including housing associations, Royal Mail, Direct Line, Lloyds Banking Group and Northern Rock.

Overall, public sector employment grew from 4,429,000 FTEs in June 2001 to a peak of 5,292,000 FTEs in December 2009 before falling to 4,777,000 FTEs in June 2021, comprising net changes of +601,000 in the NHS, +116,000 in Education, -32,000 in public administration, -19,000 in the police and armed forces and -318,000 in other public sector employees.

Of course, staff numbers are only part of the equation as the 4,777,000 FTEs currently employed have to be multiplied by an average salary of around £34,000 a year to reach the more than £160bn estimate for total staff costs across the public sector. This is the average of total pay – the median full-time salary is lower than this at somewhere in the region of £26,000.

Pay is one of the key drivers, with a pay freeze for many public sector workers announced last year helping to constrain the growth in the wage bill. With the cost of living on the march upwards, it seems unlikely that the Chancellor will be able to justify as strict a pay freeze this year, although he will still be looking to constrain wage settlements as much as possible. Wage settlements in the private sector are also likely to be higher this year, another worry for the Treasury given the £230bn or so the public sector spends every year on external procurement.

The recent upward trend in public sector employment is a big challenge for the Spending Review, particularly the continual growth in NHS staff as more people live longer lives, in addition to commitments to recruit more police officers and to improve other public services. Higher wage settlements in both the public and private sectors could significantly affect the number of people the government can afford to employ to meet its policy objectives.

ICAEW chart of the week: capital investment before the Spending Review

Given that capital budgets are often the first to be cut when money is tight, will the planned growth in capital investment survive the Spending Review later this month?

Capital investment before the spending review

Departmental capital budgets from 
2019-20 through 2025-26: £70bn, £92bn, £100bn, £107bn, £109bn, £113bn, £117bn

Local and other capital budgets: £14bn, £10bn, £7bn, £7bn, £11bn, £10bn, £10bn.

Sources: HM Treasury and Office for Budget Responsibility, Spring Budget 2021. Excludes covid and student loans.

Our chart this week is on public sector capital investment, illustrating how central department capital budgets increased from £70bn two years ago to £92bn last year and £100bn this year, with further increases planned up to £117bn in 2025-26. This path was originally set by former Chancellor Philip Hammond who believed boosting capital investment, particularly on infrastructure, would help address the productivity gap that has constrained economic growth over the last decade. Chancellor Rishi Sunak has broadly adopted the same approach of increasing capital budgets in the first half of the 2020s, but with the rather snappier objective of ‘levelling up’ opportunity across the country.

Local and other capital budgets in the public sector are actually significantly higher than those shown in the chart (£14bn, £10bn, £7bn, £7bn, £11bn, £10bn and £10bn in 2019-20 through 2025-26), but that is primarily because a substantial proportion of both local government and public corporation capital investment is funded through central government capital grants, which are already included within departmental capital budgets. The balance, funded by local taxation and non-tax revenues, has actually fallen in the last few years, especially as many local authorities have tightened their belts as social care and other costs have outstripped council tax receipts.

The Treasury announced last month that the envelope for the Spending Review would adopt the capital spending profile already set out in the Spring Budget in March as shown in our chart, with core capital department expenditure limits (Core CDEL) of £107bn in 2022-23, £109bn in 2023-24 and £113bn in 2024-25. It seems likely that the government will stick ahead with these capital plans, unlike the profile for departmental current spending (Core resource department expenditure limits or Core RDEL, not shown in the chart) which increased by £15bn, 12bn and £14bn respectively to £408bn in 2022-23, £422bn in 2023-24 and £441bn in 2024-25 to address the increasing demands being placed on health care as more people live longer and to address the social care crisis. 

While this extra current spending is to be funded by the new health and social care levy, there remain huge pressures on many other public services as well as concerns about the risks to tax receipts from an uncertain economic recovery. The temptation to raid capital budgets to top up current spending, as occurred in the years following the financial crisis, will be there. After all, the benefits of capital investment can often take many years to arrive, while the stresses experienced by public services are much more immediate. In addition, under government fiscal rules, capital expenditure counts towards reported expenditure (total managed expenditure or TME) and the public sector deficit, which perhaps makes it more difficult to treat investment for the long-term differently from day-to-day operating expenditure. 

Assuming the Chancellor sticks to the plan, then the big story of the Spending Review from a capital expenditure perspective will be in the allocation between departments. Transport (£18bn in 2021-22), Business, Energy & Industrial Strategy (£16bn) and Defence & Intelligence (£15bn) are the largest spenders, and each will be fighting hard for more money, especially Defence where governmental ambitions to be a ‘tier 1’ military power have always outstripped the amount of money supplied. Other departments likely to be seeking additional capital funding include the Department for Levelling Up, Housing and Communities on behalf of local authorities in England (£9bn in 2021-22) and the devolved administrations (together £9bn).

Will the Chancellor be able to steer a course through what appear to be some turbulent economic waters to deliver on the government’s infrastructure ambitions?

This chart was originally published by ICAEW.

ICAEW chart of the week: German federal budget 2022

As Germany heads to the polls this weekend to elect a new federal parliament, the topic of the public finances has moved to centre stage. Our chart this week looks at the federal budget for 2022 and the current plan to sharply reduce the deficit from 2023 onwards.

German federal budget 2022

2021: revenue €307bn + borrowing €240bn = expenditure €488bn + investment €59bn

2022: revenue €343bn + borrowing €100bn = expenditure €391bn + investment €52bn

2023: revenue €398bn + borrowing €5bn = expenditure €352bn + investment €51bn

2024: revenue €396bn + borrowing €12bn = expenditure €357bn + investment €51bn

2025: revenue €396bn + borrowing €12bn = expenditure €357bn + investment €51bn

Source: Bundesministerium der Finanzen: 'Draft 2022 federal budget and fiscal plan to 2025'

The coronavirus pandemic has been accompanied by relaxations in both European and German constitutional limitations on the size of the federal deficit for 2020, 2021 and 2022, with Chancellor Angela Merkel of the Union parties (the Christian Democratic Union (CDU) together with Bavaria’s Christian Social Union (CSU)) and Finance Minister and chancellor-candidate Olaf Scholtz of the Social Democratic Party (SPD) setting out a plan earlier this year to reduce federal borrowing significantly by 2023.

As the #icaewchartoftheweek illustrates, the plan is to continue to run a sizeable deficit of €100bn in 2022 with tax and other revenue of €343bn being offset by €391bn in expenditure and €52bn in investment spending. This is a smaller deficit than the €240bn forecast for the current year (revenue €307bn – expenditure €488bn – investment €59bn) and the €131bn recorded in 2020 (not shown in the chart: revenue €311bn – expenditure €392bn – investment €50bn), both of which contained significant amounts of emergency spending in response to the pandemic. 

The hope is that revenues will recover in 2023 to €398bn at the same time as expenditures and investment return to pre-pandemic levels of €352bn and €51bn respectively to leave only a €5bn shortfall to be covered by borrowing. The forecast deficit for both 2024 and 2025 is €12bn, comprising revenue of €396bn in both years, less expenditure of just under €396bn in 2024 and just over €396bn in 2025 and investment in both years of €51bn. It is important to note that this is the budget for the federal government only and excludes the share of joint taxes going to Germany’s states (Länder) as well as expenditures funded from state and local taxation.

The challenge for the three principal candidates for the chancellorship: Olaf Scholtz of the SPD, Armin Laschet of the Union parties and Annalena Baerbock of the Green party, is in how to make promises to spend more on their respective priorities while maintaining the low levels of borrowing required by the constitution outside of fiscal emergencies. 

Major flooding earlier this year has put climate change at the top of the electoral agenda, with the need to increase investment to achieve net zero a key theme of party platforms. Together with promises to invest more in infrastructure and the need to cover the cost of more people living longer, higher defence spending and other financial commitments, there are significant questions about whether the path to near-budget balance can be achieved. Given the economic uncertainty, the prospect of returning to the pre-pandemic policy of paying down government debt seems unlikely, although that policy helped reduce general government debt from a peak of 82% of GDP in 2010 following the financial crisis. Despite the additional borrowing because of the pandemic, general government debt is still below that level at somewhere in the region of 75% of GDP – putting Germany in a much better fiscal position than many of its European neighbours, including the UK.

One candidate to be the next finance minister is Christian Lindner of the liberal Free Democratic Party (FDP), a possible partner in either a ‘traffic-light coalition’ of SPD (red), Greens (green) and FDP (yellow) or a ‘Jamaica coalition’ of the Union parties (black), Greens (green) and FDP (yellow) although this will of course depend on how the parties perform in the election on Sunday 26 September. Alice Weidel and Tino Chrupalla, joint leaders of the hard-right Alternative for Germany (AfD), and Janine Wissler & Dietmar Bartch, joint leaders of the Left Party (Die Linke), are considered unlikely to find their way into the federal cabinet in most scenarios.

Unlike in the UK, where a new prime minister customarily takes up residence in 10 Downing Street the next day, there is unlikely to be an instant change in national leadership. Chancellor Angela Merkel and most of her existing Union/SPD ‘Grand coalition’ cabinet are likely to stay in caretaker positions for several weeks or potentially months as fresh coalition negotiations between the parties elected to the Bundestag are concluded.

This chart was originally published by ICAEW.

ICAEW chart of the week: School-age demographic change

This week’s chart illustrates how the number of 10 year-olds in the UK is expected to fall sharply over the rest of the decade, just as the number of 18 year-olds is expected to peak in 2030.

School-age children

10 year-olds

2022: 855,000
2023: 831,000
2024: 813,000 
2025: 807,000
2026: 808,000
2027: 783,000
2028: 759,000
2029: 730,000
2030: 702,000

18 year-olds

2022: 741,000 
2023: 752,000
2024: 781,000
2025: 797,000
2026: 824,000
2027: 817,000
2028: 826,000
2029: 841,000
2030: 855,000

The Office for National Statistics UK Population Estimate for July 2020 reports that there were 855,000 children in the cohort who will be 10 years old next year when most of them will be entering their final year of primary school. A falling birth rate since 2012 means that the numbers of 10-year-olds will fall by 18% over the following eight years to 702,000 in 2030, with a consequent drop in the number of primary school places that will be needed in the coming decade: 

  • 2022: 855,000 10 year-olds
  • 2023: 831,000
  • 2024: 813,000 
  • 2025: 807,000
  • 2026: 808,000
  • 2027: 783,000
  • 2028: 759,000
  • 2029: 730,000
  • 2030: 702,000

At the same time, the number of 18 year-olds will grow significantly reaching a peak in 2030 when that cohort of 855,000 will be 18, 15% more than the 741,000 of 18 year-olds in 2022. 

  • 2022: 741,000 18 year-olds 
  • 2023: 752,000
  • 2024: 781,000
  • 2025: 797,000
  • 2026: 824,000
  • 2027: 817,000
  • 2028: 826,000
  • 2029: 841,000
  • 2030: 855,000

The chart was prepared using the numbers of children estimated to be in the UK in 2020 adjusted for time growing up, but without adjustment for migration or the (fortunately) relatively small number of deaths that would be expected to occur over the course of the decade. 

Prior to Brexit and the pandemic, there was a net inflow of around 5,000 a year adding to each age group which, if repeated, would have the effect of reducing the rate of decline in 10 year-olds and increasing the size of the peak in 18 year-olds in 2030. However, with migration potentially having gone into reverse during the pandemic, it is unclear whether net immigration will be as high as it was before.

Either way, one of the first orders of business for new Education Secretary Nadhim Zahawi will be to review the plans to reduce primary school and expand secondary school provision over the next few years, as well as addressing the pressure there will be on universities, colleges and apprenticeships as the bulge of births in the mid-noughties flows through the education system over the coming decade.

This chart was originally published by ICAEW.