The #icaewchartoftheweek is on the Irish Government’s ‘no surprises’ Budget for 2020, which was announced to the Dáil yesterday by Paschal Donohoe T.D., the Minister for Finance and Public Expenditure and Reform.
Featuring no significant new tax or spending announcements, the main focus was on preparing for Brexit, with an additional €0.2bn allocated for staff, infrastructure and IT systems. There is also a Brexit contingency of €1.4bn, with €1.0bn earmarked to be used if there is a no deal Brexit and a further €0.4bn available in reserve, not including EU support.
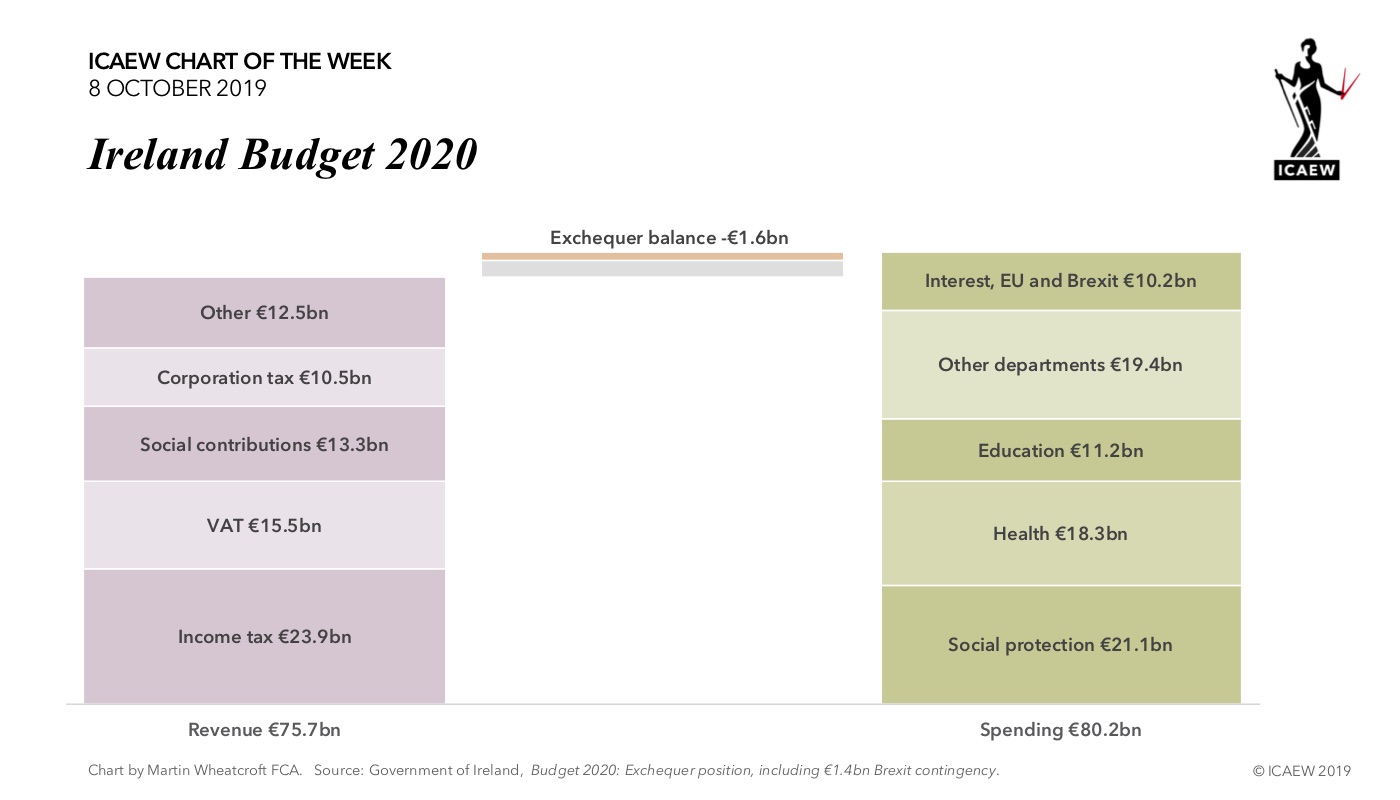
This is the main driver in increasing the exchequer (central government) balance from a forecast of -€1.0bn in 2019 to the -€1.6bn in 2020, reflecting revenue of €75.7bn less spending of €80.2bn, plus adjustments of €2.9bn.
Income tax (€23.9bn), VAT (€15.5bn), social contributions (€13.3bn) and corporation tax (€10.5bn) together provide 83% of central government revenue, with the remaining €12.5bn coming from excise duties (€5.9bn), stamp duties (€1.6bn), customs. duties (€1.2bn), capital gains tax (€1.0bn), motor tax (€0.9bn), capital acquisitions tax (€0.5bn) and non-tax revenue (€1.2bn).
Social protection (€21.9bn), health (€18.3bn) and education (€11.2bn) make up 73% of total voted expenditure of €70.0bn, with €19.4bn going to other departments, including housing, planning and local government (€4.3bn), justice (€3.0bn), transport (€2.7bn), agriculture (€1.6bn), children and youth services (€1.6bn), reform (€1.3bn), defence (€1.0bn) and business (€1.0bn).
Non-voted expenditure of €10.2bn includes debt interest of €4.8bn, EU contributions of €3.5bn and €1.4bn in Brexit contingency, together with other costs of €0.5bn.
Not shown are local government revenues and expenditures of €9.4bn and €9.9bn respectively, a net balance of -€0.5bn and €0.3bn higher than in 2019. The €0.9bn increase in negative central and local government balances combine with €0.3bn from non-commercial state bodies, €1.4bn from higher equity and loan transactions and other net movements of €0.1bn to turn an expected general government surplus in 2019 of €0.7bn to a deficit of -€2.0bn (also not shown).
Despite the deficit, the Irish Government expects to reduce general government gross debt from €203.6bn at the end of 2019 to €198.5bn at the end of 2020, equivalent to 97.4% of gross national income (GNI) and 56.5% of gross domestic product (GDP).
While the Budget 2020 lived up to its description of having no surprises and addressing the ‘known knowns’ of Brexit, the bigger worry for the Irish Government will be the ‘known unknowns’ of a potential global downturn, trade wars and a potentially even more damaging Brexit than anticipated, even before considering any ‘unknown unknowns’.