Ideas on fiscal devolution clash as economic progress stalls

Gordon Brown’s constitutional commission calls for greater fiscal devolution, going much further than the government’s gradual rollout of levelling-up devolution deals.

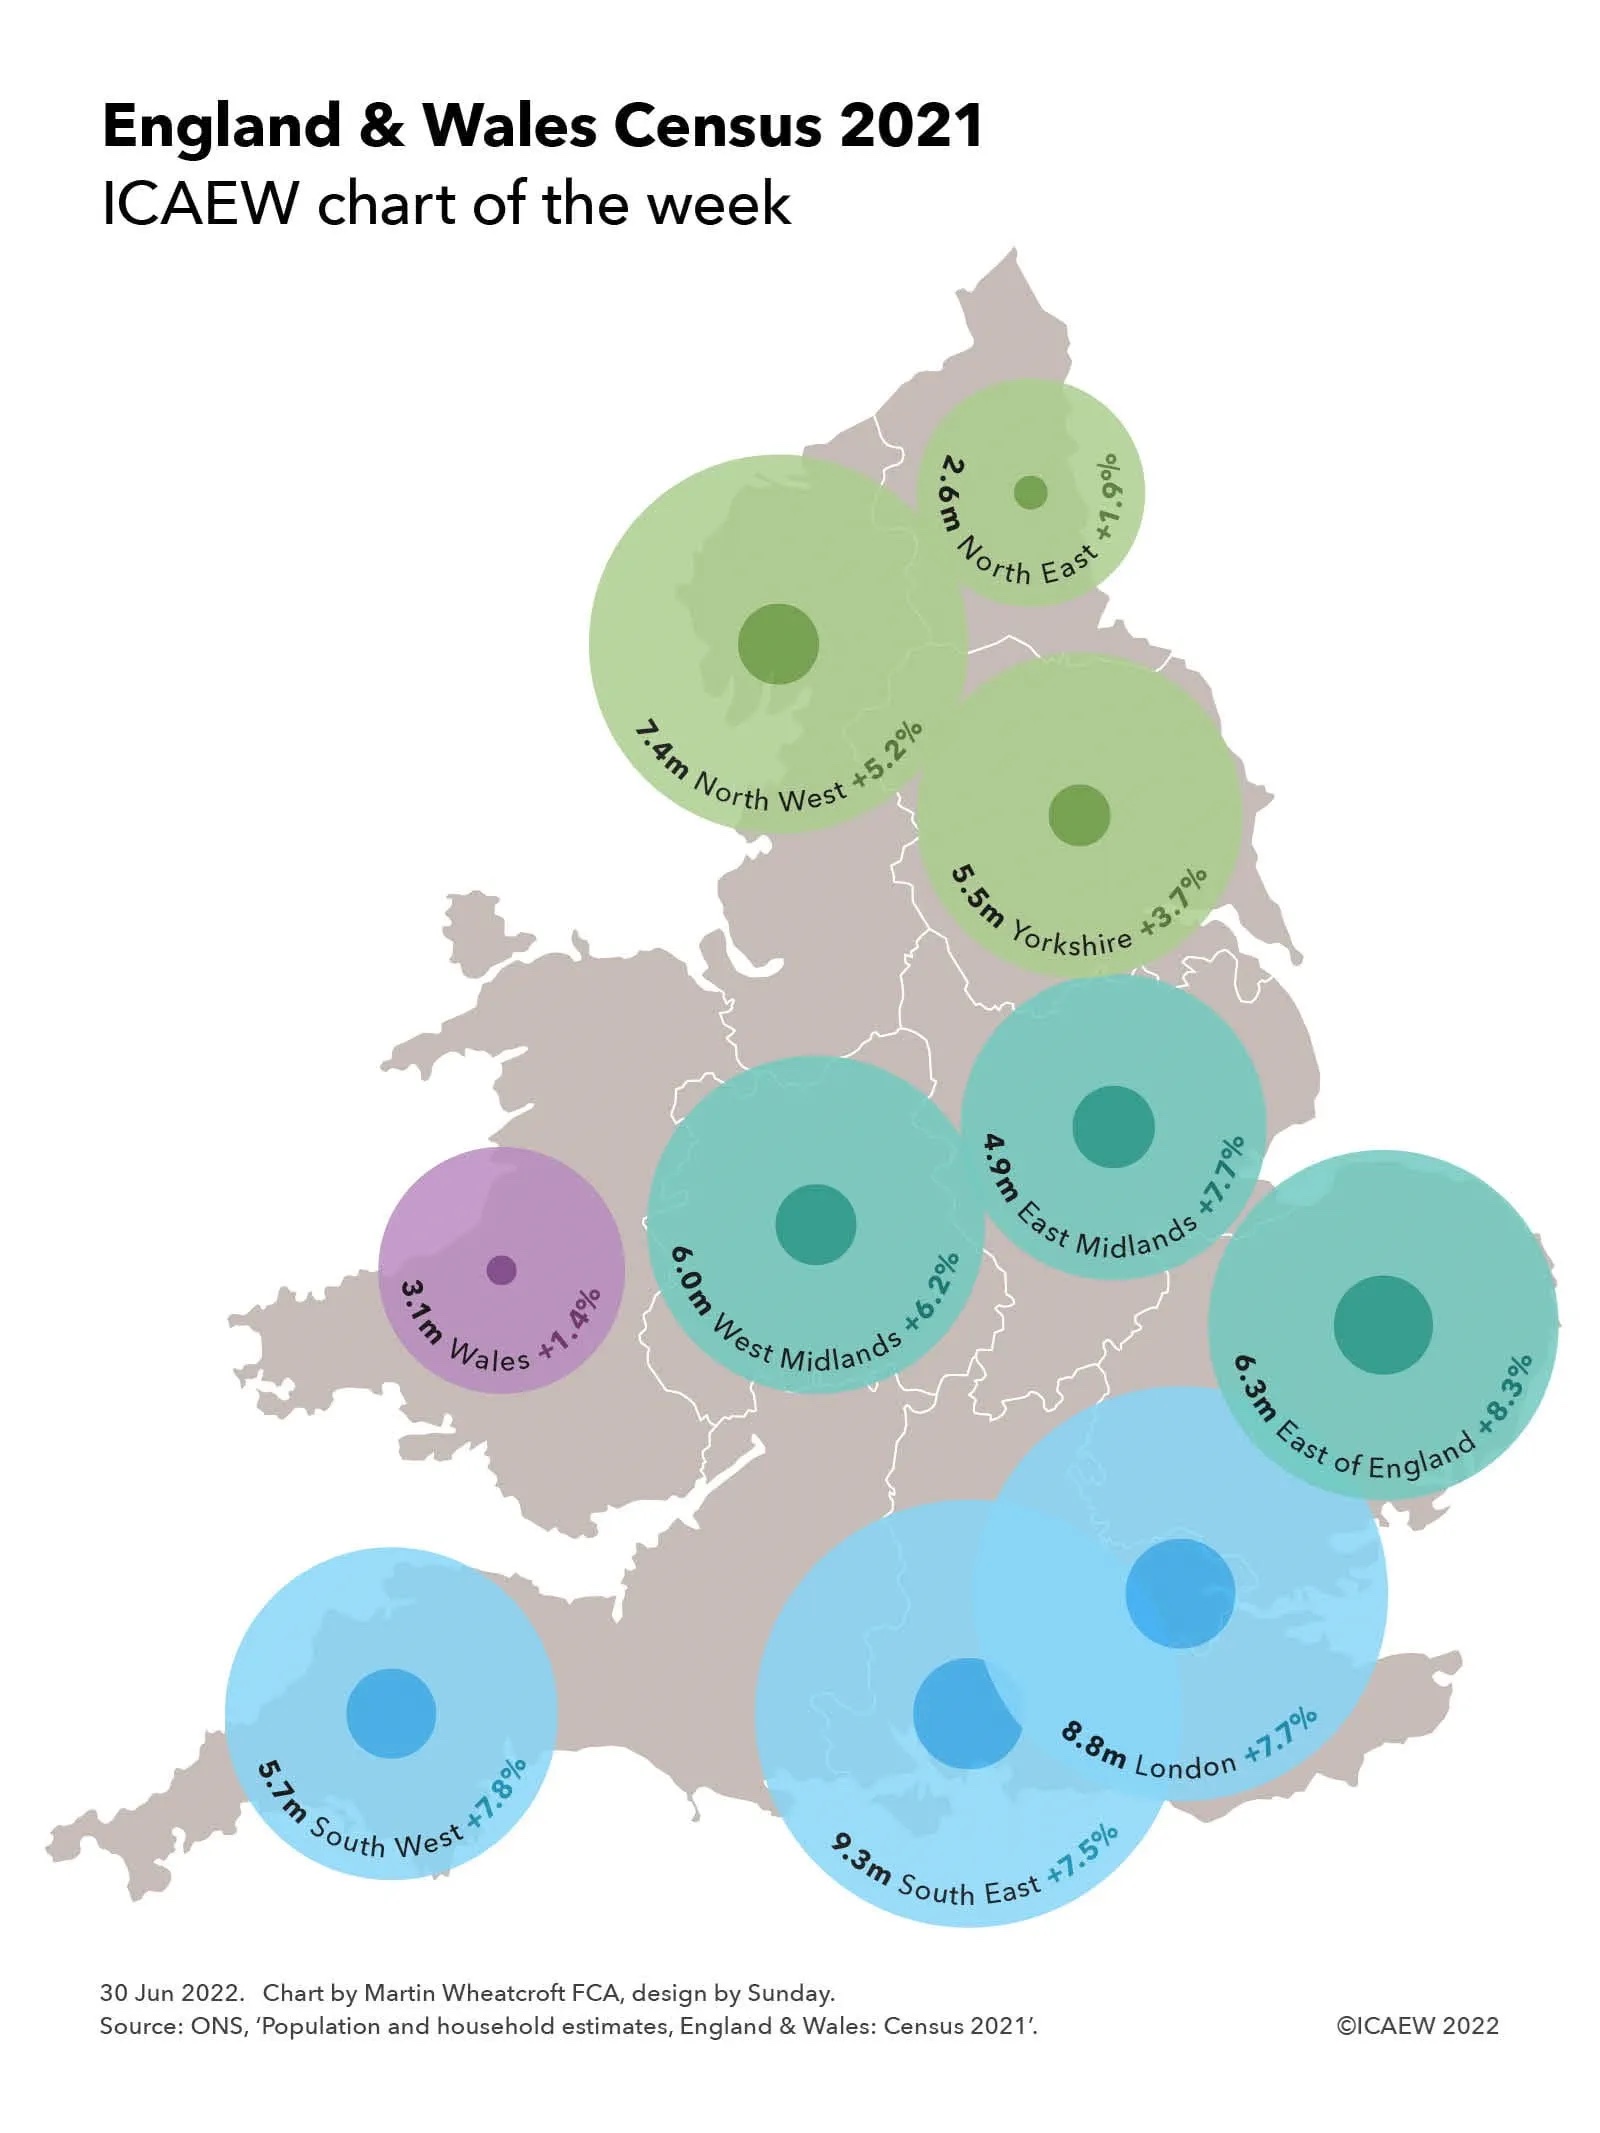
There appears to be a growing belief among policymakers across the political spectrum that regional and local authorities need greater financial powers if economic outcomes are to be improved across the UK. However, while there appears to be some consensus around extending the fiscal powers of the devolved administrations in Wales, Scotland and Northern Ireland, there is much less agreement on how far to go in devolving financial powers for the 84% of the UK’s population that live in England.

Levelling-up ‘devolution deals’ cover almost half of England

The government has adopted a gradualist approach to fiscal devolution that has principally revolved around ‘devolution deals’, part of its wider Levelling Up agenda to spread prosperity across England outside London and the South East. These deals generally provide an agreed stream of investment funding over several decades, greater control over the adult education and transport budgets, and some additional powers (eg, over second homes in Cornwall), in exchange for agreeing to direct elections for combined authority mayors or county leaders.

Regional devolution deals were announced in 2022 for the North EastYork and North Yorkshire, and the East Midlands, together with county devolution deals for SuffolkNorfolk and Cornwall. The government is also working on ‘trailblazer’ devolution deals along similar lines with existing city-regions, starting with Greater Manchester and the West Midlands combined authorities.

The devolution deals do not provide any additional tax-raising powers for regional combined authorities or local authorities, and the majority of local government funding in England continues to be determined by central government. It is also unclear whether the government will attempt to extend the coverage of devolution deals across the rest of England beyond the existing areas covered and the Devon and East Yorkshire deals that are still being negotiated.

Gordon Brown constitutional commission

The Labour Party has also been thinking about devolution as part of a wider debate on the UK constitution, with a review led by former Prime Minister Gordon Brown into the UK’s constitution. While many of the headlines about the review focused on reform of the House of Lords, most of the report focused on devolution and intergovernmental cooperation, including the role played by English regions. This included recommending greater long-term financial certainty and new fiscal powers for local government in England, in addition to deepening the devolution settlements in Scotland, Wales and Northern Ireland.

Several of the Gordon Brown commission’s proposals align with recommendations made by ICAEW to HM Treasury at the time of the last Spending Review. ICAEW called for stable funding for local authorities, rationalisation of funding streams, investment in fiscal resilience and strengthening financial management.

At the same time as advocating for greater fiscal flexibility for local government, the review stresses the need for scrutiny and accountability to ensure money is spent wisely. One option might be for the proposed Office for Value for Money to expand to cover local government, further developing the ideas put forward in a Fabian Society report, Prizing the Public Pound, produced in collaboration with ICAEW. Other ideas include the piloting of local public accounts committees.

Although clear in the reforms to the UK’s constitutional arrangements that the review would like to see, the report lacks detail on how it intends to achieve its proposals – for example in identifying individual taxes that could be devolved to regional and local authorities. 

The report is ambitious in aiming to implement reforms within just one parliamentary term, meaning there will be a lot of work and consultation required to design the new arrangements, establish public support and then develop and pass the necessary legislation.

Fabian Society-ICAEW round table 

A joint Fabian Society-ICAEW round table last year explored some of the practical challenges involved in devolving fiscal powers to regional and local government in England. The group, which included members and contributors to the Gordon Brown commission, looked at the proposed trailblazer deals being negotiated by Greater Manchester and the West Midlands combined authorities, as well as existing ideas that have been put forward for devolved taxes, such as on tourism.

The participants discussed how existing disparities in tax bases between different parts of the country meant some form of redistribution or central government funding was still likely to be needed, as illustrated by the cities of Westminster and Hull that each serve populations of around 250,000 or so, but which have very different levels of prosperity and hence local tax capacity. 

The approach adopted in Germany of shared national taxes was also discussed, a key element in how regional governments (Länder) are funded. This is further explored in a separate Fabian Society report: Levelling Up? Lessons from Germany.

While there were a variety of views around the funding mechanisms that could be used to pay for local public services, there was general agreement on the need to rationalise funding streams, for long-term funding certainty to enable local authorities to plan ahead, and an end to the process of submitting multiple bids to central government for incremental funding.

Martin Wheatcroft FCA, external adviser on public finances to ICAEW, commented: “While there appears to be an emerging political consensus on the need to devolve much greater fiscal powers to regional and local tiers of government in England, the proposals so far have been relatively limited in their ambition.

“This may be because national politicians find it difficult to let go of the purse strings, but it is also the case that delivering fiscal devolution is not that easy in practice. Economic disparities between different places mean that needs are often greater in areas with less in the way of tax-generating ability, while redistributive mechanisms are challenging to design in a way that all parties deem to be fair. This is not helped by a patchwork quilt of differing regional and local government structures that would make it difficult to implement a single standardised model for funding local public services across England.”

This article was originally published by ICAEW.

ICAEW chart of the week: England and Wales Census 2021

The ICAEW chart of the week looks at the results of last year’s census, illustrating how the population of southern and central England has grown much faster than in the north of England and in Wales over the past decade.

Bubble chart overlayed on a map of England & Wales scaled to population in each region with inner bubbles showing the increase in the last decade. 

North East 2.6m (+1.9%)
North West 7.4m (+5.2%)
Yorkshire 5.5m (+3.7%)

West Midlands 6.0m (+6.2%)
East Midlands 4.9m (+7.7%)
East of England 6.3m (+8.3%)

South West 5.7m (+7.8%)
South East 9.3m (+7.5%)
London 8.8m (+7.7%)

Wales 3.1m (+1.4%)

The Office for National Statistics (ONS) released the first results from Census 2021 in England and Wales on Tuesday 28 June, providing an initial snapshot of who we are and where we live across two of the four nations of the UK. It follows on from the initial release earlier this year of the Northern Ireland Census 2021, but we won’t see a full picture for the UK for some time as the 2022 census in Scotland was delayed until this year.

The chart highlights how the East of England was the fastest growing region in England, with its population growing by 8.3% to 6.3m between 2011 and 2021. This was followed by the South West (up 7.8% to 5.7m), London (up 7.7% to 8.8m), East Midlands (up 7.7% to 4.9m) and the South East (up 7.5% to 9.3m). The West Midlands grew less quickly (up 6.2% to 6.0m), but still by more than the North West (up 5.2% to 7.4m), Yorkshire (up 3.7% to 5.5m) and the North East (up 1.9% to 2.6m). The population of Wales only increased by 1.4% over 10 years to remain at 3.1m.

In total the population of England and Wales amounted to 59.6m in 2021. This was 6.3% higher than the 56.1m people living in the UK in 2011 and 14.6% higher than the 52.0m reported by the 2001 census. This reflects a slowing rate of growth in the last decade at 0.6% a year on average compared with the average rate of 0.8% seen between 2001 and 2011 and is substantially lower than the compound growth of 1.6% a year experienced over 120 years since the first official census in 1801 reported a population of 8.9m in England & Wales.

The ONS has published a breakdown of the population by age and sex by local authority, highlighting how the number of people has changed significantly in some parts of the country, such as Tower Hamlets (up 22% in 10 years), Dartford (up 20%), Barking and Dagenham (up 18%), Bedford (up 18%), Peterborough (up 17.5%), Central Bedfordshire and Tewkesbury (each up 16%) and Salford, Milton Keynes, Uttlesford, Vale of White Horse and Wokingham (each up by around 15%). The biggest falls were in Kensington and Chelsea (down 10%) and Westminster (down 7%), although there is some speculation that this was because of the pandemic as family and second homes elsewhere proved to be more attractive places to work from home during lockdown. This is unlikely to be the driver of decreases in some rural areas such as the 6% fall in Ceredigion in Wales or the 5% fall in Copeland in Cumbria, where long-term trends of population decline have continued.

The census has also confirmed how we are getting older on average, with a 20% increase in those aged 65 and over from 9.2m in 2011 to 11.1m in 2021. This continues to be a big driver for public finances, as more funding is needed to pay for pensions, health and social care at the expense of other public services.

There is still a lot of data crunching to do as the statisticians work through the more in-depth questions on the census, ranging from employment status, education and housing to ethnicity, religion, sexual orientation and gender identity among other characteristics – demographics in action and the likely source of future charts of the week.

This chart was originally published by ICAEW.

ICAEW chart of the week: GCSE maths grade inflation

Our chart this week looks at the grade inflation challenge facing 16-year-olds across England as they study for their forthcoming GCSEs in the third year of the pandemic.

Chart showing GCSE results by grade for 2018, 2019, 2020 and 2021 respectively.

2018 – U (2.4%), grades 1-3 (5.4%, 8.8%, 12.7%), grades 4-6 (20.3%, 18.5%, 11.8%), grades 7-9 (9.5%, 6.9%, 3.7%)

2019 – U (2.3%), grades 1-3 (5.3%, 8.5%, 12.6%), grades 4-6 (21.1%, 18.2%, 11.4%), grades 7-9 (9.6%, 7.2%, 3.8%)

2020 – U (0.7%), grades 1-3 (4.0%, 7.3%, 11.1%), grades 4-6 (19.6%, 20.1%, 12.9%), grades 7-9 (11.0%, 7.9%, 5.4%)

2021 – U (1.1%), grades 1-3 (4.3%, 7.0%, 9.9%), grades 4-6 (18.7%, 20.3%, 12.7%), grades 7-9 (11.4%, 8.6%, 6.0%)

The ICAEW chart of the week is on the results of the General Certificate of General Education (GCSE) in mathematics for the past four years in England according to the Department for Education (DfE), illustrating how a burst of grade inflation in the pandemic poses challenges for both students and their examiners in the reinstated examinations this summer.

Maths is one of the core exam subjects taken by almost all 16-year-olds in England, with passes at grade 4 or above in both maths and English being a base requirement for most students wanting to progress onto GCSE Advanced (A level) courses and to university or a degree apprenticeship after that. It is also a prerequisite for many vocational qualifications, where good numeracy skills are often essential. 

The current grading system was adopted in 2017, with results now split into nine grades, which can be grouped into three categories of three grades each: below standard (1-3), good performance (4-6) and high performance (7-9). The four former grades of G, F, E and D were condensed into three (grades 1-3), while the old passing grade of C and the next level up of B were expanded to three, being 4 (pass), 5 (strong pass) and 6. The former high performance grades of A and A* were replaced by grades 7, 8 and 9, providing even more granularity at the top end.

The chart illustrates how before the pandemic the results in 2018 and 2019 were similar with 2.4% and 2.3% ungraded ‘U’ results respectively (which includes those who failed to turn up or who withdrew after entering), with respectively 26.9% and 26.4% of students receiving below standard grades (1-3), 50.6% and 50.7% received good performance grades (4-6), and 20.1% and 20.6% received high performance grades (7-9).

The debacle of the cancelled school examinations and regraded results in 2020, and the deliberate decision in 2021 to adopt teacher-assessed grades instead of exams, saw a significant rise in the number of higher grades awarded. There were fewer ungraded results (0.7% in 2020 and 1.1% in 2021), fewer below standard awards (22.4% and 21.2% respectively), more good performance grades (52.6% and 51.7%) and a great deal more high performance grades (24.3% and 26.0%). There was a big jump in the very top award, the so-called A**, with 6.0% of students receiving grade 9 in 2021 compared with 3.7% in 2018.

The percentage of each grade awarded by year were as follows:

2018 – U (2.4%), grades 1-3 (5.4%, 8.8%, 12.7%), grades 4-6 (20.3%, 18.5%, 11.8%), grades 7-9 (9.5%, 6.9%, 3.7%) – 535,312 entrants

2019 – U (2.3%), grades 1-3 (5.3%, 8.5%, 12.6%), grades 4-6 (21.1%, 18.2%, 11.4%), grades 7-9 (9.6%, 7.2%, 3.8%) – 554,598 entrants

2020 – U (0.7%), grades 1-3 (4.0%, 7.3%, 11.1%), grades 4-6 (19.6%, 20.1%, 12.9%), grades 7-9 (11.0%, 7.9%, 5.4%) – 571,624 entrants

2021 – U (1.1%), grades 1-3 (4.3%, 7.0%, 9.9%), grades 4-6 (18.7%, 20.3%, 12.7%), grades 7-9 (11.4%, 8.6%, 6.0%) – 584,933 entrants

The Office of Qualifications and Examinations Regulation (Ofqual), which regulates qualifications, examinations and assessments in England, has expressed a desire to return to a pre-pandemic grade profile but has acknowledged that the current cohort of GCSE students have experienced significant disruption to their education over the past two years. As a consequence, they believe it would be unfair to revert back to the previous level awards in one go and have said that they will set grade boundaries around the mid-point between the 2019 and 2021 results, subject to the normal process of moderation. 

This may seem unfair to students who can expect to be rewarded with less generous marks than their immediate predecessors given the difficulties being experienced in many schools over the past two years as they have studied for their GCSEs. There have been frequent closures and class disruptions as the coronavirus has and continues to propagate around the country. But Ofqual and the examiners are keen to avoid the grade inflation experienced over the last two years of teacher-assessed grades becoming embedded, a real prospect if they were to wait another year or two before attempting to bring grades back down towards pre-pandemic levels.

The experience of the last two years is that the ability of Ofqual and the DfE to deliver their plan will depend on events, so we will need to wait to see how well the process of sitting exams goes and how the results when they are announced are viewed by the court of public opinion.

In the meantime, we wish all the best of success to all those studying for their GCSEs this summer in England, as well as to their compatriots sitting equivalent exams in Wales, Scotland and Northern Ireland.

Local authorities need to invest in finance teams

Alison Ring, ICAEW director for public sector, tells Room 151 that local audit reform is not enough on its own.

Alison Ring, ICAEW director for public sector, recently contributed an article to Room 151, an online news, opinion and resource service for local authority section 151 and other senior officers.

Reforms mean local government will soon see a new audit regulator, but investing in local government finance teams and better reporting are priorities too.

The government’s decision to set up a dedicated local audit unit within the new Audit, Reporting and Governance Authority (ARGA) addresses one of the key recommendations of the Redmond Review – that there be a ‘system leader’ for local audit, bringing together many of the different aspects of audit regulation currently dispersed across a variety of bodies, including ICAEW.

Nevertheless, ARGA has a big challenge on its hands.

Problems

The National Audit Office reported recently that 55% of local authorities in England missed the deadline to obtain an audit opinion on their 2019-20 financial statements, despite an extension of four months to take account of the pandemic. While there were significant practical issues facing both local authority finance teams and audit firms that contributed to these delays, they are symptomatic of wider problems in the local audit market and in the preparation of local authority financial statements.

Local audit in England relies on a small pool of eight firms to audit hundreds of NHS trusts and local authorities within a short time frame each year. Audit firms struggle to find sufficient qualified and experienced individuals to deliver local authority audits, an issue that will only grow as the existing cohort of experienced auditors approaches retirement over the coming decade.

Even with the additional £15m in funding provided this year by the government, audit firms highlight how the risk profile of many councils has increased in recent years as reserves have declined and balance sheets have weakened, with many councils borrowing to invest in commercial activities. The impact of the coronavirus pandemic has damaged the financial position of councils even further.

At the same time, more intensive regulation has – quite rightly – put pressure on audit teams to improve the quality of their work, but that has cost implications too, with firms expressing concern about the viability of their local audit practices. There is a real risk that one, or more, firms could withdraw from the market, reducing competition and putting even more pressure on the remaining firms.

There are also significant barriers to entry, starting with a requirement for audit partners to qualify as a key audit partner in addition to being a registered auditor, a requirement specific to the local audit market and not applicable to other sectors requiring equal or much greater sector-specific knowledge and expertise.

This is an obstacle to new firms considering bidding for local audit contracts, even where they have audit partners with experience that would make them eligible to apply and the ability to train and recruit staff with the necessary capabilities. The limited number of key audit partners in each individual firm also makes it more difficult to manage multiple audits within the short time frames needed to achieve audit deadlines.

Stabilising the local audit market and working with the government to ensure there is a viable pool of expertise available to carry out quality audits will be one of the first items on the ARGA agenda.

Priorities

However, audit reform is only part of the story. There is also a need to invest in local authority finance teams and in making the local authority finance profession an attractive career choice. Local authorities need to place a higher priority on the importance of producing high-quality financial statements that meet best practice and how doing so can increase financial understanding among both officers and councillors. Success in this area would also benefit local taxpayers’ understanding of and ability to scrutinise spending decisions, improving accountability and transparency.

There also needs to be investment in the quality of the underlying financial records and the supporting working papers provided to external auditors – a cause of delays in some audits. Not as sexy as many of the budget proposals that go to councillors for approval, but we know that poor financial controls and a lack of financial understanding by decision-makers and those to whom they are accountable can cost a lot more in the long run.

Unfortunately, far too many local authorities appear to treat their annual financial statements and the audit as a compliance exercise, something to be ‘got through’ rather than an opportunity to give a full account of how well they have stewarded public resources on behalf of residents.

Poorly formatted and difficult to read, too many council financial reports and accounts are seemingly designed for depositing in the round filing cabinet, rather than taking their place alongside flagship reports. Such reports are often of much less importance and priority than the hundreds of millions of pounds of public money spent on delivering local services or, in some cases, that have been wagered in speculative commercial investments.

I believe that the new regulator will need to look beyond the audit firms and engage with local authorities and their finance teams to demand and encourage improvements. Although audit firms can, and do, insist on changes to financial statements where they fail to comply with accounting standards or are actively misleading, they can’t insist local authorities follow best practice or that they invest in making the financial statements understandable to elected representatives and to the public. There is a role for the new regulator to bring up reporting quality across the sector.

It is important to realise that the proposed new standardised statement of service information and costs won’t be enough on its own. Readers need to be able to understand the wider financial position of each local authority, such as the level of usable reserves and balance sheet risks—and that requires investment in the entire annual report and accounts to make the financial information presented more understandable.

High standard

The overall package of reforms is positive: a new system leader for local audit and a rationalisation of the regulatory environment; a new audited statement of service information and costs to enable budgets and spending to be compared; a review of audit requirements for smaller bodies; auditors to provide an annual report to full council; an independent member with financial expertise on council audit committees; and a willingness to look again at audit deadlines.

But we should not forget that external audit comes at the end of the process and that solving the problems in the local audit market will only go so far.

Ultimately these reforms will only be successful if the financial statements subject to audit are of a high standard in the first place. That means greater investment in finance teams and—most importantly—council leaders and officers placing a higher priority on the quality and understandability of the financial information they produce.

This article was originally published in Room 151, an online news, opinion and resource service for local authority section 151 and other senior officers covering treasury, strategic finance, funding, resources and risk, and subsequently published by ICAEW.

ICAEW chart of the week: Local government in England

9 October 2020: The complex structure of regional and local authorities in England is just begging for reform, but will the rumoured plan to abolish county and district councils fix it for good?

Chart with three rings: regional tier, county or unitary tier and then district council tier, showing lots and lots of councils in England.

Local government in England, as illustrated by the #icaewchartoftheweek, is pretty complex with eight different types of regional or principal authority and a patchwork quilt of different tiers of government across the country.

This complex system comprises areas without a regional tier of government involving unitary authorities or county & district councils, and those with combined authorities atop unitary authorities or metropolitan boroughs (and one county and its districts) and the Greater London Authority atop 32 London boroughs and the City of London. (This excludes the 9,000 or so town, village and other forms of parish councils in England, mostly outside the major urban areas).

This complexity makes it very difficult for the Government to interact with local authorities in the absence of a consistent model of local government or a country-wide regional tier of government to act as intermediary. This contrasts (for example) with the federal system in Germany, where Chancellor Angela Merkel regularly speaks to the leaders of the 16 German states, who in turn deal with the local authorities in their areas. Similarly (although not formally federal), France has 13 mainland and 5 overseas regional administrations that President Emmanuel Macron and Prime Minister Jean Castex can talk to and who will deal with their constituent provinces.

The UK Government can and does communicate with London Mayor Sadiq Khan, Greater Manchester Mayor Andy Burnham, West Midlands Mayor Andy Street, West Yorkshire Chair Susan Hinchcliffe, Liverpool City Region Mayor Steve Rotherham, Sheffield City Region Mayor Dan Jarvis, North East Chair Iain Malcolm, West of England Mayor Tim Bowles, Cambridgeshire & Peterborough Mayor James Palmer, North of Tyne Mayor Jamie Driscoll and Tees Valley Mayor Ben Houchen, each of whom can represent their constituent local authorities. But, they only represent 44% of the English population, with a further 24 county council leaders and 46 unitary authority leaders to speak to cover the remaining 56%. That is a pretty big Zoom call, assuming borough and unitary leaders within the regional authority areas don’t also insist on joining in.

The delayed announcement of a plan to abolish the 25 county and 188 district councils and replace them with between 25 and 40 new unitary authorities (perhaps with some mergers with existing unitary authorities) will go some way to rationalising the existing system by going to a single tier of principal local authorities. This would bring local public services together under one roof and save money, albeit there are some concerns about whether some of the new authorities would be too remote from the local citizenry.

However, this is still likely to leave English local government reform unfinished with over half the country without a regional tier of government. Will the Government want to continue with its existing organic approach of combined authority formation or go for a more comprehensive programme to establish regional authorities across the whole country, similar to the French reforms of the 1980s?

This chart was originally published by ICAEW.

New funding package for English local authorities

2 July 2020: Secretary of State Robert Jenrick has announced a new £2bn package for English councils to replace lost income and cover spending pressures.

The government has announced additional funding for local authorities in England to help alleviate the financial pressures they are under. This follows on from our previous article on council funding pressures, which reported that total lost income and additional expenditure could amount to £9.4bn by next March.

The funding package announced today comprises £500m to cover incremental expenditures being incurred by councils – adding to the £3.2bn already provided – together with a reimbursement scheme covering up to 71% of lost income from sales, fees and charges.

The reimbursement scheme kicks in where losses are more than 5% of a council’s planned income from sales, fees and charges. The government will cover 75% of the lost income above 5%, meaning that councils will need to cover around 29% of the shortfall from their own resources. Depending on the final details, councils could receive somewhere in the order of £1.5bn and £2bn to replace lost income.

The Ministry of Housing, Communities & Local Government (MHCLG) also announced that councils would be able to phase repayments of council tax and business rates deficits over three years rather than one, reducing cashflow pressures on councils. However, the apportionment of irrecoverable council taxes and business rates will not be decided until the Spending Review in the autumn.

This announcement should significantly reduce the risk of councils needing to issue s114 ‘bankruptcy’ notices – for the next few months at least.

Commenting on the announcement Alison Ring, ICAEW Public Sector Director, said: “Although the new funding won’t cover all the expenditure and lost income councils have suffered due to coronavirus, it should be enough to help most get through the rest of the summer, and the prospects of some having to declare themselves bankrupt with s114 notices should recede for now. 

However, we’re concerned that councils will still have to cut back spending to cover the lost income from areas such as car parking, leisure centres, planning fees and other charges that are not being covered by central government. This has the potential to damage local economies just as they are trying to recover.”

This article was originally published by ICAEW.

Local authorities running out of money as COVID costs mount

2 July 2020: English councils have warned that £6bn more funding may be needed to keep operating through the rest of the financial year.

Data collected by the Ministry for Housing, Communities & Local Government (MHCLG) from 339 local authorities in England indicates that councils expect lost income and additional expenditure as a consequence of the coronavirus pandemic to amount to a total of £9.4bn.

Many councils are warning that they may not be able to continue operating without further infusions of cash from central government. Although £3.2bn has been provided by central government to date, this has only covered lost income and additional expenditure incurred up to the end of May 2020, with councils forecasting a further impact of £6.2bn over the remainder of the financial year.

Table 1 – English local authorities: financial impact of the coronavirus pandemic

 March
2020
£bn
April & May
2020
£bn
Forecast to
March 2023
£bn

Total
£bn
Lost income  0.17 1.82 3.70 5.69
Additional expenditure 0.08 1.17 2.46 3.71
Total covid-19 impact 0.25 2.99 6.16 9.40

Source: Ministry of Housing, Communities & Local Government, ‘Local authority COVID-19 financial impact monitoring information’.

Lost income is expected to reach in order of £5.7bn overall, while additional expenses are forecast to reach around £3.7bn. Further detail is provided in Table 2 and Table 3 below. 

With no additional funding as yet forthcoming, councils have been using their reserves to cover shortfalls during June. A number of local authorities are now discussing the possibility that that they may have to issue s114 ‘bankruptcy’ notices, which would require them to freeze all non-statutory expenditures, severely affecting local services.

The Chancellor is expected to announce further financial measures when he updates the nation next week and councils are hoping this will include more funding from central government in line with the encouragement they received at the outset of the lockdown to “do whatever it takes”.

Alison Ring, director for public sector at ICAEW, commented: “These numbers from English local authorities highlight just how severe the financial impact of the coronavirus pandemic has been. The £3.2bn in additional funding from central government announced so far is only a third of the estimated total of £9.4bn in lost income and additional expenditure expected to be incurred.

There is a risk that without clarity on further funding that some councils will start issuing s114 ‘bankruptcy’ notices. This would significantly reduce spending by local authorities at the same time that local economies need every bit of help they can get if they are to fully recover.”

Table 2 – English local authorities: lost income

 March 2020
£bn
April & May 2020
£bn
Forecast to
March 2021
£bn

Total
£bn
Business rates  0.03 0.44 0.72 1.19
Council tax 0.02 0.48 1.21 1.71
Sales fees and charges 0.08 0.65 1.15 1.88
Commercial income 0.03 0.17 0.45 0.65
Other 0.01 0.08 0.17 0.26
Lost income 0.17 1.82 3.70 5.69

Source: Ministry of Housing, Communities & Local Government, ‘Local authority COVID-19 financial impact monitoring information’.

Table 3 – English local authorities: additional expenditure

 March
2020
£bn
April & May 2020
£bn
Forecast to
March 2021
£bn

Total
£bn
Adult social care  0.03 0.50 0.97 0.50
Children’s social care 0.00 0.08 0.22 0.30
Housing (excluding HRA) 0.01 0.06 0.12 0.19
Environment and regulatory services 0.01 0.09 0.11 0.21
Finance & corporate services 0.01 0.08 0.11 0.20
Other service areas 0.02 0.36 0.93 1.31
Additional expenditure 0.08 1.17 2.46 3.71

Source: Ministry of Housing, Communities & Local Government, ‘Local authority COVID-19 financial impact monitoring information’.

This article was originally published by ICAEW.