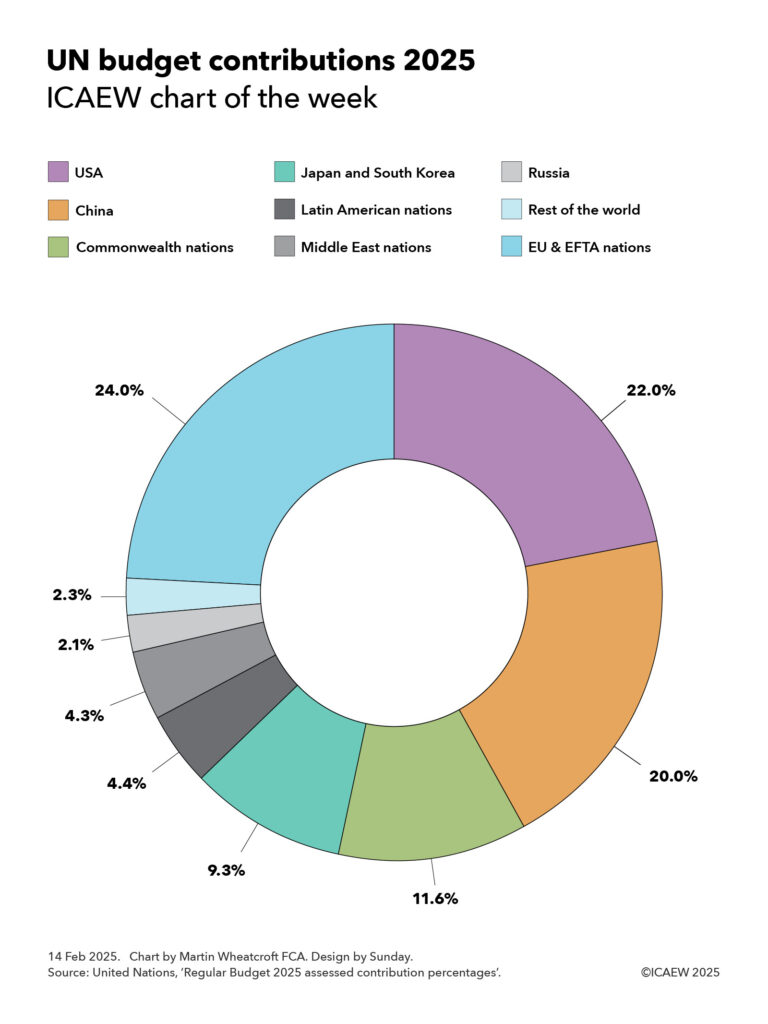
My chart for ICAEW this week looks at the assessed contributions of member states to the United Nations Regular Budget for 2025.

The United Nations is funded through a mix of assessed contributions from member states, voluntary contributions from both member states and others, and revenue generated from operations.
In 2023, total revenue for all UN entities comprised $67.6bn, of which $13.8bn was from assessed contributions, $46.8bn from voluntary contributions ($41.0bn earmarked and $5.8bn non-earmarked), and $7.0bn in revenue from operations.
Of the $13.8bn in assessed contributions from member states, $3.3bn in 2023 was for the core activities of the UN itself and our chart this week illustrates the assessed contribution percentages for 2025 for the $3.4bn UN Regular Budget set for 2025.
This highlights how European Union (EU) and European Free Trade Area (EFTA) nations have been assessed to pay 24.0% of the core budget in 2025, followed by the USA (22.0%), China (20.0%), Commonwealth nations (11.6%), Japan and South Korea (9.3%), Latin American nations (4.4%), Middle East nations (4.3%), Russia (2.1%), and the rest of the world (2.3%).
EU and EFTA national contributions are led by Germany (5.7%), France (3.9%), Italy (2.8%), Spain (1.9%), Netherlands (1.3%), Switzerland (1.0%), Poland (0.8%), Sweden (0.8%), Belgium (0.8%), Norway (0.7%), Austria (0.6%), Denmark (0.5%) and Ireland (0.5%). The remaining 18 EU and EFTA members (and three microstates) are expected to contribute a further 2.7% in 2025.
Of the Commonwealth nations, the UK (4.0%), Canada (2.5%), Australia (2.0%), India (1.1%) and Singapore (0.5%) contributed the most, with the remaining 49 members not including Cyprus and Malta (who are included in the EU in this chart) contributing a further 1.5%.
Japan (6.9%) and Korea (2.4%) are assessed to contribute 9.3% between them, while Latin American nations are down to contribute 4.4%, led by Brazil (1.4%), Mexico (1.1%) and Argentina (0.5%) with 1.4% coming from the rest.
Middle East countries are expected to contribute 4.3% between them, with Saudi Arabia (1.2%), Türkiye (0.7%), Israel (0.6%) and UAE (0.6%) being the largest. Another 11 Middle Eastern nations are down to contribute a further 1.2%.
Russia has been assessed to contribute 2.1%, while countries in the rest of the world are expected to put in a further 2.3%, of which Indonesia (0.6%) is the only one to contribute more than half a percent of the total assessment, with the remaining 68 member states collectively contributing a further 1.7% in total.
The assessed contributions for UN agencies and other activities vary from the percentages shown in the chart as they depend on which countries participate in each agency or activity and several other factors. For example, the US has been assessed to pay 26.2% of the UN peacekeeping budget in 2025 (higher than their 22% regular budget contribution), although the US is expected to pay only 25% because of a cap of 25% set by Congress. The UK and France are expected to pay 4.7% and 4.6% respectively (higher than their 4.0% and 3.9% regular budget contributions), while China has been assessed to pay 18.7% (lower than its 20.0% regular budget contribution).
Another example is the World Trade Organisation (WTO) where the US and China are assessed to contribute 11.4% and 11.2% respectively and most other nations contribute a larger share.
One big question for the UN in 2025 will be the extent to which the new US administration reduces the amount it pays to the UN compared with previous years. The total paid by the US was $13bn in 2023, comprising $3.2bn in assessed contributions and $9.7bn in voluntary contributions.
In theory, if the US leaves a UN agency, such as already announced departures from the World Health Organisation and the UN Human Rights Council, then the assessed contributions for the remaining members can be increased to compensate.
The White House has also announced that it is reviewing its membership of the UN Educational, Scientific and Cultural Organisation and that it will withhold a proportionate share of its regular budget contribution that goes towards the UN Relief and Works Agency for Palestinian Refugees in the Near East.
A bigger question will be the extent to which the US cuts its voluntary contributions to UN programmes. A substantial proportion of these voluntary contributions have traditionally come through the US Agency for International Development, where payments have recently been suspended.
