Public debt exceeds 100% of GDP for first time since 1963

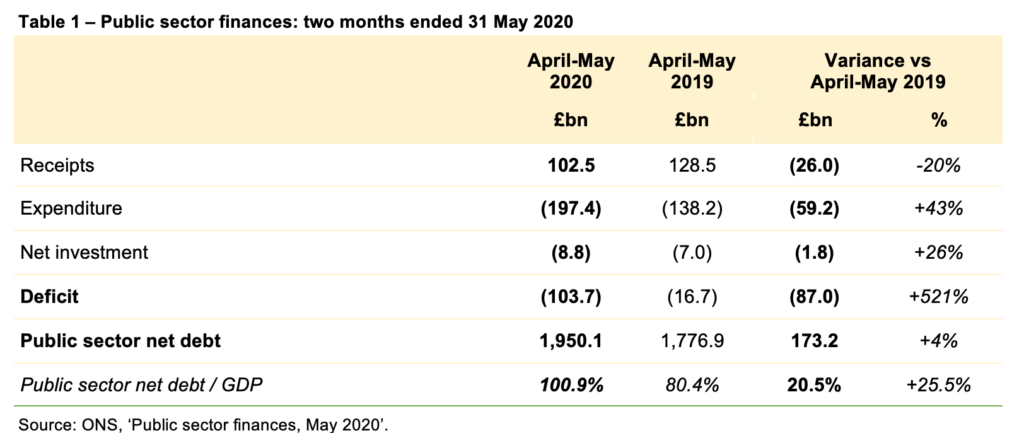
22 June 2020: The fiscal deficit of £103.7bn for April and May 2020 is over six times as large as the £16.7bn reported for the same period last year.

The latest public sector finances for May 2020 published by the Office for National Statistics (ONS) on Friday 19 June 2020 reported a revised deficit of £48.5bn for April and a deficit of £55.2bn for May 2020.

Public sector net debt increased to £1,950.1bn or 100.9% of GDP, an increase of £173.2bn (up 20.5 percentage points) compared with April 2019. This is the first time the headline debt number has exceeded 100% of GDP since 1963, although the ONS cautions that the numbers for the deficit and for GDP are both subject to potentially significant revisions.

Table showing receipts, expenditure, net investment, deficit and public sector net debt.  Details available on ICAEW article - click link at end of this post.

These results reflect the substantial fiscal interventions by the UK Government to support businesses and individuals affected by the coronavirus pandemic, together with a collapse in tax revenues as a consequence of the lockdown.

The deficit of £103.7bn for the two months to May is more than the budgeted deficit of £55bn for the whole of the 2020-21 financial year set in the Spring Budget in March.

Cash funding (aka the ‘public sector net cash requirement’) for the two months was £143.5bn, compared with £1.8bn for the same period in 2019.

Some caution is needed with respect to the numbers published by the ONS, which are expected to be revised as estimates are refined and gaps in the underlying data are filled.

Alison Ring, director of public sector for ICAEW, commented:

“Significant borrowing over recent months means that this is the first time in more than 50 years that debt has been larger than GDP. And though the furlough scheme to date has cost less than originally estimated, cash funding in April and May was more than in the previous three financial years combined.

These are major milestones for the public finances and demonstrate the unparalleled impact of coronavirus, even if this is not surprising given the huge amounts of financial support the government is providing to keep the economy going through lockdown.”

This article was originally published by ICAEW.

Treasury backs PAC in battle over recommendations

17 June 2020: Treasury writes stern ‘Dear Accounting Officer’ letter instructing departments to stop delaying compliance with PAC recommendations.

In a co-ordinated move, the Public Accounts Committee (PAC) and HM Treasury issued instructions to government departments to stop unilaterally extending the deadlines on addressing PAC recommendations, and to write to the PAC promptly to explain any delays in completing agreed actions.

Meg Hiller MP, Chair of the PAC, recently wrote to HM Treasury complaining about the behaviour of some departments who have been deferring implementation of agreed actions to address PAC recommendations and doing so without providing an explanation for the delay. Sometimes the PAC only finds out about delays many months after deadlines have been missed.

In response, Treasury has issued a ‘Dear Accounting Officer’ letter instructing departments to ensure systems are in place to monitor progress on implementing recommendations and to write to the PAC immediately it becomes clear that a recommendation is no longer on track to be implemented by the agreed target date. Departments need to provide a detailed explanation for a deferral together with a revised date for completion.

Martin Wheatcroft FCA, advisor to ICAEW on public finances, said:

“This is an unusual and very public shot across the bows of departments. It brings out into the open the frustration felt by both the Public Accounts Committee and Treasury when weaknesses in systems and processes identified by the PAC are not dealt with as planned.

Permanent Secretaries are now on notice that any backsliding on implementing agreed actions is not acceptable, and that attempting to slip missed deadlines past the PAC in routine reports many months later is not going to work anymore.”

This article was originally published by ICAEW.

ICAEW chart of the week: PFI contracts past their peak

12 June 2020: PFI contract payments have started to decline following a peak of £10.2bn in 2019-20.

The #icaewchartoftheweek is on private finance initiative (PFI) contracts, illustrating how payments on the UK’s portfolio of over 700 ongoing PFI and PFI2 contracts reached a peak of £10.2bn in the financial year ended 31 March 2020.

Total payments are expected to fall over the years to come as contracts start to come to the end of their (in most cases) 25 to 30-year terms, with the majority scheduled to expire between 2025 and 2050.

The tailing off of payments reflects the lack of new PFI deals to replace expiring contracts since 2010, when PFI2 was introduced without much success and the announcement in 2018 that PFI was over. News is still awaited on whether a new model for public-private partnerships will be adopted to replace PFI, following on from the Infrastructure Finance Review.

In the meantime, the remaining 704 ongoing contracts still need to be managed, including ensuring assets are handed back to public sector in good condition. This will be a big challenge for public bodies, with the National Audit Office recommending that preparations start seven years in advance of the end of each PFI contract.

This chart was originally published by ICAEW.

Challenges for public bodies as PFI contracts end

8 June 2020: An NAO report has recommended that public bodies start preparations seven years before PFI contracts expire to negotiate the handover of assets and ensure service delivery is not disrupted.

The National Audit Office (NAO) has issued a report on the challenges public bodies are facing as private finance initiative (PFI) contracts come to an end. 

There are over 700 PFI contracts in the UK involving assets with a capital value of £57bn. Of these, 72 are due to expire over the next seven years in England, with an estimated £3.9bn of assets expected to revert to public sector ownership in that time.

The NAO is the independent audit body responsible for scrutinising public spending on behalf of Parliament. In addition to auditing the financial accounts of departments and other public bodies, the NAO examines and reports on the value for money of how public money has been spent.

PFI is a contracting approach where public bodies acquire the right to use an asset embedded within a long-term service contract. PFI contracts are typically for periods of up to 25 years and were used extensively from the late 1990s until the early 2010s to build a range of assets including (but not limited to) schools, hospitals, offices, transport infrastructure and military equipment. 

Most PFI contracts expire from 2025 onwards, meaning there has so far only been a limited number of practical examples to learn from. Of those, the NAO reports that four out nine of the public bodies they surveyed were dissatisfied with the condition of PFI assets at expiry.

Key findings in the report include:

  • The public sector does not have a strategic or consistent approach to PFI contract expiry and risks failing to secure value for money in negotiations with the private sector
  • There is a risk of increased costs and service disruptions if public bodies do not prepare for contract expiry adequately in advance
  • Insufficient knowledge about asset condition risks them being returned in worse quality than expected
  • Contract expiry is resource-intensive and requires different skills, with external consultants needed in most cases
  • Many public bodies start preparing four years or more before expiry, but experience suggests that preparation time is often underestimated. Infrastructure & Projects Authority (IPA) guidance is seven years
  • There is a potential for disputes, especially as PFI providers often have a financial incentive to cut spending on asset maintenance and rectification towards the end of a contract
  • Early PFI contracts are likely to be ambiguous about roles and responsibilities at contract expiry, with poorly drafted clauses open to interpretation.

The NAO recommends that public bodies and sponsor departments start preparing for contract expiry on a timely basis, ensure the PFI contract is complete and expiry provisions are well understood, develop a contract expiry plan and escalate problems which cannot be resolved at a local level. It also recommends that adequate funding is provided to cover dispute resolution and hiring additional resources.

The NAO believes that the IPA and sponsor departments have key roles to play in supporting public bodies and departmental teams responsible for PFI contracts with resources, sector-specific expertise, specialist advice and training. They need to identify high-risk contracts, such as those sitting with public bodies that lack appropriate skills and capabilities, and potentially establish an electronic repository to enable a more consistent approach across government.

The NAO says the IPA should assess the value of money of establishing a centralised pool of internal resources, such as lawyers and surveyors, that authorities can use, provide contract expiry guidance and terms of reference for consultants, develop a consistent approach to resolving legal disputes, and develop an investor strategy to manage relationships with PFI equity investors, management service companies, and contractors.

The report’s final recommendation is to HM Treasury, saying it should provide funding to departments assisting financially constrained public bodies where it is value for money and practical to do so.

Commenting on the report Alison Ring, Director, Public Sector, at ICAEW said:

“Public bodies are very experienced in the operation of ongoing PFI contracts. But with most PFI contracts not due to finish until 2025 or later, they have much less experience of managing contract expiry.

The NAO is quite right to highlight the need to start planning well in advance and the need to invest in the very different skills and expertise required to negotiate the handover of assets to ensure service delivery is not disrupted. 

The role of the Infrastructure & Projects Authority and sponsoring departments will also be critical in supporting the 182 public bodies responsible for just one PFI contract, and in ensuring that lessons learned are shared across the public sector.

With tens if not hundreds of millions of pounds at stake if public bodies get this wrong, it is extremely important that the Government is not penny wise and pound foolish by failing to invest in the sufficiently skilled resources that will be required to get the best value for money for the taxpayer as PFI contracts come to an end.”

This article was originally published by ICAEW.

ICAEW chart of the week: EU spending plans 2021-27

5 June 2020: European Commission proposes €2tn in spending over the next seven years, including a major stimulus package – as illustrated by the #icaewchartoftheweek.

Last week the European Commission submitted its formal proposal for the EU’s multiannual financial framework for 2021 through 2027. This is the outline budget that sets out the EU’s medium-term financial priorities and forms the starting point for each year’s budget.

The proposals include an annual budget for financial commitments of €167bn in 2021, rising to €192bn in 2027 – a total of €1,241bn including inflation or €1,100bn in 2018 prices. There is also a one-off €809bn (€750bn in 2018 prices) proposal for a ‘Next Generation’ economic recovery plan in the aftermath of the coronavirus pandemic, to be funded initially by borrowing.

Although the outline budget of €167bn for 2021 is smaller than the €173bn amended commitments budget for the current financial year, it is actually a significant increase once the departure of the UK is taken into account – at least assuming the UK-EU transition period is not extended for a further one or two years.

The largest area of spending is on regional and social development (‘cohesion and values’ in EU jargon), including programmes such as the European Development Fund, the European Social Fund, the Cohesion Fund and Erasmus.

This is followed by agriculture and environment, the majority of which relates to agricultural subsidies and rural development as well as environmental and climate action programmes.

Science, digital and single market includes spending on research and development (including Horizon), the European space programme, Connecting Europe (transport, energy and digitally), Digital Europe, and the operation of the single market.

Security and migration bring together ‘migration and border management’ with ‘resilience, security and defence’, while External includes the cost of development programmes (principally in neighbouring countries), humanitarian aid, and pre-accession assistance for candidate countries that have applied to join the EU.

Spending on institutions mainly comprises the administrative costs of the European Commission, the European Council and the European Parliament, together with other agencies, European Schools, and pensions.

These numbers are for spending commitments, being the maximum amounts that can be authorised in any one year. In practice, commitments can cover several years and the expenditures actually occurred in each year are typically a lower amount – for example, in 2020 budget expenditures are €155bn (including spending from previous year’s commitments), less than the €173bn commitment budget.

These numbers may seem pretty large, but with a population of 448 million, the spending proposals are equivalent to an average of just over €30 a month per person over the seven years, together with a one-off stimulus package costing a further €21 a month per person if spread over the same period.

This chart was originally published by ICAEW.

ICAEW chart of the week: borrowing to exceed half a trillion pounds

29 May 2020: Government looks to financial markets to fund large-scale fiscal interventions in the economy.

The #icaewchartoftheweek shines a light on the massive expansion in borrowing being undertaken by the UK Government as it seeks to plug an expanding gap between tax receipts and spending and fund a huge amount of loans to banks and businesses in order to try and keep the economy from collapsing.

At the Spring Budget on 11 March, HM Treasury issued a financial remit to the Debt Management Office and National Savings & Investment amounting to £162bn, comprising £98bn to fund the repayment of existing debts, £55bn to fund a planned shortfall between tax receipts and public spending (the deficit), and £9bn to fund public lending to individuals and businesses.

Since then the fiscal situation has transformed, with the Office for Budget Responsibility (OBR) suggesting that the deficit could increase by as much as £243bn to £298bn in 2020-21, while lending activities could increase by a further £168bn to £177bn. Public sector net debt at 31 March 2021 might increase by £411bn from the Spring Budget forecast of £1,819bn to £2,230bn.

The good news is that the cost of this borrowing is relatively small, with yields on ten-year gilts as low as 0.20%.

To find about more about the global and UK fiscal crisis read the ICAEW Fiscal Insight on coronavirus and public finances.

April public finances awash with red ink

27 May 2020: fiscal deficit of £62.1bn in April exceeds budget of £55bn for the whole of 2020-21.

The latest public sector finances for April 2020 published by the Office for National Statistics (ONS) reported a deficit of £62.1bn in April and a revision of £14.0bn to the deficit in the financial year to March 2020; a total of £76.1bn in costs and revenue losses reported since the previous monthly release.

Public sector net debt increased to £1,887.6bn or 97.7% of GDP, an increase of £118.4bn or 17.4 percentage points compared with April 2019.

These results reflect the substantial fiscal interventions by the UK Government to support businesses and individuals affected by the coronavirus pandemic, together with a collapse in tax revenues since the lockdown. The deficit of £62.1bn for the month of April is more than the budgeted deficit of £55bn for the whole of the 2020-21 financial year set in the Spring Budget only a couple of months ago.

Table 1 summarises the results for April 2020, while Table 2 sets out the revised results for the financial year to 31 March 2020.

Some caution is needed with respect to the numbers published by the ONS, which are expected to be revised as estimates are refined and gaps in the underlying data are filled.

Alison Ring, director of public sector for ICAEW, commented:

“The volume of red ink in April’s public finances is astonishing.

The scale of the damage from the coronavirus pandemic is only just starting to become apparent, particularly when you consider that the deficit in April alone is more than previous forecasts for the whole of 2020-21.

A full-year deficit of £300bn as suggested by the Office for Budget Responsibility looks increasingly plausible, with the only silver lining the ultra-low interest rates payable on the borrowing needed to finance it.”

This article was originally published by ICAEW.

ICAEW chart of the week: Money for nothing

22 May 2020: The UK Government is being paid to borrow money, with first negative yield gilt

Cash invested £1,026.35 (nominal value £1,000, premium and interest £26.35). Cash returned £1,026.25 (7 coupon payments £26.25, principal repayment £1,000). Net return -£0.10, yield -0.003%.

The news this week that the UK Government issued debt with a negative interest rate is the subject of the #icaewchartoftheweek. This shows how purchasers of the 0¾% Treasury Gilt 2023 at an auction on Wednesday 20 May accepted a negative yield of -0.003% on their investment.

At an average price of £102.388 for each £100 gilt or £1,023.88 for ten gilts, someone buying gilts at the auction would have paid £1,026.35 to the Government for each £1,000 of nominal value purchased, once £2.47 for interest already accrued payable with the bid is included. 

That investor will receive less money back, with 7 semi-annual coupon payments of £3.75 before repayment of the principal of £1,000 on 22 July 2023 adding up to £1,026.25, a net loss of 10p.

This is a return of just under -0.01% over 38 months on the £1,026.35 invested, equivalent to an annualised yield of -0.003%.

This is only just negative, and the UK Government still needs to pay to borrow for longer periods, with yields on 10-year and 30-year gilts still in positive territory at around +0.24% and +0.63% respectively.

Although this gilt auction is a milestone, being the first fixed-rate government bond with a duration over two years to be issued at a negative yield in the UK, this is not a new phenomenon in the world of government borrowing. For example, with 10-year and 30-year government bonds currently yielding -0.49% and -0.07% respectively, Germany’s €156bn of projected borrowing this year should end up reducing its interest bill!

Whether this presages a similar situation in the UK is unknowable, so we are not yet at the stage of money for nothing.

This chart of the week was originally published by ICAEW.

ICAEW chart of the week: US deficit

8 May 2020: Public finances around the world are being severely affected by the coronavirus pandemic, with the United States being no exception.

US federal deficit 2002 $159bn, $374bn, $413bn, $319bn, $248bn, $163bn, $455bn, 2009 $1,417bn, 2010, $1,294bn, $1,299bn, $1,089bn, $680bn, $483bn, $439bn, $587bn, $666bn, $779bn, $984bn, 2020 $3.7tn, 2021 $2.1tn.

The US Congressional Budget Office had already forecast that the federal deficit would exceed $1tn this year, but on 24 April 2020, it updated its predictions to suggest that the US federal deficit could reach $3.7tn or 18% of GDP in 2020. It is also predicting a deficit of $2.1tn or 10% of GDP in 2021.
 
These are substantially larger than the deficits experienced a decade ago during the financial crisis, reflecting a combination of a massive shock to the US economy and a series of large scale fiscal interventions on an unprecedented scale.
 
The CBO prediction is heavily caveated given the prospect of further fiscal interventions and the potential for a second wave of infection in the fall, so watch this space for further developments in the increasingly topical subject of accounting for governments.

This chart of the week was originally published by ICAEW.

ICAEW chart of the week: UK gilt issues

1 May 2020: The unsung heroes at the Debt Management Office (DMO) have swung into action as the UK Government has started to burn through cash at an astonishing rate, as illustrated by the #icaewchartoftheweek.

Chart. Cash raised 2019-20: £10bn, £10bn, £10bn, £13bn, £8bn, £12bn, £12bn, £12bn, £10bn, £13bn, £12bn, £15bn. Cash raised 2020-21: April £58bn.

The DMO, the low-profile unit within HM Treasury responsible for the national debt, raised an astonishing £58bn from selling gilt-edged government securities in April, compared with an average of £11bn obtained each month in the financial year to March. The size and frequency of gilt auctions went from an average of £2.6bn from one auction a week in 2019-20 to £3.2bn from four auctions a week in April.

The scale of the challenge became apparent in March as the Government announced a series of eye-watering fiscal interventions, with the DMO going overdrawn by £18.5bn to keep the Government supplied with cash in advance of ramping up gilt auctions in April.

Fortunately, the DMO is able to finance the Government at ultra-low rates of interest at the moment, with auctions oversubscribed and yields on 10-year gilts at just over 0.3% during the course of April. If maintained, the incremental cost of the additional £384bn in public sector net debt in 2020-21 set out by the Office for Budget Responsibility in its coronavirus reference scenario would be less than £2bn a year.

A legacy of debt for future generations to deal with, but – at least for now – a relatively cheap burden to service.

This chart of the week was originally published by ICAEW.