ICAEW chart of the week: UK international trade

My chart for ICAEW this week is inspired by International Trade Week and looks at where UK imports come from and exports go to, ahead of what might be some major changes in US trade policy when President-elect Trump assumes office on 20 January 2025.
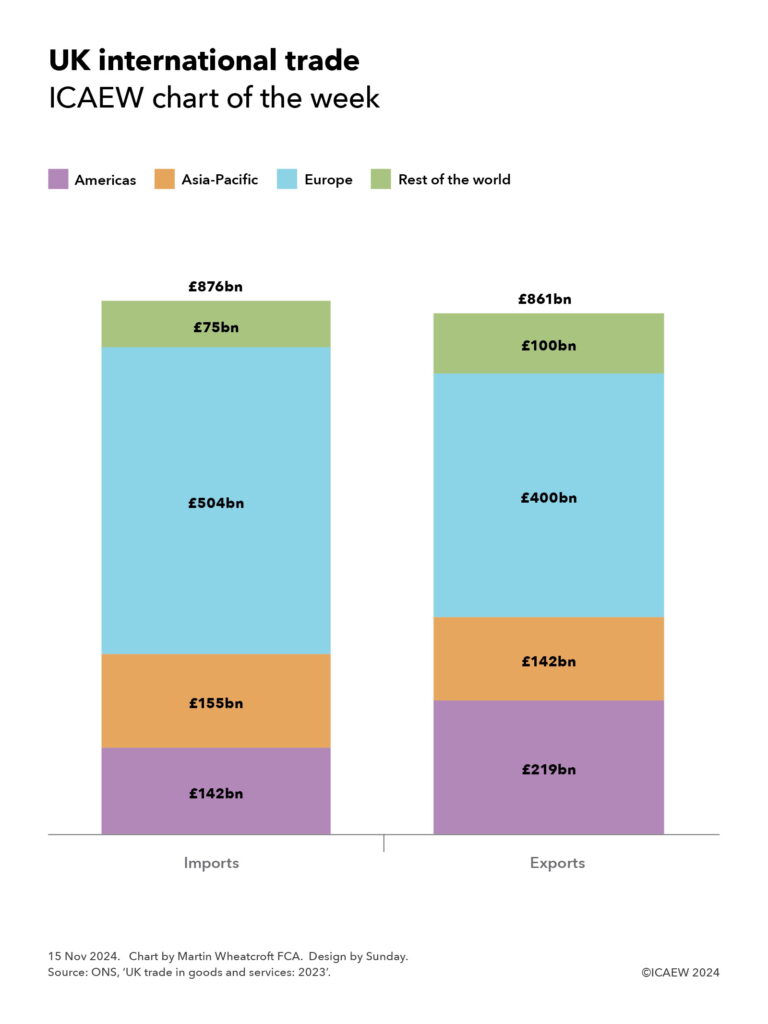
Column chart showing imports and exports to and from the UK in 2023.

Imports: Americas £142bn + Asia-Pacfic £155bn + Europe £504bn + Rest of the world £75bn = £876bn.

Exports: Americas £219bn + Asia-Pacific £142bn + Europe £400bn + Rest of the world £100bn = £861bn.

My chart of the week illustrates how UK imports in 2023 totalled £876bn, £15bn more than total exports of £861bn.

Imports comprise £142bn (16%) from the Americas, £155bn (18%) from Asia-Pacific, £504bn (57%) from European countries, and £75bn (9%) from the rest of the world. Exports comprise £219bn (25%) to the Americas, £142bn (16%) to Asia-Pacific, £400bn (46%) to European countries, and £100bn (12%) to the rest of the world.

Imports can be analysed between £581bn in goods and £295bn in services, while exports can be broken down into £393bn in goods and £468bn in services, meaning the UK had a trade deficit of £188bn in goods and a trade surplus of £173bn in services in 2023.

The UK’s largest overall trade partner is the EU, which makes up most of the UK’s trade with countries in Europe, while its largest individual trade partner is the US. Excluding Germany (the largest country in the EU), the UK’s next largest trade partner is China. Together, imports from these three economies add up to £635bn or 72% of the total, while exports to the US, EU and China equate to £594bn or 69% of the total.

International Trade Week is an opportunity to celebrate the successes of the UK’s importers in sourcing the goods and services that individuals and businesses need and of the UK’s exporters in selling goods and services around the world. 

However, this time around all eyes are on the result of the US general election, and what the potential trade policies of the incoming US administration under Donald Trump might mean for the UK. Not only could they result in major changes in how trade is conducted between the UK and the US (17% of our total trade), but also between the UK and the EU (46%), and between the UK and China (7%).

We trade in interesting times.

Major trading partners

Americas

US – £115bn imports (£58bn goods, £57bn services); £187bn exports (£60bn goods, £127bn services)

Canada – £9bn imports (£5bn goods, £4bn services); £16bn exports (£7bn goods, £9bn services)

Brazil – £5bn imports (£4bn goods, £1bn services); £6bn exports (£3bn goods, £3bn services)

Other countries in the Americas – £13bn imports (£7bn goods, £6bn services), £10bn exports (£5bn goods, £5bn services)

Asia-Pacific

China (including Hong Kong) – £69bn imports (£61bn goods, £8bn services); £51bn exports (£32bn goods, £19bn services)

India – £24bn imports (£10bn goods, £14bn services); £16bn exports (£6bn goods, £10bn services)

ASEAN – £22bn imports (£14bn goods, £8bn services); £25bn exports (£12bn goods, £13bn services)

Japan – £14bn imports (£8bn goods, £6bn services); £14bn exports (£6bn goods, £8bn services)

Australia – £6bn imports (£2bn goods, £4bn services); £15bn exports (£5bn goods, £10bn services)

South Korea – £7bn imports (£6bn goods, £1bn services); £10bn exports (£6bn goods, £4bn services)

Other countries in Asia-Pacific – £13bn imports (£8bn goods, £5bn services); £11bn exports (£4bn goods, £7bn services)

Europe

EU – £451bn imports (£318bn goods, £133bn services); £356bn exports (£186bn goods, £170bn services)

EFTA – £50bn imports (£37bn goods, £13bn service); £40bn exports (£17bn goods, £23bn services)

Other European countries – £3bn imports (£1bn goods, £2bn services); £4bn exports (£3bn goods, £1bn services)

Rest of the world

Turkey – £16bn imports (£11bn goods, £5bn services); £10bn exports (£7bn goods, £3bn services)

UAE – £8bn imports (£3bn goods, £5bn services); £13bn exports (£7bn goods, £6bn services)

Saudi Arabia – £4bn imports (£3bn goods, £1bn services); £13bn exports (£5bn goods, £8bn services)

South Africa – £6bn imports (£4bn goods, £2bn services); £4bn exports (£2bn goods, £2bn services)

UK dependencies – £10bn imports (£1bn goods, £9bn services); £21bn exports (£1bn goods, £20bn services)

Everywhere else – £31bn imports (£20bn goods, £11bn services), £39bn (£18bn goods, £21bn services)
This chart was originally published by ICAEW.

ICAEW chart of the week: World population

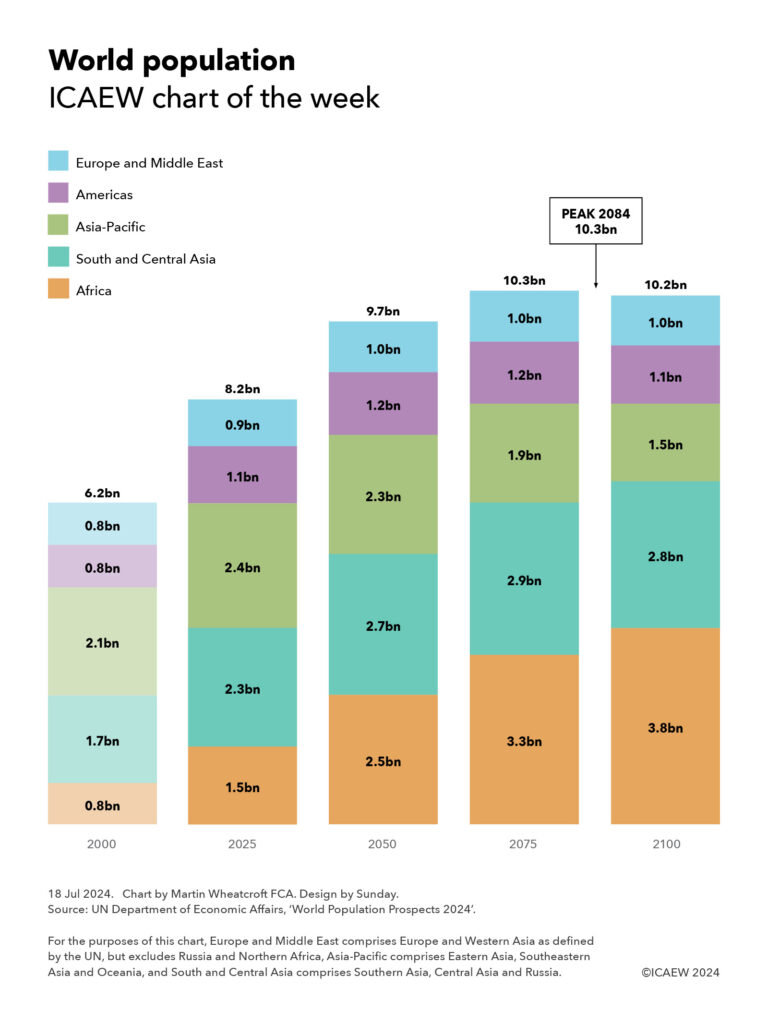
My chart for ICAEW this week looks at how a declining fertility rate means the global population is now anticipated to reach a peak of ‘just’ 10.3bn in 2084, according to the UN.

World population.
ICAEW chart of the week. 

Column chart showing the world’s population in 2000, 2025, 2050, 2075 and 2100. 

Europe and Middle East – 0.8bn, 0.9bn, 1.0bn, 1.0bn and 1.0bn. 
Americas – 0.8bn, 1.1bn, 1.2bn, 1.2bn and 1.1bn. 
Asia-Pacific – 2.1bn, 2.4bn, 2.3bn, 1.9bn and 1.5bn. 
South and Central Asia – 1.7bn, 2.3bn, 2.7bn, 2.9bn and 2.8bn. 
Africa – 0.8bn, 1.5bn, 2.5bn, 3.3bn and 3.8bn. 

Total – 6.2bn, 8.2bn, 9.7bn, 10.3bn (10,250m) and 10.2bn (10,180m), with a peak of 10.3bn (10,289m) in 2084. 

For the purposes of this chart, Europe and Middle East comprises Europe and Western Asia as defined by the UN but excludes Russia and Northern Africa, Asia-Pacific comprises Eastern Asia, Southeastern Asia and Oceania, and South and Central Asia comprises Southern Asia, Central Asia and Russia. 


18 Jul 2024.   Chart by Martin Wheatcroft FCA. Design by Sunday. 

Source: UN Department of Economic Affairs, ‘World Population Prospects’. 


© ICAEW 2024

The Population Division of the UN Department of Economic and Social Affairs (UN DESA) recently published its latest population projections for the 21st century. Its central projection is for the world’s population to increase from 8.2bn next year to a peak of 10.3bn in 2084 in 2084 before falling slightly to 10.2bn at the end of the century.

This means that the population will have increased by 2.0bn between 2000 and 2025 and is projected to increase by 1.5bn over the next 25 years to 9.7bn in 2050 and by 0.6bn to 10.3bn in 2075, before gradually starting to fall from 2084 onwards.

My chart illustrates how this change differs by region, with the population of Africa expected to grow throughout the century from 1.5bn in 2025 to 3.8bn in 2100. South and Central Asia, which has seen its population grow from 1.7bn in 2000 to an anticipated 2.3bn next year, is expected to see further growth to 2.9bn in 2075 before then falling to 2.8bn in 2100, while the population of the Asia-Pacific region is expected to increase from 2.1bn in 2000 to 2.4bn in 2025, is expected to fall gradually from 2030 onwards to 1.5bn in 2100.

The population of the Americas is expected to grow slightly from 1.1bn in 2025 (up from 0.8bn in 2000) to 1.2bn before falling back to 1.1bn by 2100, while Europe and Middle East’s population is expected to increase from 0.9bn in 2025 (up from 0.8bn in 2000) to close to 1.0bn in 2050 and for the rest of the century.

UN DESA says the main driver of global population increase over the next 60 years until it peaks is the momentum created by growth in the past, with increases in the number of women of reproductive age until the late 2050s offsetting a declining fertility rate – currently one child fewer on average than in the 1990s (2.25 live births per woman currently compared with 3.31 in 1990). They also project that the number of people aged 65 will reach 2.2bn in 2080, surpassing the number of children under 18 in that year.

The declining fertility rate is one reason that the UN are projecting that the world’s population in 2100 will be 700m or 6% smaller than they were anticipating a decade ago, despite life expectancy starting to increase again after falling during the COVID-19 pandemic.

For some countries and areas, the declines in population are expected to be quite significant over the remainder of the century, such as the populations of China and Japan, which are expected to reduce from 1,416m to 633m and from 123m to 77m between 2025 and 2100 respectively. Meanwhile India is expected to grow from a population of 1,464m in 2025 to a peak of 1,701m in 2061 before falling to 1,505m in 2100.

Many other countries and areas have already or will shortly see their populations start to decline, except for about 52 countries and areas up until 2054, and 62 up until 2100, where immigration will be the main driver of population growth. The latter includes the UK, where the population is expected to rise from 70m in 2025 to a peak of 76m in 2073 before falling to 74m in 2100, and the US, expected to grow from 347m in 2025 to 421m in 2100.

According to the analysis by the UN, there are around 100 countries and areas (out of the 237 included in their analysis) with relatively youthful populations over the next half century that have a window of opportunity to accelerate their economic development. This ‘demographic dividend’ occurs when the share of the population of working ages is increasing faster than the overall population and a substantial and sustained decline in fertility increases the numbers available to work, assuming the countries concerned can put in the investment needed to take advantage of this opportunity.

This chart was originally published by ICAEW.