Our chart this week takes a look at trade between the US and Canada, a major factor in Canada’s recent general election.
Trade between Canada and the US has become a major political issue since the inauguration of President Trump, and is generally accepted to have had a significant influence on the outcome of Canada’s general election on 28 April 2025, with former Bank of England Governor Mark Carney elected as prime minister.
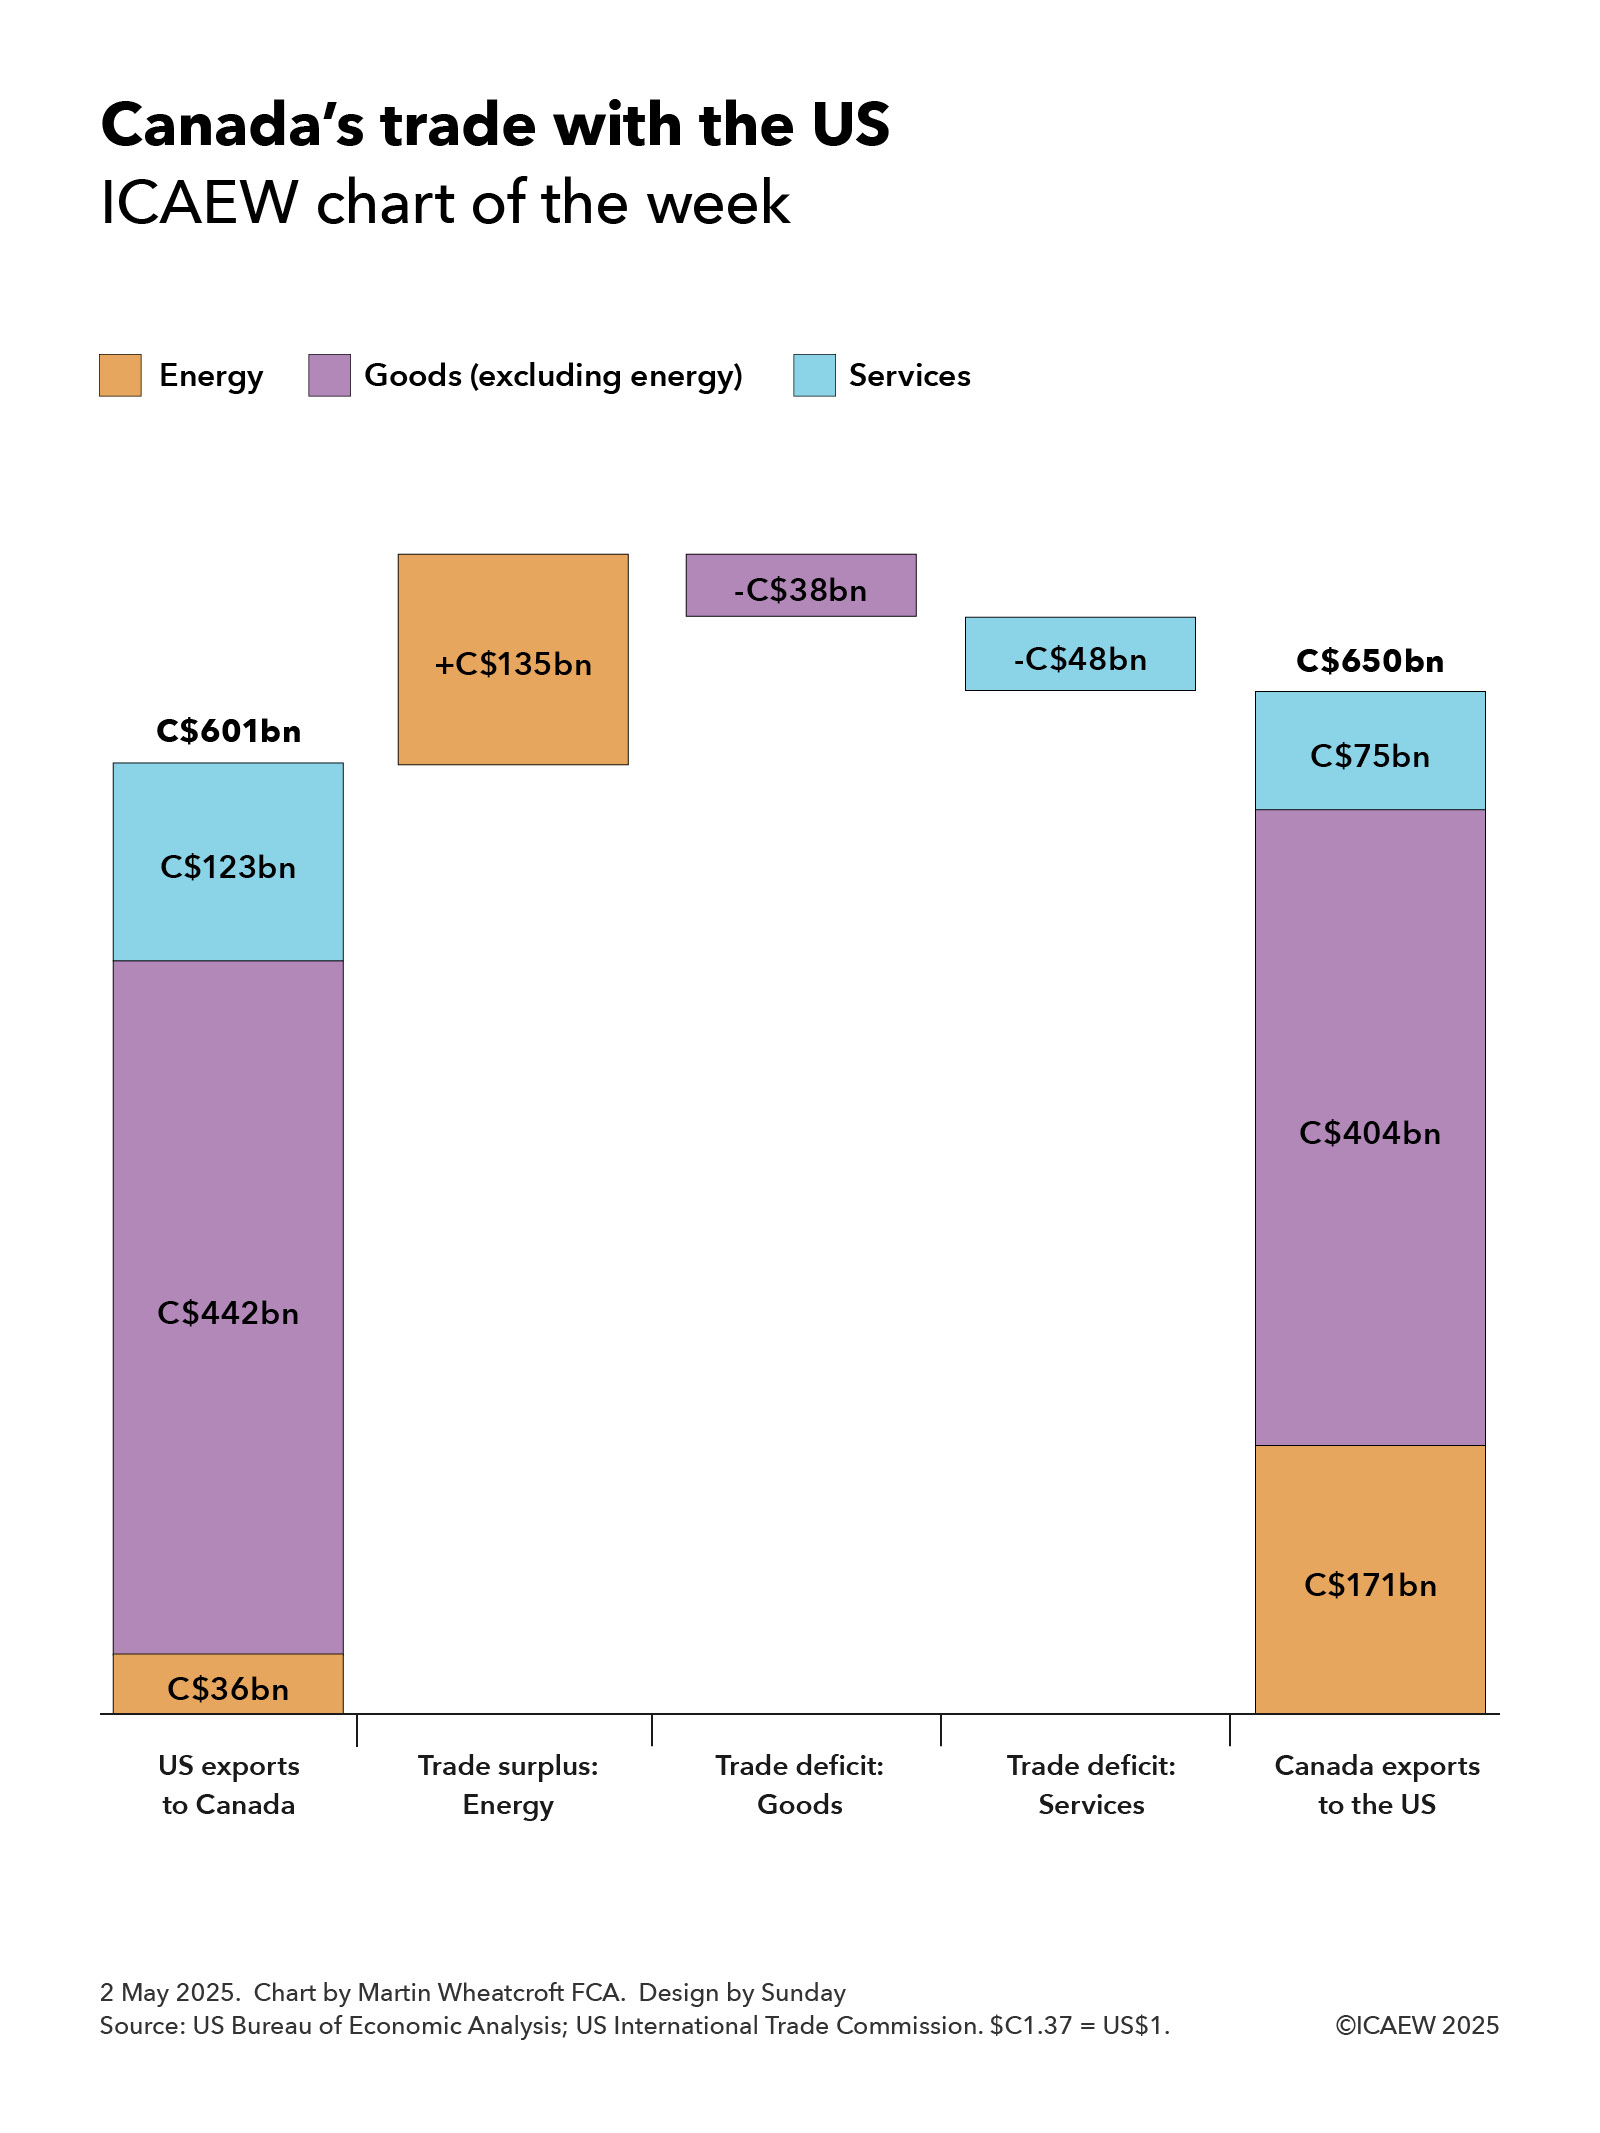
Our chart this week looks at trade between the two countries in 2014, based on statistics from the US Bureau of Economic Statistics and the US International Trade Commission, translated into Canadian dollars at an average exchange rate in 2024 of C$1.37 = US$1.00.
According to these statistics, Canada had an annual trade surplus with the US of C$49bn, representing the difference between imports from the US of C$601bn and exports to the US of C$650bn.
This can be analysed between a net trade surplus of C$135bn on energy and trade deficits of C$38bn on goods (excluding energy) and C$48bn on services. These represent the difference between US exports to Canada of C$36bn, C$442bn and C$123bn for energy, goods (excluding energy) and services respectively and Canadian exports to the US of C$171bn, C$404bn and C$75bn.
The picture presented by the chart is perhaps not entirely surprising given Canada’s abundant natural resources and the intertwining of its economy with that of its neighbour. Canadians collectively receive large amounts of US dollars for supplying energy that are then used to purchase goods and services from the US and to invest in the US.
President Trump’s on/off tariffs on Canada over the past couple of months, together with retaliatory actions by Canada, are believed to have already had a major impact on trade between the two countries, and this will become more visible as data becomes available over the next few months.
It is difficult to know where trade discussions between the two countries will end up, but Canada does have some cards to play, despite being highly dependent on trade with the world’s biggest economy. While import tariffs were part of their original response and remain an option, they also have the ability – used in past trade disputes – to put export tariffs on commodities such as crude oil and lumber that are essential to US industry and the daily lives of consumers.
Doing so could add significantly to the inflationary pressures that the US is already experiencing from the tariffs it has placed on imports from China and the rest of the world.
O Canada.