ICAEW chart of the week: Eurozone government bond yields

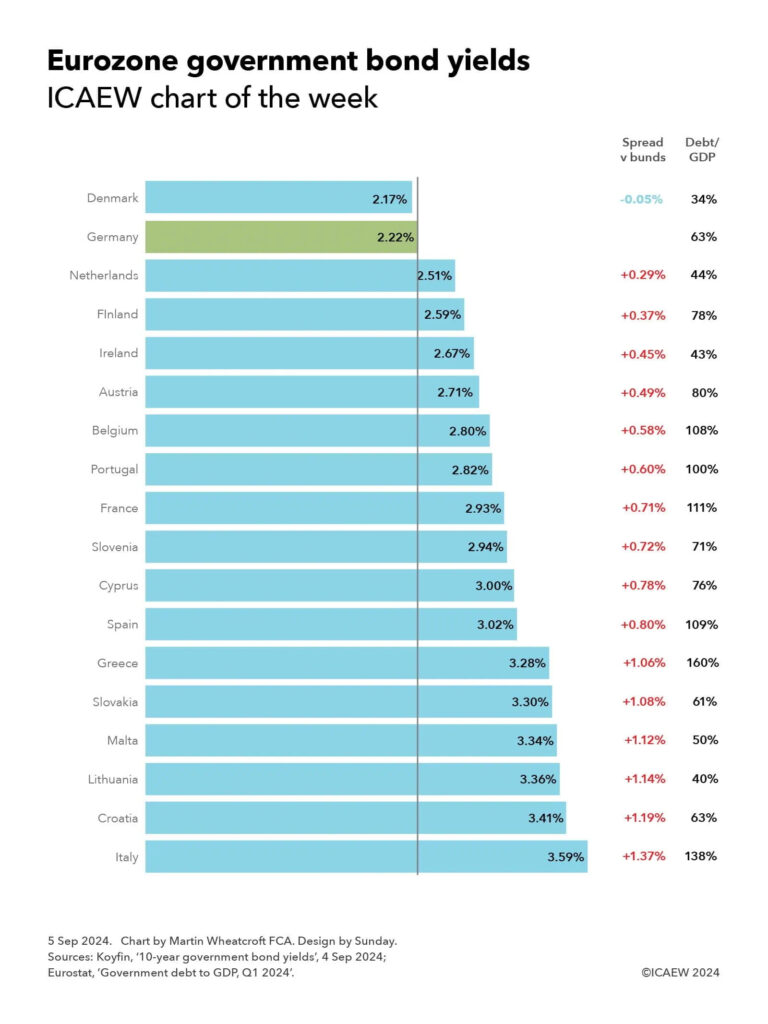
My chart for ICAEW this week is on the cost of government borrowing in the Eurozone, which on 4 September ranged from 2.17% for Danish 10-year bonds up to 3.59% for their Italian equivalents.
ICAEW chart of the week: Eurozone government bond yields. 
 
Bar chart showing the yields on 10-year government bonds on 4 September 2024, the spread versus German bunds, and each countries’ debt to GDP at the end of the first quarter of 2024. 

Denmark: 2.17% yield, -0.05% spread, 34% debt/GDP. 
Germany: 2.22%, -, 63%. 
Netherlands: 2.51%, +0.29%, 44%. 
Finland: 2.59%, +0.37%, 78%. 
Ireland: 2.67%, +0.45%, 43%. 
Austria: 2.71%, +0.49%, 80%. 
Belgium: 2.90%, +0.58%, 108%. 
Portugal: 2.82%, +0.60%, 100%. 
France: 2.93%, +0.71%, 111%. 
Slovenia: 2.94%, +0.72%, 71%. 
Cyprus: 3.00%, +0.78%, 76%. 
Spain: 3.02%, +0.80%, 109%. 
Greece: 3.28%, +1.06%, 160%. 
Slovakia: 3.30%, +1.08%, 61%. 
Malta: 3.34%, +1.12%, 50%. 
Lithuania: 3.36%, +1.14%, 40%. 
Croatia: 3.41%, +1.19%, 63%. 
Italy: 3.59%, +1.37%, 138%. 

5 Sep 2024.   Chart by Martin Wheatcroft FCA. Design by Sunday. 

Source: Koyfin, ’10-year government bond yields’, 4 Sep 2024; Eurostat, ‘Government debt to GDP, Q1 2024’.  

© ICAEW 2024.

My chart this week is on the range of yields payable on 10-year government bonds by 18 out of the 20 countries in the Eurozone for which data is available.

The chart illustrates how investors in German 10-year government bonds (known as ‘bunds’) would have received a yield to maturity of 2.22% – or conversely the German government could have borrowed at an effective interest rate of 2.22% if issuing fresh debt at that point in time. Yields on German bunds are used as benchmark rates for government debt not just in the Eurozone, but globally.

Just one country in the Eurozone has a lower 10-year bond yield than Germany, which is Denmark at 2.17% on 4 September, which is a 0.05 percentage points or 5 basis points (bp) ‘spread’ below the benchmark bund rate. 

While quoted yields move up and down all the time, sometimes by quite large amounts, spreads are much less volatile, providing an insight into how debt investors perceive the relative risks of investing in different countries’ sovereign debt.

The next lowest yields were the Netherlands at 2.51%, with a spread of 0.29 percentage points above bunds, and Finland at 2.59% (+0.37%). This is then followed by Ireland on 2.67% (+0.45%), Austria on 2.71% (+0.49%), Belgium on 2.80% (+0.58%), Portugal on 2.82% (+0.60%), France on 2.93% (+0.71%), Slovenia on 2.94% (+0.72%), Cyprus on 3.00% (0.78%) and Spain on 3.02% (+0.80%). There is then a small jump to Greece on 3.28% (+1.06%), Slovakia on 3.30% (+1.08%), Malta on 3.34% (+1.12%), Lithuania on 3.36% (+1.14%) and Croatia on 3.41% (+1.19%). 

The highest yield for investors among Eurozone countries – and hence the highest borrowing cost for its government – is Italy with 3.59%, which is 1.37 percentage points above the effective interest rate at which Germany could in theory borrow.

Comparing the bond yields in the Eurozone provides an insight into the relative strengths and weaknesses of these countries’ public finances and economies given that they all share a currency, a central bank base interest rate (currently 3.75%), and are all in the EU Single Market and Customs Union. Comparing yields with other currencies, such as the UK’s 3.95% for example (not shown in the chart), needs to take other factors into account, such as the UK’s much higher central bank base rate of 5%.

The chart also reports the government debt to GDP levels of each country for the second quarter of 2024 according to Eurostat, which may help explain why Denmark (with debt/GDP of 34%) pays a significantly lower borrowing cost than Spain (109%). 

However, debt/GDP doesn’t explain all of the differences, with the 10-year yield on Greek government debt (debt/GDP 160%) of 3.28% for example being significantly lower than the 10-year yield on Italian government debt (debt/GDP 138%) of 3.59%. 

Not shown in the chart are Estonia (debt/GDP 24%) and Latvia (45%), both of which tend to borrow at shorter maturities.

The lack of a firm correlation between debt/GDP and bond spreads should not be surprising as debt/GDP is a relatively crude measure of public finance strength or weakness. It excludes most government assets and non-debt liabilities, the funded or unfunded nature of their social security systems, as well as a country’s medium- and longer-term economic prospects and the perceived stability of that country’s government. These are all factors debt investors take into account when deciding the level of risk that they are willing to accept when investing.
This chart was originally published by ICAEW.

ICAEW chart of the week: Government bond yields

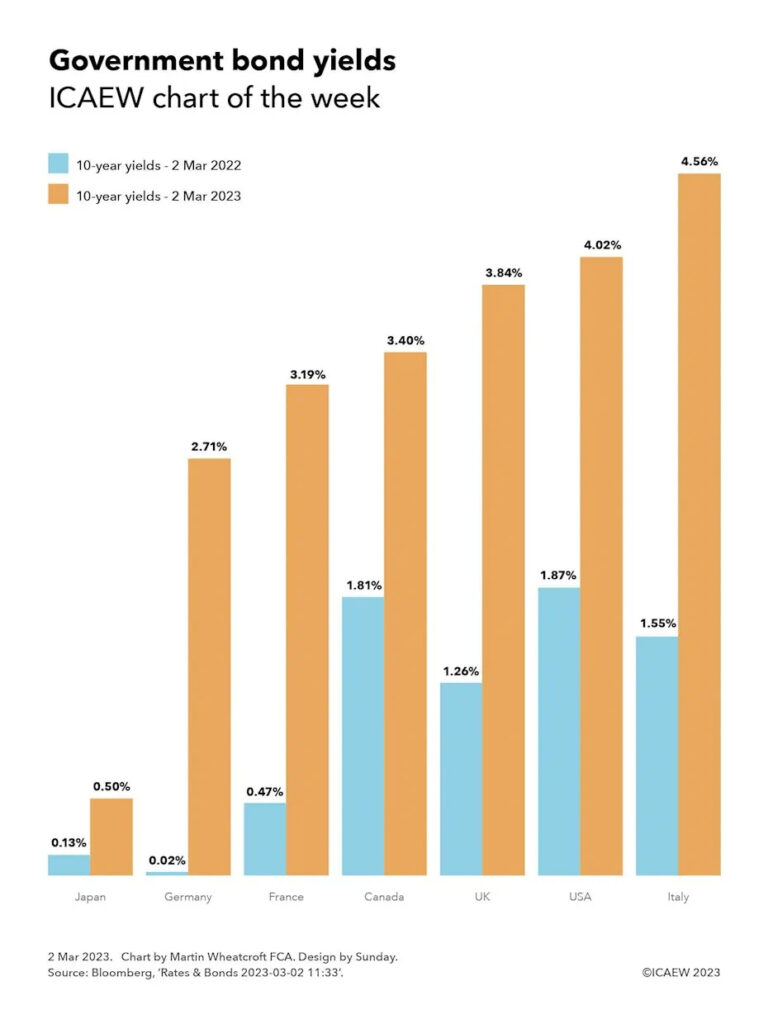
My chart this week looks at what a difference one year has made to the cost at which governments around the world can borrow.

Column chart showing 10-year yields on government debt as at 2 Mar 2022 and 2 Mar 2023.

Japan: 0.13%, 0.50%
Germany: 0.02%, 2.71%
France: 0.47%, 3.19%
Canada: 1.81%, 3.40%
UK: 1.26%, 3.84%
USA: 1.87%, 4.02%
Italy: 1.55%, 4.56%

Source: Bloomberg, 'Rates & Bonds 2023-03-02 11:33'.

The past year has seen a dramatic change in economic fundamentals around the world as inflation has surged and growth has stuttered. One of the most dramatic changes has been to the cost of new government borrowing, with the yields payable by governments to sovereign debt investors increasing significantly from where they were a year ago.

As our chart of the week illustrates, Japan has seen yields on 10-year government bonds increase from 0.13% on 2 Mar 2023 to 0.50% on 2 Mar 2023, a far cry from the negative yields it has obtained over much of the last decade when (in effect) investors were paying the government of Japan for the privilege of lending it money. The change for Germany has been even more marked, from a position a year ago where it could borrow over 10 years for almost nothing (0.02%) to today where if it wanted to raise new funds it would pay an interest rate of 2.71% over 10 years. 

The other members of the G7 have also seen the effective interest rate payable on 10-year government bonds rise, with France going from 0.47% a year ago to 3.19% today, Canada from 1.81% to 3.40%, the UK from 1.26% to 3.84%, the USA from 1.87% to 4.02%, and Italy from 1.55% to 4.56%.

Yields from 10-year government bonds are seen as a benchmark rate for most countries, as although governments can and do borrow for much longer periods – with market data often available for 20-year and 30-year bonds as well – most countries have average maturities of much shorter periods. The UK is an outlier in this respect with an average debt maturity on government securities of just over 15 years (before taking account of quantitative easing), in contrast with the more typical average maturity of seven years for Italian government debt.

Although the amount payable on new debt has risen significantly, this should in theory feed in to overall cost of government borrowing gradually as it will take time for existing government bonds to mature and be refinanced. For some time to come the overall cost of borrowing will continue to benefit from medium- and long-term government bonds that were issued at the ultra-low borrowing rates experienced over the last decade or so.

However, in practice not all government borrowing is at fixed rates, with many governments (including the UK) issuing inflation-linked debt, adding to their interest costs as inflation has surged. In addition, some government debt is short term or pays a variable rate of interest, while quantitative easing has seen central banks swap a substantial proportion of fixed-rate government bonds into variable-rate central bank deposits, increasing governments’ exposure to changes in short-term interest rates.

Either way, the rapid rise in the interest rates payable on sovereign debt marks a significant shift in the fiscal calculus for most governments when combined with much higher levels of debt in most developed countries. Lots more pounds, euros, dollars and yen will need to be diverted to servicing debt, making for hard choices for finance ministers as they work out their budgets for coming years.

This chart was originally published by ICAEW.